Sample Category Title
USD/CAD Daily Outlook
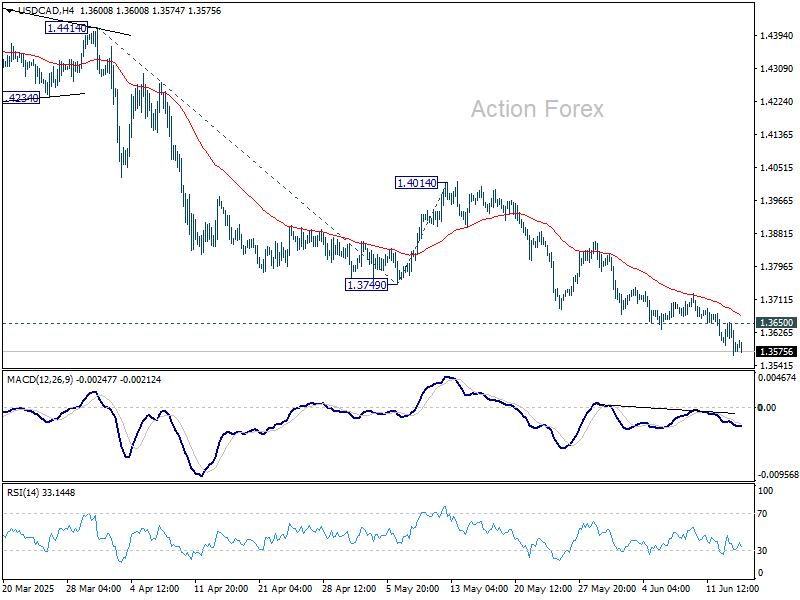
Daily Pivots: (S1) 1.3550; (P) 1.3601; (R1) 1.3635; More...
USD/CAD's decline continues today and intraday bias stays on the downside. Current fall from 1.4791 should target 100% projection of 1.4414 to 1.3749 from 1.4014 at 1.3349. On the upside, through, break of 1.3650 minor resistance will turn intraday bias neutral first.
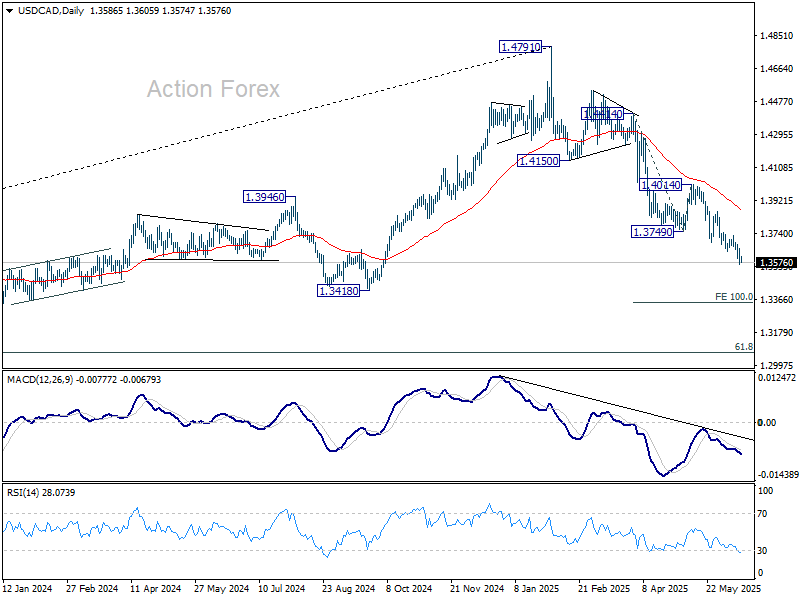
In the bigger picture, price actions from 1.4791 medium term top could either be a correction to rise from 1.2005 (2021 low), or trend reversal. In either case, further decline is expected as long as 1.4014 resistance holds. Next target is 61.8% retracement of 1.2005 (2021 low) to 1.4791 at 1.3069.
Geopolitical Headlines Trump Today’s Light Eco Calendar
Markets
Israeli strikes against Iranian energy facilities dominate headlines this morning and temporary pushed Brent crude prices from $75/b to $78/b, matching last week’s high. Attacks and counterattacks enter their third day. On Friday, geopolitical event risk pulled global stock markets over 1% lower. Higher oil prices intervened with typical risk-off correlations. Core bonds sold off with German Bunds underperforming US Treasuries. German yields added 4 bps (2-yr) to 5.7 bps (10-yr) across the curve. Changes in the US ranged between +2 bps and +3 bps. The supply-side energy shock further complicates central banks’ quest to get inflation sustainably back to 2%. In theory, they should ignore this supply shock, especially as it could dampen growth as well. That’s of course an easier thing to do when inflation is running comfortable below 2% instead of the current situation of still-above target price pressure. Visibility on the strength of the disinflationary process will be very low in coming months. Flying in the dark on inflation ceteris paribus implies sticking to longer policy rate pauses. Recall that lower oil prices (together with a stronger euro) triggered last week’s substantial downward revision to CPI forecasts this year and next and a final 25 bps ECB rate cut. The US dollar got some temporary reprieve after reaching multi-year lows earlier last week. Since the US turned net energy exporter in 2019, the dollar and oil prices became positively correlated especially during oil supply shocks and geopolitical tensions. Closing at EUR/USD 1.1549, the greenback remains vulnerable to further losses though. Especially as geopolitics often only have a short shelf-date as market-moving theme.
Geopolitical headlines trump today’s light eco calendar with only the June Empire Manufacturing survey and a $13bn 20-yr US bond auction scheduled. The ever more uncertain context risks complicating tonight’s auction more than last week’s well-received 10-yr and 30-yr sales. Market focus shifts later this week to central bank meetings in Japan (tomorrow), the US and Sweden (Wednesday) and the UK, Norway and Switzerland (Thursday). The Fed will keep its policy rate unchanged. The updated Summary of Economic Projections likely shows downward GDP revision and upwardly changed CPI forecasts. As long as the US labour market shows no signs of cracking, the only needle in the Fed’s compass is inflation. Risks for the dot plot are equally skewed to the hawkish side.
News & Views
Rating agency Fitch stripped Belgium of its double A-rating on Friday. The downgrade from AA- to A+ with a stable outlook reflects a structural weakening of the fiscal position over the last few years, offsetting the strengths of its diversified and wealthy economy. Fitch said that existing fiscal imbalances remain only partially addressed. The government outlined some 4.7% of GDP in gross savings to be implemented gradually until 2029. But Fitch citing Belgium’s Court of Audit warned for an overestimation with a third of the savings coming from second-round effects. Meanwhile, already sizeable ageing-related costs are likely to increase further while higher defense spending adds to fiscal pressures. It expects the debt ratio to continue to rise amid fiscal deficits remaining close to 5% of GDP over the medium term. This years’ shortfall would mount to 5.5%, up from 4.5% in 2024. Debt would exceed 110% of GDP by end-2026 from 104.7% last year and keep rising thereafter. Fitch projects GDP growth to slow to 0.8% in 2025.
Chinese consumption was unexpectedly strong in May. Retail sales rose by 6.4% y/y, easily topping the 4.9% expected and quickening from April’s 5.1%. The statistics office said that “[…] the efforts to stabilize economy and promote development have paid off.” Other elements have contributed as well, including an earlier than usual start of the shopping festival. That’s raising questions about the durability of last month’s improvement, particularly in the still-challenging (trade) environment. A mild slowdown in industrial production (5.8% from 6.1% y/y), in fixed asset investments (3.7%) and the continued slump in the property sector (-10.7%, deepening from 10.3%) are indicative of that. China’s yuan is unaffected by the numbers. USD/CNY holds steady at the recent lows around 7.18.
Oil Rally Remains Limited Amid Mounting Middle East Tensions
Headlines were busy over the weekend as hostilities between Iran and Israel continued. An Iranian gas field in the Persian Gulf was hit on Saturday, fueling concerns that the escalation could spill over into global energy markets. While the damage appears limited to Iran’s domestic supply, the targeted gas processing facilities are linked to offshore oil production sites, potentially threatening broader energy flows.
US crude opened the week above $76 per barrel, and Brent crude briefly pushed above $84 per barrel. However, both benchmarks quickly gave back gains. Natural gas also spiked at the open, breaking above its 100-day moving average, before retreating. The US dollar edged higher on haven flows, while gold, which opened at record levels, is also paring gains. The early trading reaction points to a surprisingly muted response from markets despite intensifying Middle East tensions.
Some analysts argue that escalating conflict could ultimately dampen global growth and cap oil’s upside. Others believe rising prices could encourage shale producers to boost output. Realistically, the risk of disruptions in the Strait of Hormuz – a critical chokepoint for a third of global oil flows – means the balance of risks remains tilted to the upside. Many experts warn that current tensions between Israel and Iran look more serious than in recent years, and that a broader conflict could send oil prices north of $100 per barrel.
In equities, European futures are trading slightly lower in Asia, while US futures are modestly higher after Friday’s sharp selloff, which saw the S&P 500 drop more than 1% amid geopolitical concerns. Energy stocks led Friday’s gains but may give back some ground as oil prices fail to build on this morning’s jump.
In corporate news, Visa and Mastercard shares fell between 4.5% and 5% on reports that Walmart and Amazon are exploring the possibility of launching their own stablecoins to reduce payment costs and delays. Such a move could mark a significant development for the digital asset space, potentially opening the door for corporate funding via token issuance rather than traditional debt or equity markets. It’s a space worth watching for the future of crypto and tokenized finance.
Back in traditional markets, Japan’s Nikkei is up nearly 1% this morning, supported by a weaker yen and reports that Japan and the EU may step up cooperation on defense industry initiatives. European defense stocks remain in focus amid rising geopolitical tensions and questions over US commitments. In contrast, Chinese equities are under pressure following mixed economic data. Retail sales growth in May surprised to the upside at 6.4% (vs <5% expected), but investment and industrial production figures disappointed, likely reflecting slower exports and the impact of tariffs. The Hang Seng slipped back below the 24,000 mark.
This week, markets will remain focused on Middle East developments, energy prices, and a slew of central bank decisions: the Fed, BoE, SNB, and BoJ are all in play.
On Tuesday, the Bank of Japan (BoJ) is expected to keep rates unchanged and slow the pace of its asset purchase tapering. With trade and geopolitical tensions mounting, the BoJ is likely to avoid additional stress on Japanese sovereign bonds. A dovish stance could cap yen appreciation, provide support for Japanese equities, and help stabilize bond markets. Many now expect the BoJ’s next rate hike won’t come before Q1 2026.
On Wednesday, the Federal Reserve (Fed) is also expected to hold rates steady. A cut before the September meeting appears unlikely. Officials are likely to remain cautious given trade-related uncertainties and may want to observe how potential tariffs affect inflation. Strong labour market data gives them breathing room. Meanwhile, the University of Michigan’s consumer sentiment index saw its largest monthly jump in June, suggesting that despite geopolitical turmoil, tariff threats, deportation debates, and social unrest, US consumers remain remarkably resilient.
On Thursday, the Bank of England (BoE) is also expected to stay on hold, despite growing concerns over the UK’s fiscal path. Meanwhile, the Swiss National Bank (SNB) is widely expected to cut its policy rate to 0% to ease upward pressure on the franc and support the economy. Trade tensions between Switzerland and the US also loom large: Swiss exporters face more than 30% tariffs if no deal is reached. So far, negotiations have yielded no breakthrough. Swiss equities have lagged their European peers since the post-April 2 rebound, recovering only about two-thirds of their March–April losses – despite broad expectations of an SNB rate cut. This suggests that unless trade frictions ease and the franc weakens, a rate cut alone may not be enough to spur risk appetite.
Amid Geopolitical Conflict, Central Banks Prepare for Rate Announcements
In focus this week
Fighting between Israel and Iran enters its fourth day with continuous air assaults from both sides. Over the weekend, the conflict continued to escalate. Israel expanded its bombardment to target Iranian energy facilities while continuing to attack nuclear sites and residential areas. Iran's retaliation similarly targeted Israel's military and energy infrastructure. Both sides have suffered civilian casualties. The expansion of the warfare to include critical energy infrastructure heightens the risks for global energy markets even if the attacks thus far have not affected global supply.
Multiple central bank rate announcements are set for release, including decisions from the Bank of Japan on Tuesday, the Fed and Riksbank on Wednesday and Norges Bank, Bank of England and the Swiss National Bank (SNB) on Thursday. We expect all but the SNB to stay on hold and expect the SNB to cut the rate 25bp to 0%.
Economic and market news
What happened overnight
China released the big monthly data batch. Retail sales rose much stronger than expected from 5.1% y/y to 6.4% y/y (cons: 4.9% y/y), likely due to a trade-in program. To get a sustained lift in consumption, a housing recovery is somewhat necessary. Home sales stayed at a weak level in May and the data now looks more like stabilisation at a low level than the moderate recovery that seemed to be materialising in Q1. Home prices also dropped at a faster rate in May with new home prices down -0.22% m/m from -0.12% m/m in April. Industrial production was close to expectations at 6.3% y/y (cons: 6.4% y/y, pre: 6.4% y/y). We look for a continued muddling through with 4.7% GDP growth this year as stimulus compensates for trade war headwinds. However, a self-sustained recovery is still at least 1-2 years away.
What happened over the weekend
In the Middle East, geopolitical tensions are once again reigniting following Israel's strike on Iran early Friday morning. The fighting is expected to drag on as Israel has hinted that the operation is likely to last for weeks, not days. Iran, in turn, has communicated that it would be willing to stop the attacks if Israel did the same. The nuclear talks between the US and Iran are cancelled until further notice. Key triggers for escalation from the markets perspective include: 1) Israeli attacks disrupting Iranian oil production, 2) Iran or its proxies targeting Gulf oil production sites, 3) Iran targeting US bases, 4) Iran disrupting traffic via the Strait of Hormuz as a last resort. Regarding triggers 2-4, the US would find it hard not to intervene.
In the US, the University of Michigan's June flash survey signaled further improvement in sentiment and lower inflation expectations. Sentiment improved to 60.5 from 52.2 in May, significantly overshooting consensus expectations of 53.5. Preliminary 1-year inflation expectations improved to 5.1% in June from 6.6% in May. While we expect no firm guidance from the Fed on Wednesday, this should make it easier to think about further rate cuts towards fall this year.
In the euro area, industrial production data for April showed a steep decline of 2.4% m/m following a gain of 2.6% m/m in March. The decline was larger than consensus expectations of -1.7% m/m. However, the decline was mainly due to volatile Irish production numbers, and excluding Ireland, production merely declined by 0.7% m/m in the euro area after rising 1.1% in April.
In Sweden, Friday's inflation figures aligned with the preliminary estimates. The CPI figures were 0.1% m/m and 0.2% y/y, while CPIF excl. energy stood at 0.2% m/m and 2.5% y/y. Looking at the details, the effect from the temporary increase in tax deductions for home improvements was -0.2 percentage points. Adjusting CPIF excl. energy for this effect, the data print closely matched the Riksbank's forecast.
Equities: Friday's session was at first glance a textbook example of risk-off driven by a geopolitical escalation. Equities sold off sharply across both sides of the Atlantic, with cyclical sectors underperforming defensives. The VIX moved decisively higher, while energy equities stood out as notable outliers—helped by surging crude prices in anticipation of worsening geopolitical tensions. But beneath the surface, an important divergence. Despite the broader risk off, we did not see a flight to safety in Treasuries but instead we saw a sell-off! In the US equity markets on Friday, Dow -1.8%, S&P 500 -1.1%, Nasdaq -1.3% and Russell 2000 -1.9%. This morning, Asian markets are mostly higher. European equity futures are pointing lower while US once marginally higher.
FI and FX: The Iran-Israel conflict led to a worsening of the market risk sentiment on Friday, with the MSCI ACWI closing down by 1.1%. Over the weekend, Israel has targeted Iranian energy facilities, and this further increases the risk of a lasting oil market shock due to the conflict. Oil prices are slightly higher morning with Brent trading at USD75/bbl as a result. Market-based inflation expectations are also moving up, putting upward pressure on nominal rates across regions. The USD has broadly rallied across G10 since Friday, likely supported by the spike in oil prices given the US's position as a net energy exporter. Likewise, EUR/NOK continues to move lower, now trading at 11.43. Asian equity indices are slightly higher this morning following the stronger-than-expected retail sales data out from China.
Markets Calm, Geopolitics Linger as Fed, BoJ, BoE, and SNB Loom
Global markets were broadly steady on Monday, despite ongoing conflicts in the Middle East. The Nikkei led Asian bourses with a 1.26% while European indexes also opened higher. Even with Israel and Iran continuing to exchange military strikes, investor sentiment remained resilient. US equity futures are also treading water, suggesting cautiousness rather than panic ahead of a high-stakes week for global monetary policy.
Oil prices ticked higher on geopolitical concerns but quickly settled back into Friday’s range, indicating that markets are becoming more conditioned to the risk headlines unless there is a major disruption to oil flows. Meanwhile, Gold gave back early gains after briefly spiking near a two-month high. The pullback reflects a modest unwinding of haven flows as traders turn their focus to upcoming central bank decisions and data rather than reacting solely to geopolitical developments.
This week will be busy, with four major central banks—Fed, BoJ, BoE, and SNB—set to announce policy decisions. The backdrop is particularly complex: markets are navigating geopolitical flare-ups, looming tariff deadlines, and a busy calendar of economic data including retail sales, inflation, and employment reports. Investors will be looking for clues not only on rate direction but also on how policymakers assess the broader risk outlook.
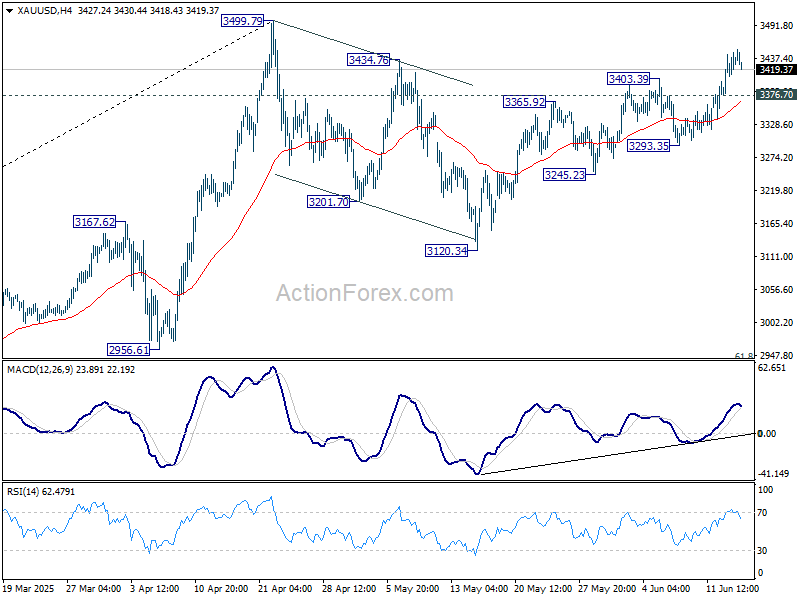
Technically, further rise is expected in Gold as long as 3376.70 minor support holds, for retesting 3499.79 high. Decisive break there will resume larger up trend. Nevertheless, break of 3376.70 will turn focus back to 3293.35 support. Firm break there will argue that corrective pattern from 3499.79 is extending with another falling leg.
In Asia, Nikkei rose 1.26%. Hong Kong HSI is up 0.84%. China Shanghai SSE is up 0.35%. Singapore Strait Times is up 0.02%. Japan 10-year JGB yield rose 0.06 to 1.462.
ECB's Nagel warns against premature policy commitment
German ECB Governing Council member Joachim Nagel struck a cautious tone at a conference today, warning against locking in any specific policy path amid persistent global uncertainty.
Markets currently price in only one more rate cut by year-end. But Nagel resisted endorsing that outlook, stressing that rapidly evolving conditions make it unwise to pre-commit.
“We must keep our eyes and ears open for the risks to price stability,” he said, pointing specifically to current developments in the Middle East as a source of heightened uncertainty.
Nagel also offered a downbeat assessment of Germany’s near-term prospects, forecasting stagnation in Q2 and flagging the global trade war as a significant drag. He estimated that escalating trade tensions could shave as much as 0.75 percentage points off German growth over the medium term.
ECB’s de Guindos sees inflation risks balanced, Euro strength not a concern
In a Reuters interview, ECB Vice President Luis de Guindos downplayed concerns over a return to the ultra-low inflation era of the 2010s, despite the recent strengthening of Euro. De Guindos acknowledged that these developments could weigh on headline inflation but emphasized that “the risk of undershooting is very limited.” He maintained that inflation risks are now "balanced". Euro’s recent appreciation was neither rapid nor volatile, and therefore "not going to be a big obstacle" at 1.15 level.
De Guindos expressed confidence that inflation will rebound after dipping to 1.4% in Q1 2026, citing a still-tight labor market and sustained wage pressures. Compensation growth, supported by union demands, is expected to remain near 3%. This aligns with ECB’s medium-term outlook of returning inflation to its 2% target.
While stopping short of explicitly endorsing a pause, de Guindos indicated that market pricing for just one more rate cut, potentially later this year, was consistent with ECB President Christine Lagarde’s latest messaging.
“Markets have understood perfectly well what the President said about being in a good position,” he noted, adding that investors now correctly anticipate that the ECB is nearing the end of its easing cycle.
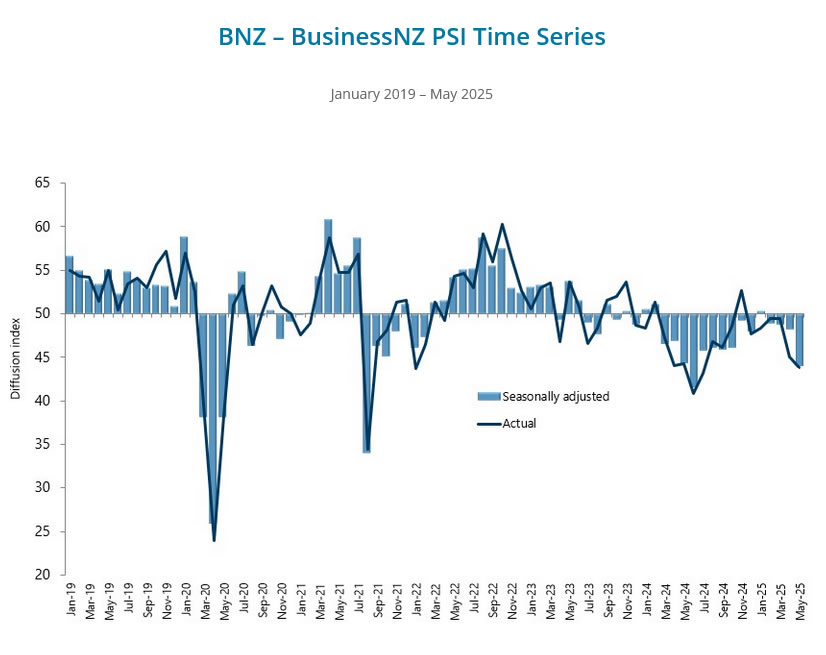
NZ BNZ services slumps to 44.0, economy returning to recession
New Zealand's services sector took a steep turn downward in May, with the BusinessNZ Performance of Services Index plunging from 48.1 to 44.0, the lowest reading since June 2024. Activity and new orders led the decline, falling from 46.7 and 50.2 to 40.1 and 43.2 respectively, as businesses reported broad-based weakness in demand. Employment also edged down from 47.9 to 47.2.
Sentiment on the ground paints an equally grim picture. Negative commentary from survey respondents rose to 65.6%, up from 61.8% in April. Businesses cited reduced consumer spending, revenue declines, and heightened uncertainty over inflation, interest rates, and the economic outlook. Many reported that customers are delaying decisions and becoming more cautious in their spending—mirroring trends typically seen during periods of economic stress.
BNZ Senior Economist Doug Steel noted that the PSI collapse closely follows the earlier fall in the Performance of Manufacturing Index, reinforcing signs of widespread economic fragility. With both key sectors now contracting, concerns are rising that New Zealand may be "returning to recession".
China's retail sales shine with 6.4% yoy growth, but production and investment drag continues
China’s latest economic data for May paints a mixed picture. Industrial production rose 5.8% yoy, falling short of the expected 6.0% and reflecting lingering weakness in external demand. This comes on the heels of a sharp -34.5% yoy drop in exports to the US, despite the mid-May rollback of some tariffs. The full impact of reduced tariffs is expected to emerge more clearly in June though.
In contrast, retail sales provided a bright spot, jumping 6.4% yoy and beating forecasts of 5.0% yoy. The rebound was supported by the government’s aggressive push to boost consumer spending through its appliance and vehicle trade-in program. The Ministry of Commerce reported that the campaign has already generated over CNY 1.1m in sales this year.
However, fixed asset investment remains a drag, growing only 3.7% ytd yoy versus expectations of 3.9%. The persistent weakness in property investment, down 10.7% in the first five months of the year, highlights ongoing strain in the real estate sector.
Four central banks, one volatile week
Markets are heading into a packed week, with four major central banks—Fed, BoJ, BoE, and SNB—set to announce policy decisions, all against the backdrop of heightened geopolitical risk, trade policy uncertainty, and a flurry of critical economic data. Alongside the rate decisions, key data including retail sales, inflation, and job report will further shape expectations.
Fed is widely expected to hold rates steady at 4.25–4.50%, with near-universal pricing in the futures market reflecting that consensus. There is little urgency for Fed to act, given the still-resilient labor market and the fiscal support flowing from new tax and spending legislation. However, the path ahead is anything but straightforward. While recent CPI and PPI data showed no clear sign of tariffs filtering through, the risk of a renewed trade war is growing. Whether tariffs are rolled back or re-escalated after the 90-day truce expires will heavily influence Fed’s next move. A Reuters poll shows economists split—55% expect rate cuts to resume in Q3, while 42% forecast cuts only in Q4 or later.
Meanwhile, oil prices are emerging as a new threat to the disinflation trend. If the Middle East conflict worsens, a sustained energy rally could delay the Fed’s easing cycle further. That’s a major variable markets will be watching, especially if headline inflation picks up again. Fed Chair Powell will likely emphasize data dependency while avoiding strong forward guidance, leaving markets to interpret incoming economic and geopolitical developments on their own.
BoJ is also expected to keep its policy rate unchanged at 0.50%. With trade tensions high, the odds of another hike this year have dropped sharply. A Reuters poll found 52% of economists now expect no further move in 2025, while over three-quarters foresee one 25bps hike by March 2026. If trade talks stabilize and global demand revives, the BoJ could reconsider tightening, but for now, the path of least resistance is to wait and observe.
BoE meets amid growing evidence of domestic weakness, including softer-than-expected GDP and labor market data. Still, policymakers are expected to hold the Bank Rate at 4.25% this week. The BoE has been moving cautiously and gradually, citing lingering inflation and wage pressures. The Monetary Policy Committee remains divided: two members pushed for a 50bps cut at the last meeting, while others voted to hold. A Reuters poll shows most economists expect 25bps cuts in both Q3 and Q4, bringing the rate down to 3.75% by year-end. However, that easing path will also hinge on upcoming inflation data, due this week.
Among the four, SNB stands out as the only one likely to ease. A 25bps cut to 0.00% is widely anticipated as SNB confronts rising deflationary pressure. May’s consumer price index fell -0.1% yoy, the first negative print in over four years. Coupled with the strong Swiss Franc, which has appreciated significantly amid geopolitical risk flows, deflation risks are intensifying. Markets are even speculating that the SNB could pre-emptively cut by 50bps or signal readiness to re-enter negative territory if warranted.
Beyond the rate decisions, other important central bank communications are scheduled too. BoC will release its summary of deliberations, and the BoJ will publish minutes of its recent meeting—both likely to offer insight into policy calibration ahead. Meanwhile, key economic data including retail sales from the US, UK, and Canada, UK CPI, and Australian employment figures.
USD/CAD Daily Outlook
Daily Pivots: (S1) 1.3550; (P) 1.3601; (R1) 1.3635; More...
USD/CAD's decline continues today and intraday bias stays on the downside. Current fall from 1.4791 should target 100% projection of 1.4414 to 1.3749 from 1.4014 at 1.3349. On the upside, through, break of 1.3650 minor resistance will turn intraday bias neutral first.
In the bigger picture, price actions from 1.4791 medium term top could either be a correction to rise from 1.2005 (2021 low), or trend reversal. In either case, further decline is expected as long as 1.4014 resistance holds. Next target is 61.8% retracement of 1.2005 (2021 low) to 1.4791 at 1.3069.
ECB’s de Guindos sees inflation risks balanced, Euro strength not a concern
In a Reuters interview, ECB Vice President Luis de Guindos downplayed concerns over a return to the ultra-low inflation era of the 2010s, despite the recent strengthening of Euro. De Guindos acknowledged that these developments could weigh on headline inflation but emphasized that “the risk of undershooting is very limited.” He maintained that inflation risks are now "balanced". Euro’s recent appreciation was neither rapid nor volatile, and therefore "not going to be a big obstacle" at 1.15 level.
De Guindos expressed confidence that inflation will rebound after dipping to 1.4% in Q1 2026, citing a still-tight labor market and sustained wage pressures. Compensation growth, supported by union demands, is expected to remain near 3%. This aligns with ECB’s medium-term outlook of returning inflation to its 2% target.
While stopping short of explicitly endorsing a pause, de Guindos indicated that market pricing for just one more rate cut, potentially later this year, was consistent with ECB President Christine Lagarde’s latest messaging.
“Markets have understood perfectly well what the President said about being in a good position,” he noted, adding that investors now correctly anticipate that the ECB is nearing the end of its easing cycle.
ECB’s Nagel warns against premature policy commitment
German ECB Governing Council member Joachim Nagel struck a cautious tone at a conference today, warning against locking in any specific policy path amid persistent global uncertainty.
Markets currently price in only one more rate cut by year-end. But Nagel resisted endorsing that outlook, stressing that rapidly evolving conditions make it unwise to pre-commit.
“We must keep our eyes and ears open for the risks to price stability,” he said, pointing specifically to current developments in the Middle East as a source of heightened uncertainty.
Nagel also offered a downbeat assessment of Germany’s near-term prospects, forecasting stagnation in Q2 and flagging the global trade war as a significant drag. He estimated that escalating trade tensions could shave as much as 0.75 percentage points off German growth over the medium term.
EUR/USD Supported for More Upside—Is The Dollar Losing Its Grip?
Key Highlights
- EUR/USD started a fresh increase above the 1.1420 resistance.
- A key bullish trend line is forming with support at 1.1500 on the 4-hour chart.
- GBP/USD is now consolidating gains near the 1.3550 zone.
- Gold prices are moving higher and might revisit $3,465.
EUR/USD Technical Analysis
The Euro gained pace for a move above 1.1400 against the US Dollar. EUR/USD even cleared the 1.1550 resistance to move further into a positive zone.
Looking at the 4-hour chart, the pair settled above the 1.1450 level, the 100 simple moving average (red, 4-hour), and the 200 simple moving average (green, 4-hour). The pair tested the 1.1630 zone and recently corrected some gains.

There was a move below the 1.1550 level. The pair tested the 1.1500 support zone where it found bids. There is also a key bullish trend line forming with support at 1.1500 on the same chart.
On the downside, immediate support is near the 1.1500 level. The next key support sits near 1.1450. Any more losses could send the pair toward the 1.1420 pivot level. The main support could be near 1.1400.
On the upside, the pair could face resistance near the 1.1565 level. The next key resistance sits near the 1.1600 level. The first major resistance sits at 1.1620. A close above the 1.1620 level could set the pace for another increase. In the stated case, the pair could even clear the 1.1650 resistance. The next major stop for the bulls could be near the 1.1800 resistance.
Looking at Gold, the price started another increase, and the bulls seem were able to clear the $2,420 level.
Upcoming Economic Events:
- NY Empire State Manufacturing Index for June 2025 – Forecast -5.5, versus -9.2 previous.
China’s retail sales shine with 6.4% yoy growth, but production and investment drag continues
China’s latest economic data for May paints a mixed picture. Industrial production rose 5.8% yoy, falling short of the expected 6.0% and reflecting lingering weakness in external demand. This comes on the heels of a sharp -34.5% yoy drop in exports to the US, despite the mid-May rollback of some tariffs. The full impact of reduced tariffs is expected to emerge more clearly in June though.
In contrast, retail sales provided a bright spot, jumping 6.4% yoy and beating forecasts of 5.0% yoy. The rebound was supported by the government’s aggressive push to boost consumer spending through its appliance and vehicle trade-in program. The Ministry of Commerce reported that the campaign has already generated over CNY 1.1m in sales this year.
However, fixed asset investment remains a drag, growing only 3.7% ytd yoy versus expectations of 3.9%. The persistent weakness in property investment, down 10.7% in the first five months of the year, highlights ongoing strain in the real estate sector.
NZ BNZ services slumps to 44.0, economy returning to recession
New Zealand's services sector took a steep turn downward in May, with the BusinessNZ Performance of Services Index plunging from 48.1 to 44.0, the lowest reading since June 2024. Activity and new orders led the decline, falling from 46.7 and 50.2 to 40.1 and 43.2 respectively, as businesses reported broad-based weakness in demand. Employment also edged down from 47.9 to 47.2.
Sentiment on the ground paints an equally grim picture. Negative commentary from survey respondents rose to 65.6%, up from 61.8% in April. Businesses cited reduced consumer spending, revenue declines, and heightened uncertainty over inflation, interest rates, and the economic outlook. Many reported that customers are delaying decisions and becoming more cautious in their spending—mirroring trends typically seen during periods of economic stress.
BNZ Senior Economist Doug Steel noted that the PSI collapse closely follows the earlier fall in the Performance of Manufacturing Index, reinforcing signs of widespread economic fragility. With both key sectors now contracting, concerns are rising that New Zealand may be "returning to recession".