Sample Category Title
Gold Wave Analysis
Gold: ⬆️ Buy
- Gold recently broke resistance level 3400.00
- Likely to rise to resistance level 3500.00
Gold recently broke the resistance level 3400.00 coinciding with the resistance trendline of the daily Triangle from April.
The breakup of the resistance level 3400.00 accelerated the active impulse wave 3 of the intermediate impulse wave (5) from the middle of May.
Gold can be expected to rise to the next major resistance level 3500.00 (former monthly high from April. which stopped the previous impulse wave (3)).

EURUSD Wave Analysis
EURUSD: ⬇️ Sell
- EURUSD reversed from the resistance level 1.1575
- Likely to fall to support level 1.1400
EURUSD currency pair recently reversed down from the resistance level 1.1575, which stopped the previous sharp impulse wave (1) in the middle of April.
The resistance zone near the resistance level 1.1575 was strengthened by the upper daily Bollinger Band.
EURUSD currency pair can be expected to fall to the next support level 1.1400 (which stopped the previous correction ii).

Markets Enter High-Risk Phase as Geopolitical and Trade Risks Collide
Global Financial markets have endured months of turmoil, with overlapping concerns over the US debt downgrade, recession fears, and an intensifying global trade war. The sharp escalation in Middle East conflict last week has only deepened the anxiety, as Israel and Iran exchanged strikes, raising the specter of prolonged regional instability.
With the 90-day reciprocal tariff truce also nearing its expiration, the weeks ahead look increasingly fraught. For investors, the challenge is no longer just about navigating volatility, but about reassessing whether the overstretch rebound in US equities since April has run its course.
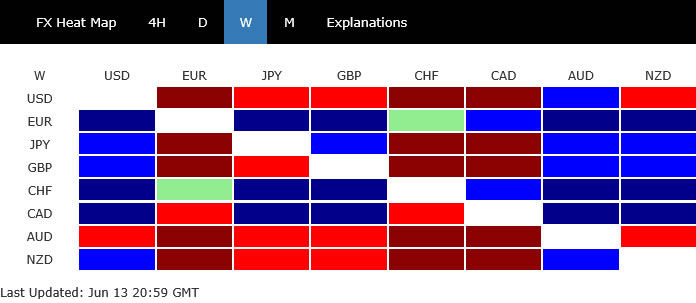
In the currency markets, the week’s performance map clearly reflected a risk-off tone. Swiss Franc stood out as the top performer, benefiting from its traditional safe haven appeal.
Euro also gained significantly, supported not only by its status as the most liquid and stable Dollar alternative, but also by growing sentiment that ECB is near the end of its easing cycle. While a recalibration cut might still be delivered later in the year, markets increasingly believe that the bulk of rate reductions is behind us.
Canadian Dollar rounded out the top three, supported not by domestic strength but by a sharp rally in oil prices amid fears of supply disruption in the Middle East.
On the flip side, Aussie was the week's worst performer, weighed by its sensitivity to global risk sentiment. Dollar fared little better, finishing second worst despite a bounce late in the week as traders tentatively reconsidered its geopolitical hedge appeal. Kiwi also landed among the bottom performers.
Sterling ended in the middle of the pack but underperformed its European peers, dragged down by weak UK jobs and GDP data that reinforced expectations for BoE rate cut in August (not the upcoming meeting.. Meanwhile, the Japanese Yen also finished mid-table, with markets becoming less convinced that BoJ will tighten policy again this year.
Middle East Escalation Overshadows Market Worries
The sharp escalation in the Middle East conflict has rapidly overtaken other key market concerns—including trade war, US fiscal uncertainty, and recession risks—and is now the dominant driver of global sentiment.
Israel’s largest-ever airstrike on Iranian ballistic missile infrastructure and senior military leaders, followed by Iran’s retaliatory attacks on Israeli cities, marks a dangerous turning point in the regional conflict. What was initially feared as a one-off strike now could quickly become the start of a drawn-out military campaign.
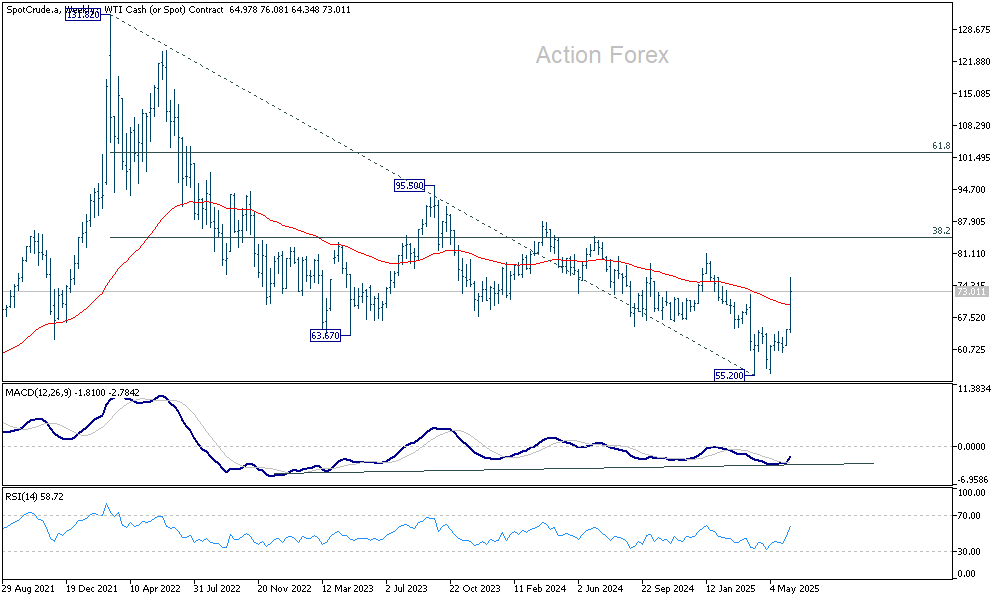
The geopolitical risk premium surged in tandem with crude oil prices, which on Friday posted their largest intraday gains since Russia’s invasion of Ukraine in 2022. Traders began pricing in the risks of serious supply disruptions. Markets are growing increasingly concerned that the conflict could evolve into a broader regional war, possibly threatening key energy infrastructure and shipping routes. The nuclear talks previously scheduled between the US and Iran in Oman now seem moot, with diplomacy giving way to open confrontation.
Oil markets are particularly sensitive to any disruption in Iranian supply. Iran currently produces around 3.3 million barrels per day and exports over 2 million bpd of crude and refined products. Any damage to this output would not only tighten global supply but also stretch the remaining spare capacity from other producers, capacity that might be insufficient to cushion further geopolitical or natural shocks.
A worst-case scenario would involve Iran targeting the Strait of Hormuz, neighboring oil-producing states, or even US military installations. The implications of such actions would be severe. While the US has publicly stated it is not involved in the current Israeli operation, any direct attack on American assets could force a shift in US posture.
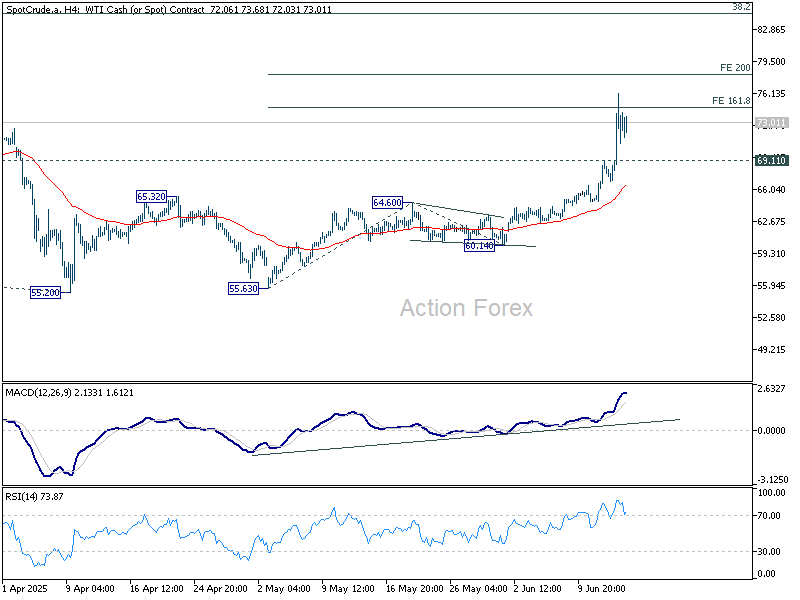
Technically, for the near term, 74.65/78.08 resistance zone (161.8% projection of 55.63 to 64.60 from 60.14. at 74.65 and 200% projection at 78.08) is still likely to limit WTI oil price, with help from overbought condition in 4H MACD.
However, decisive break of 78.08 will add to the case that 55.20 was already a long term bottom. Rebound from there would target 38.2% retracement of 131.81 (2022 high) to 55.20 (2025 low) at 84.46, even still as a corrective move.
Oil Shock Threatens Fed Cut Bets as Inflation Risks Return and Tariff Clock Ticks
The surge in oil prices somewhat revived fears of energy-driven inflation—just as investors were gaining confidence that the Fed could begin cutting rates later this year.
Last week's downside surprises in both US CPI and PPI reports had strengthened that belief, suggesting that new tariffs imposed earlier this year had yet to filter into upstream or downstream prices. Fed fund futures quickly priced in a more than 70% probability of a September rate cut.
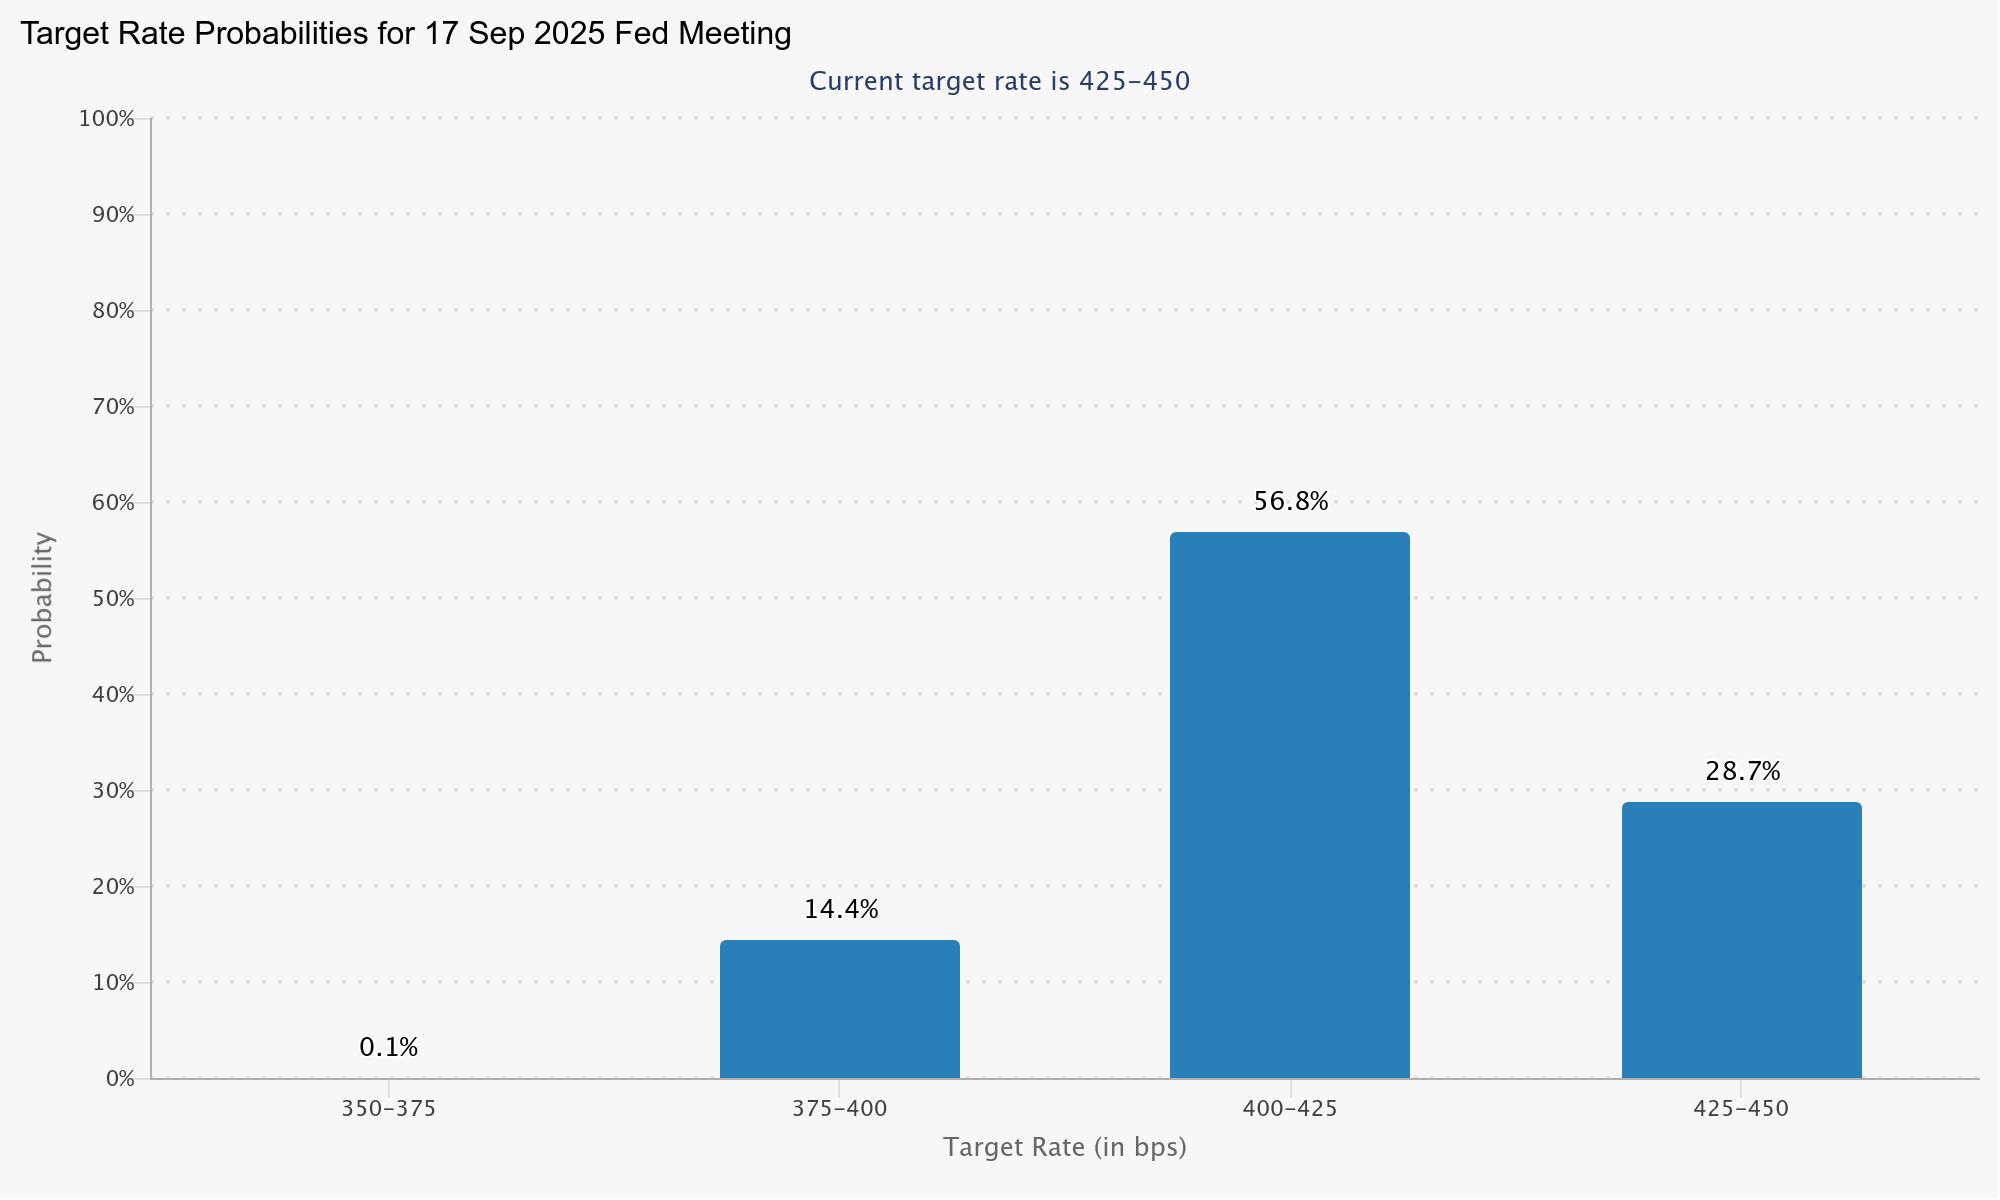
However, the oil shock complicates this narrative, If headline inflation picks up again on energy. In this context, monetary policy may be forced to stay tighter for longer than markets currently anticipate.
Adding to the uncertainty is the looming expiration of the 90-day reciprocal tariff truce in early July. While Treasury Secretary Scott Bessent floated the idea of extending negotiations for “good faith” trading partners, President Donald Trump took a more aggressive stance. He dismissed the need for any delay and signaled that countries would soon receive formal notice of new tariff arrangements—implying a return to unilateral trade policy. The conflicting signals within the administration only amplify the sense of unpredictability for businesses and markets alike.
The intersection of a hawkish tariff stance and resurgent oil prices represents a twin risk scenario that could destabilize expectations across bonds, equities, and currencies. With Fed facing conflicting signals—cooling core inflation versus rising headline risks—the central bank’s room to maneuver may shrink in the months ahead. Investors hoping for a smooth transition to rate cuts may find the coming period more volatile than hoped.
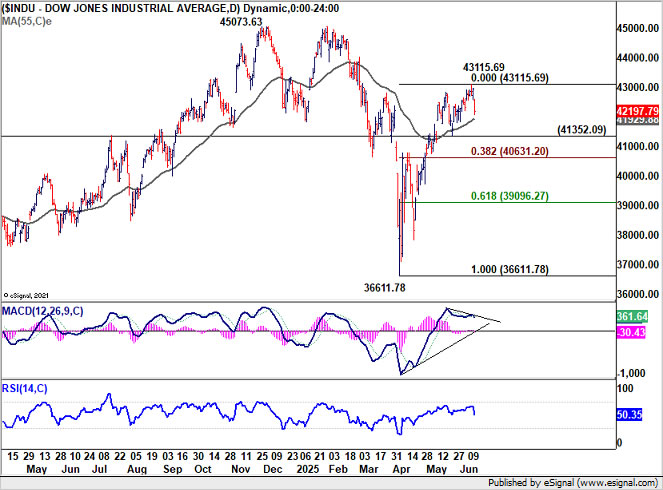
Technically, warning signs are already flashing in equity markets. A bearish divergence is starting to emerge in the D MACD of DOW. Friday’s steep -769 point decline strongly suggests that a short-term top may have formed at 43115.69.
Firm break of 41352.09 will bring deeper fall to 38.2% retracement of 36611.78 to 43115.69 at 40631.20 at least, even still as a corrective move.
Looking ahead, if 40631.20 fails to hold, it would raise the likelihood that the broader medium-term corrective pattern from 45073.63 (2024 high) is still unfolding. In such a case, the index could be at risk of revisiting the bottom of that range near 36611.78.
Dollar Finds a Lifeline in Geopolitical Risk, But Downtrend Still in Play
Dollar Index saw a volatile week, initially plunging as softer-than-expected US CPI and PPI data solidified market expectations for a Fed rate cut in September. While the inflation-driven downside pressure dominated early in the week, risk aversion linked to escalating geopolitical tensions between Israel and Iran helped the greenback stage a late recovery. Even so, Dollar still ended as the second worst-performing major, only narrowly outperforming Aussie.
For months, Dollar struggled to find consistent support. Tariff developments, rising inflation, and even climbing Treasury yields failed to lift the greenback, as each came with offsetting factors. In particular, bond selloffs triggered concerns about global diversification away from US assets. Recession-driven risk aversion didn’t help either. But the current geopolitical flare-up in the Middle East, particularly the potential for a drawn-out Israel-Iran conflict, may finally offer Dollar a clearer haven bid—at least in the short term.
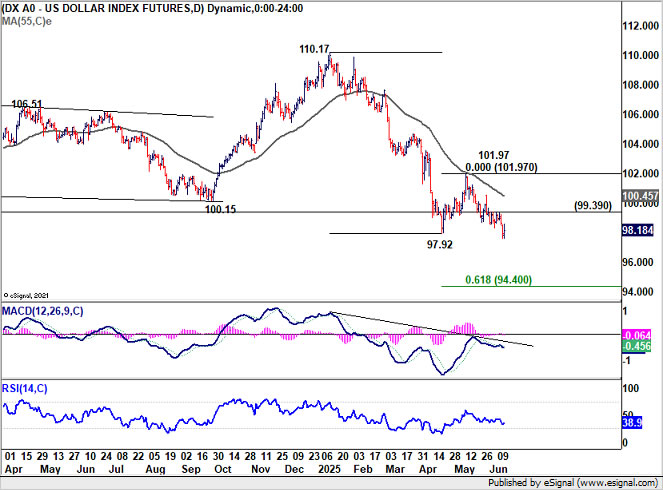
Technically, however, Dollar Index remains under pressure. As long 99.39 resistance holds, further decline is favored. That said, downside momentum might start to slow as it approaches 61.8% projection of 110.17 to 97.92 from 101.97 at 94.40. On the upside, break of 99.39 resistance will suggest short term bottoming, and bring stronger rebound back to 55 D EMA (now at 100.45), and possibly further to 101.97 resistance.
EUR/AUD Weekly Outlook
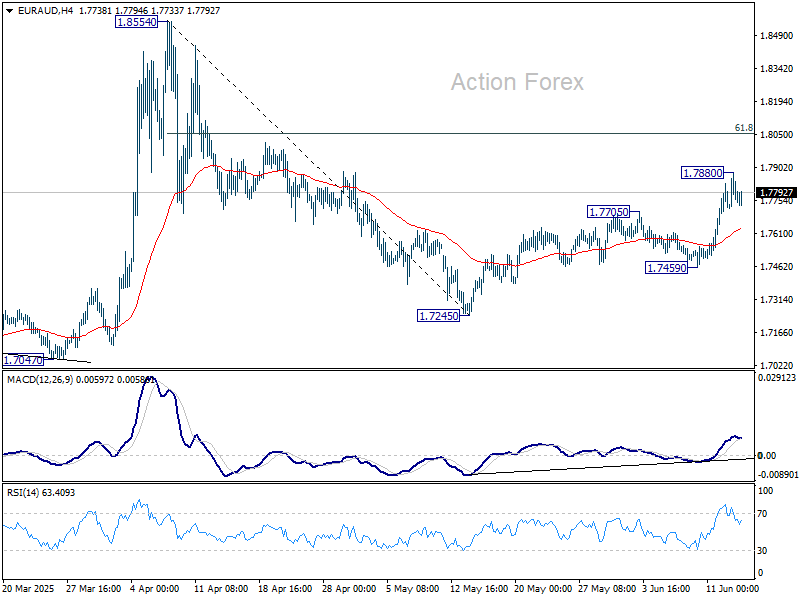
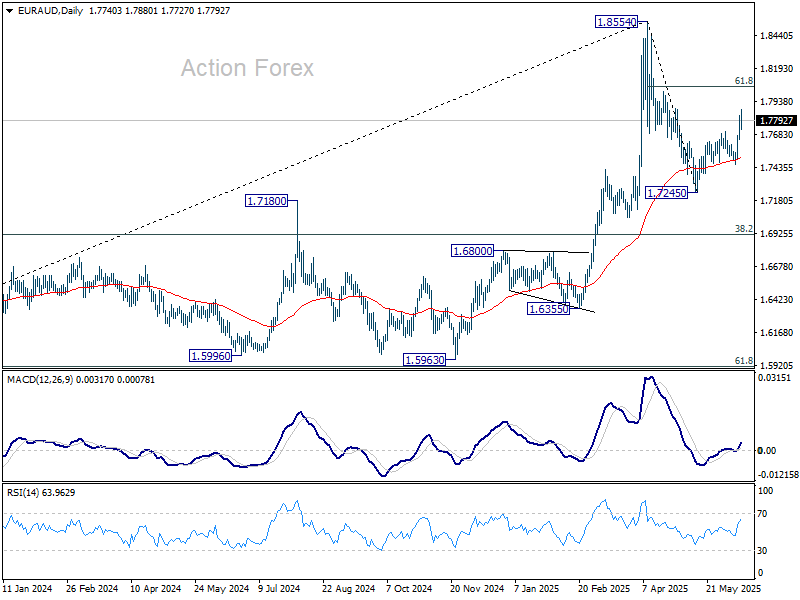
EUR/AUD's rebound from 1.7245 resumed last week but lost some momentum after hitting 1.7880. Initial bias is turned neutral this week first. Overall development suggests that fall from 1.8554 has completed as a corrective move. Further rise is expected as long as 1.7459 support holds. Above 1.7880 will target 61.8% retracement of 1.8554 to 1.7245 at 1.8054. Firm break there will pave the way to 1.8554.
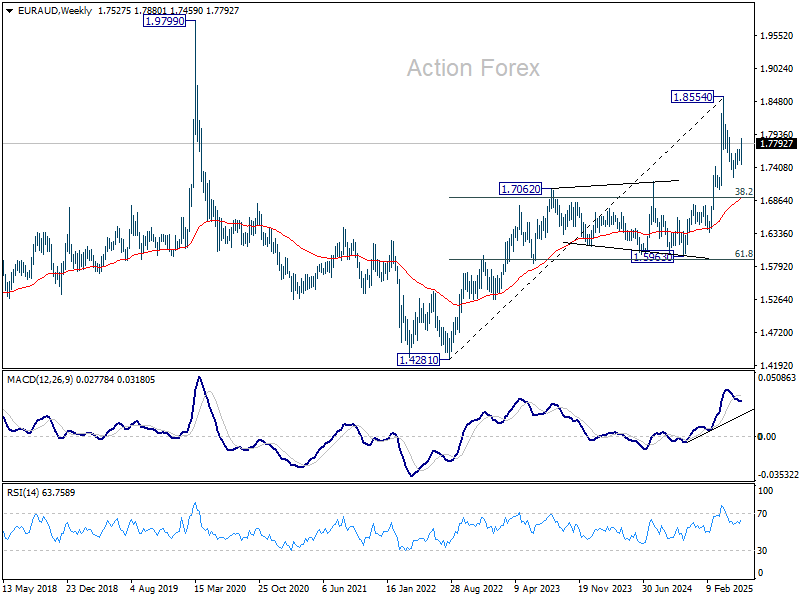
In the bigger picture, with 55 W MACD staying well below signal line, 1.8554 is likely a medium term top already. Price actions from there are seen as a corrective pattern only. While deeper pullback might be seen, downside should be contained by 38.2% retracement of 1.4281 (2022 low) to 1.8554 at 1.6922 to bring rebound. Up trend from 1.4281 is still expected to resume at a later stage.
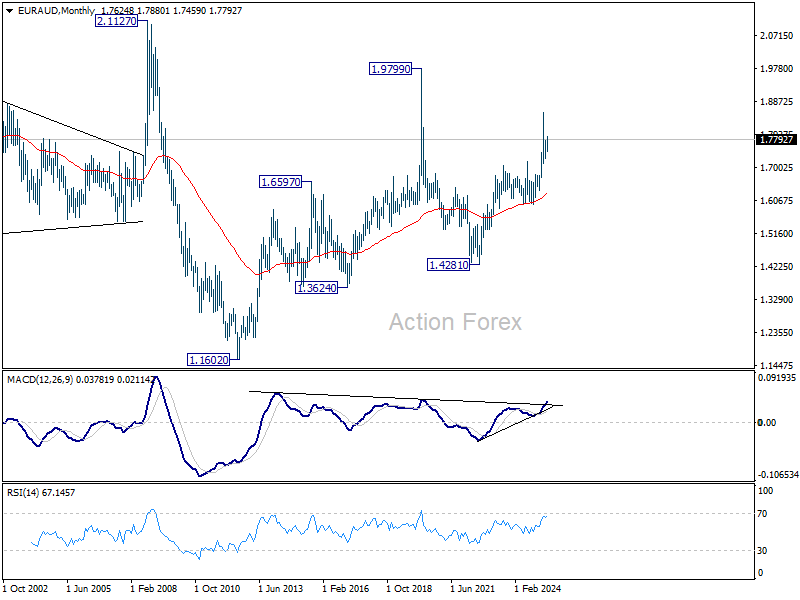
In the longer term picture, rise from 1.4281 is seen as the second leg of the pattern from 1.9799 (2020 high), which is part of the pattern from 2.1127 (2008 high). As long as 55 M EMA (now at 1.6303) holds, this second leg could still extend higher.
EUR/USD Weekly Outlook
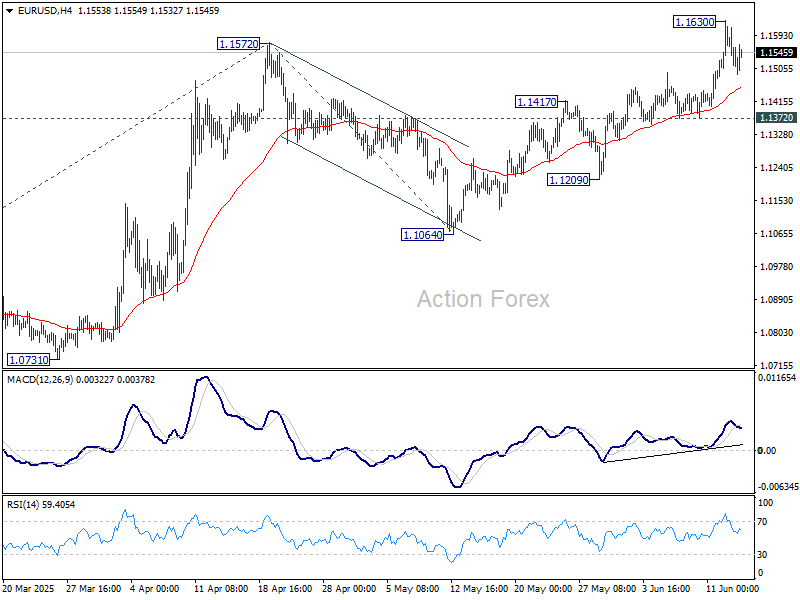
EUR/USD rose to 1.1630 last week but retreated since then. Initial bias stays neutral this week for consolidations. The break of 1.1572 suggest that rally from 1.0176 is resuming. Above 1.1630 will target 61.8% projection of 1.0176 to 1.1572 from 1.1064 at 1.1927. However, break of 1.1372 support will indicate short term topping, and turn bias to the downside for deeper pullback.
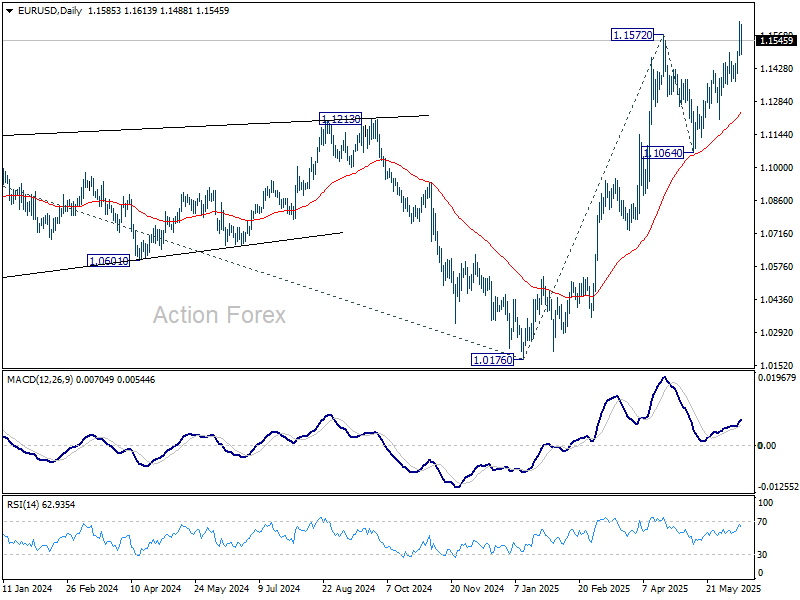
In the bigger picture, rise from 0.9534 long term bottom could be correcting the multi-decade downtrend or the start of a long term up trend. In either case, further rise should be seen to 100% projection of 0.9534 to 1.1274 from 1.0176 at 1.1916. This will now remain the favored case as long as 1.1604 support holds.
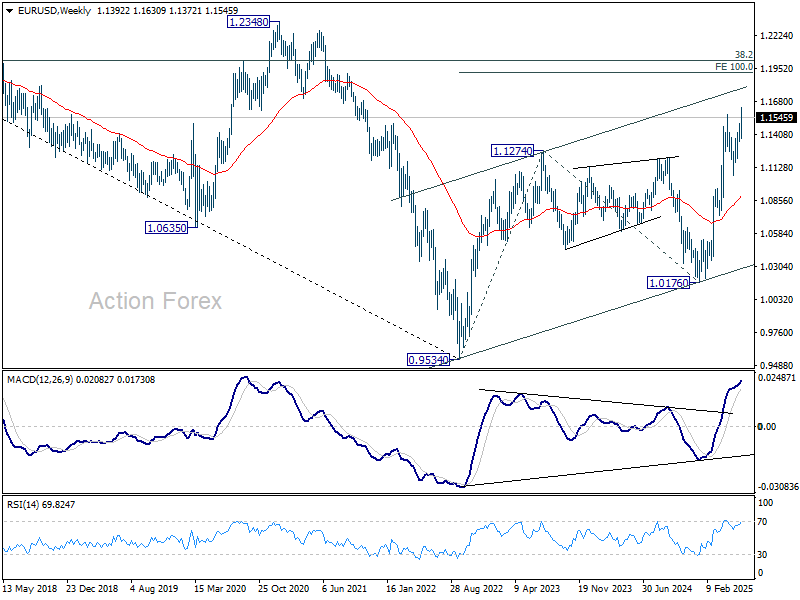
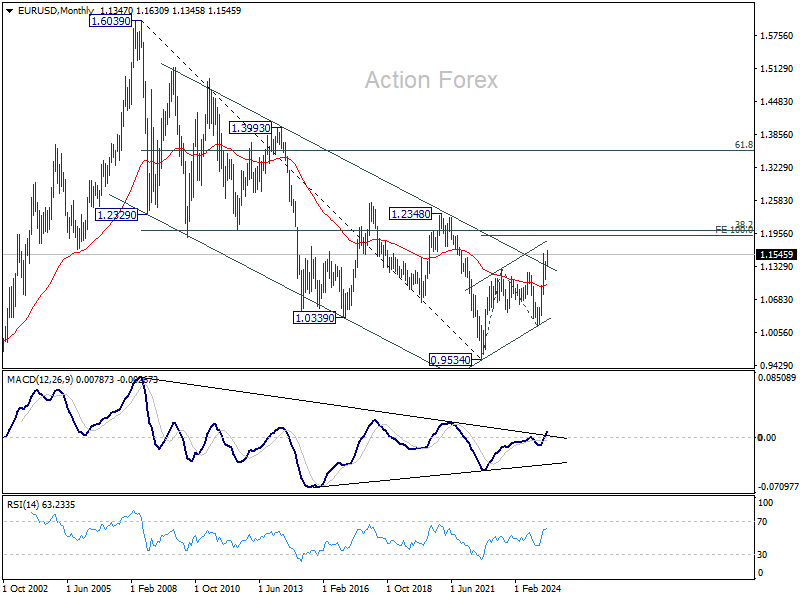
In the long term picture, a long term bottom should be in place already at 0.9534, on bullish convergence condition in M MACD. Rise from there could be a corrective bounce or the start of an up trend. In either case, next target is 38.2% retracement of 1.6039 to 0.9534 at 1.2019.
USD/JPY Weekly Outlook
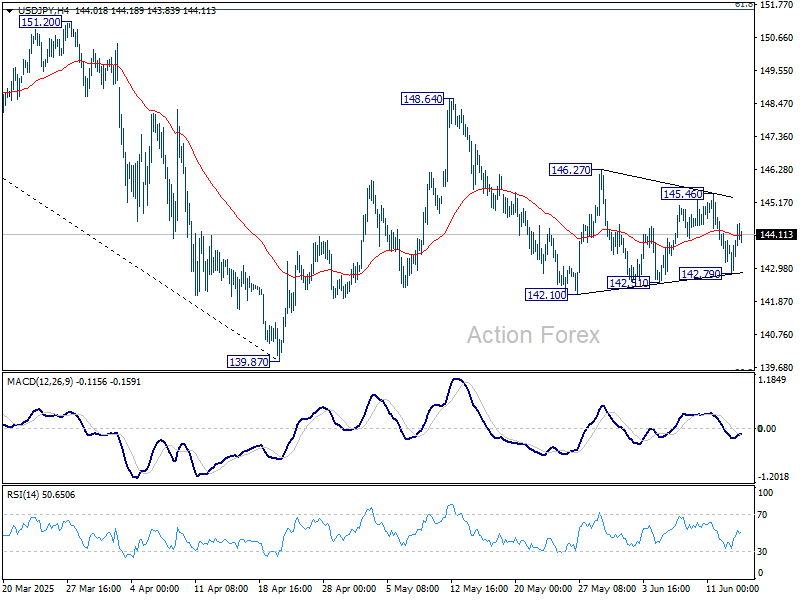
USD/JPY stayed in sideway trading last week and outlook is unchanged. Initial bias remains neutral this week first. On the downside, break of 142.10 support will resume the fall from 148.64 to retest 139.87 low. On the upside, above 145.46 will turn bias to the upside for 146.27 first. Firm break there will target 148.64 resistance.
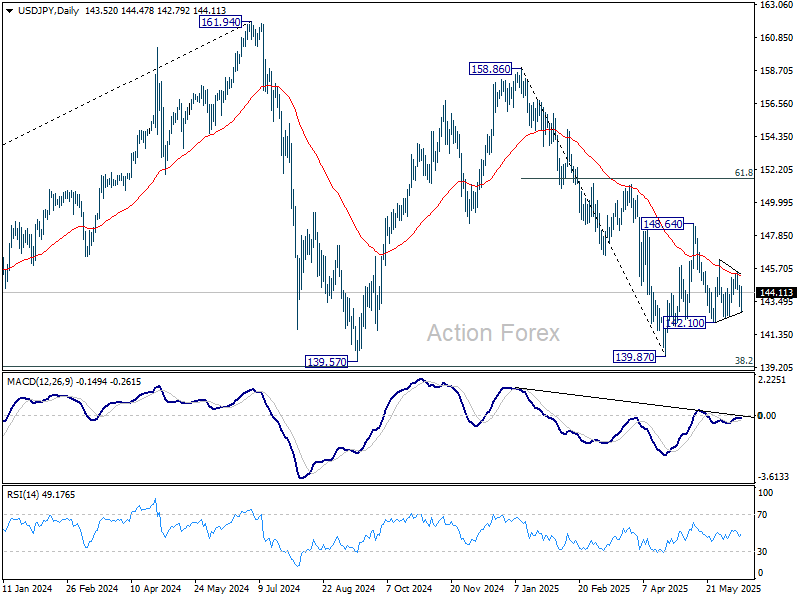
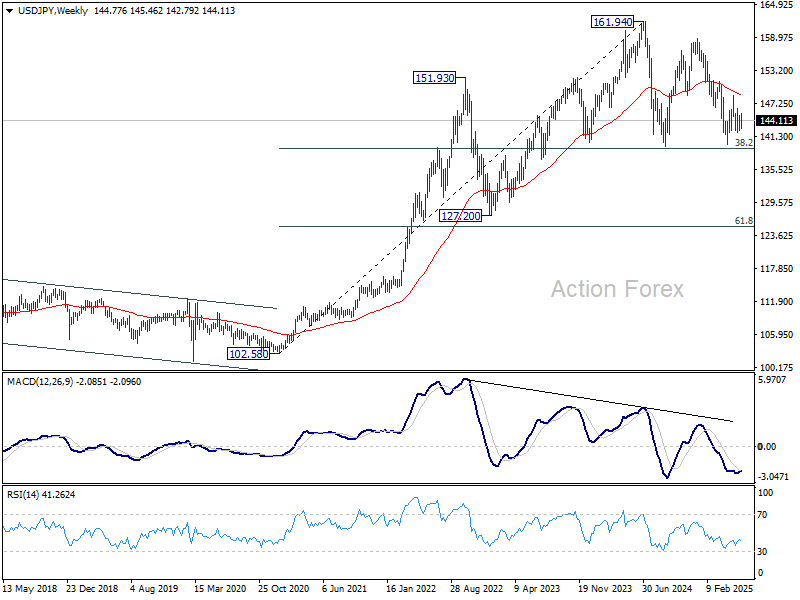
In the bigger picture, price actions from 161.94 are seen as a corrective pattern to rise from 102.58 (2021 low), with fall from 158.86 as the third leg. Strong support should be seen from 38.2% retracement of 102.58 to 161.94 at 139.26 to bring rebound. However, sustained break of 139.26 would open up deeper medium term decline to 61.8% retracement at 125.25.
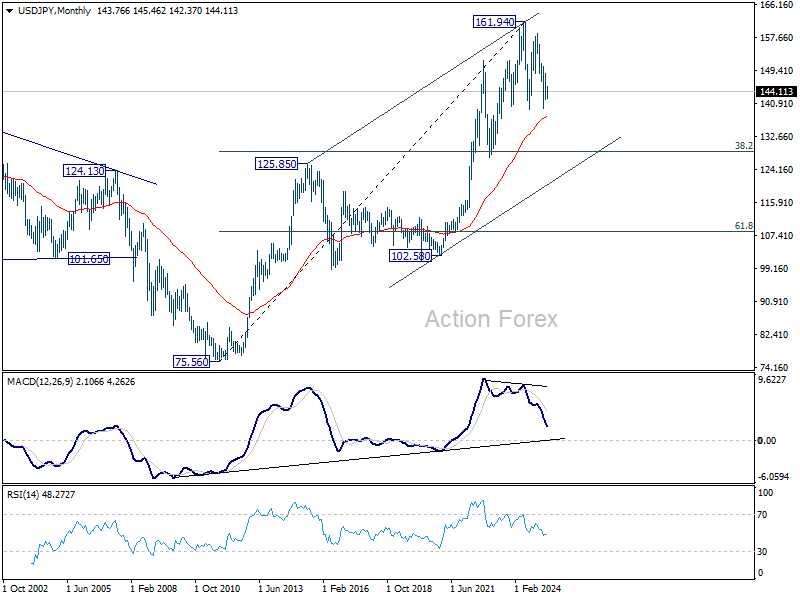
In the long term picture, it's still early to conclude that up trend from 75.56 (2011 low) has completed. A medium term corrective phase should have commenced, with risk of deep correction towards 55 M EMA (now at 137.65) and even below.
GBP/USD Weekly Outlook
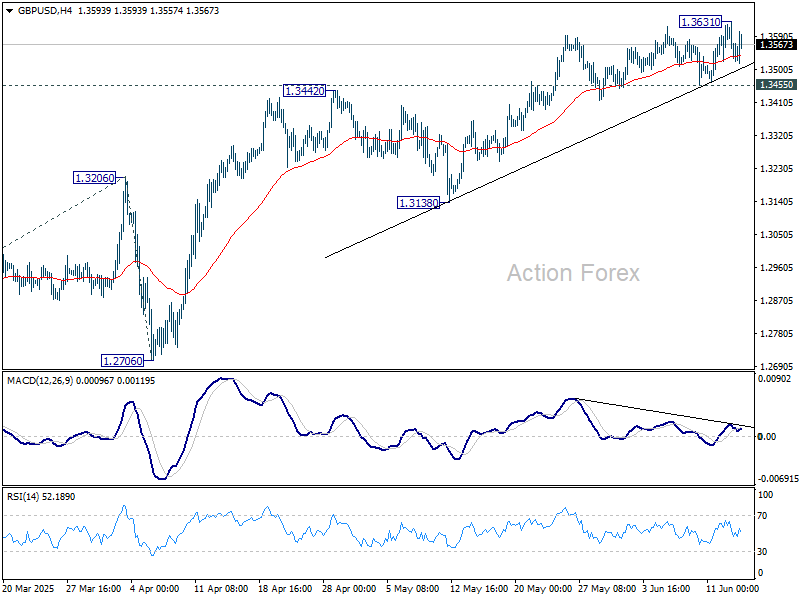
GBP/USD edged higher to 1.3631 last week but quickly retreated again. Initial bias remains neutral this week first, and further rally is expected as long as 1.3455 support holds. Break of 1.3631 will resume the rally from 1.2099 and target 100% projection of 1.2099 to 1.3206 from 1.3138 at 1.3813. On the downside, break of 1.3455 support should confirm short term topping, and bring deeper correction to 55 D EMA (now at 1.3310) instead.
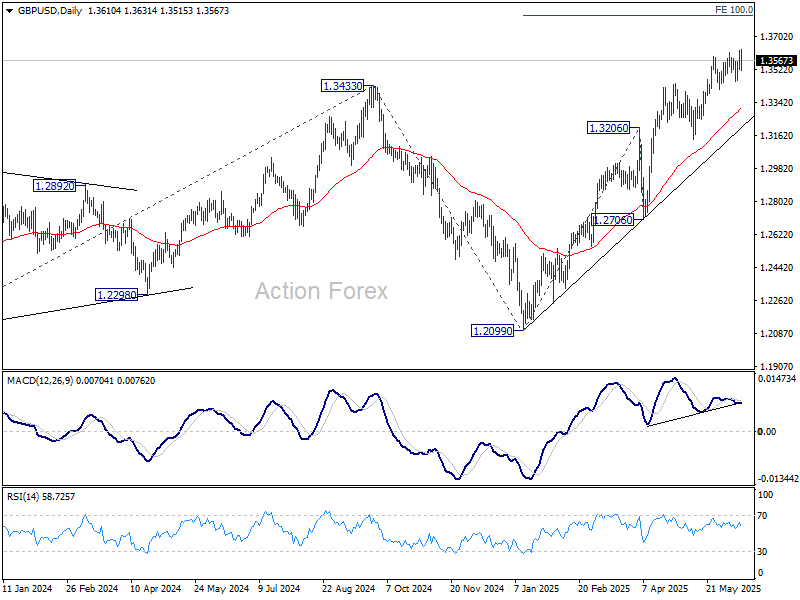
In the bigger picture, up trend from 1.3051 (2022 low) is in progress. Next medium term target is 61.8% projection of 1.0351 to 1.3433 from 1.2099 at 1.4004. Outlook will now stay bullish as long as 55 W EMA (now at 1.2913) holds, even in case of deep pullback.
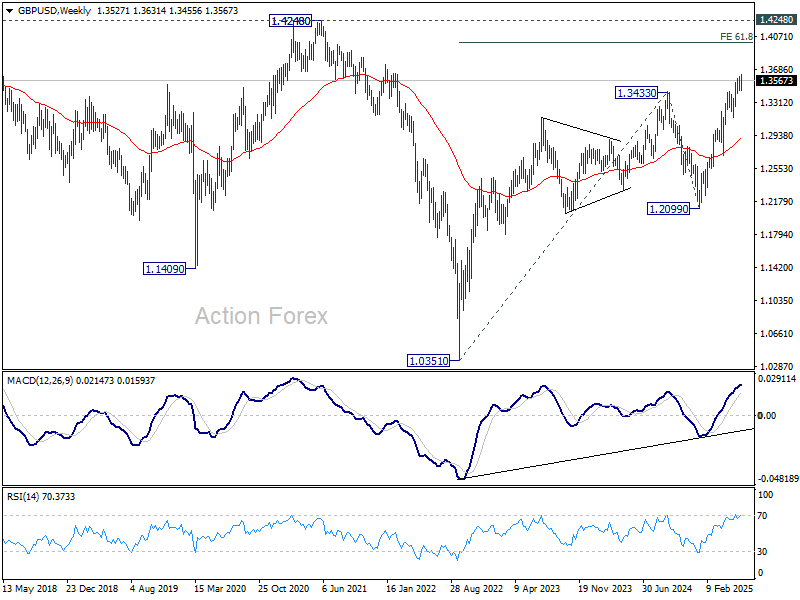
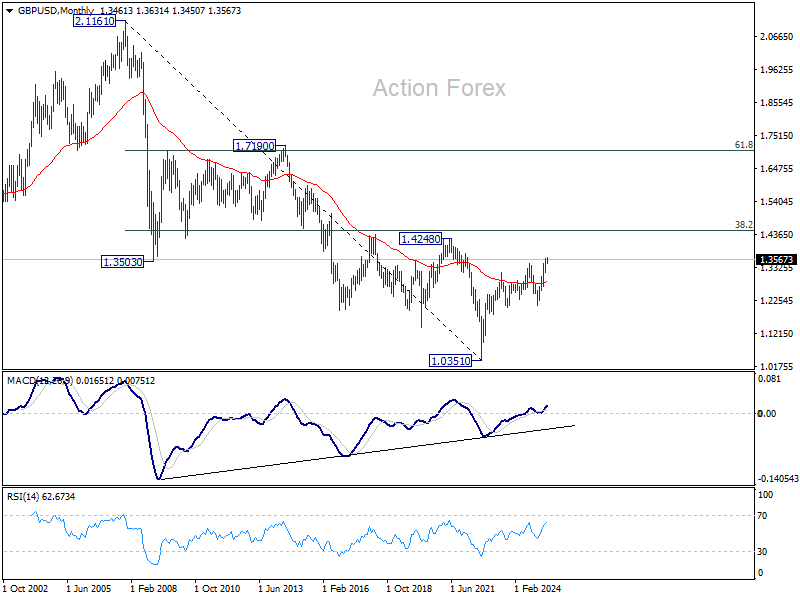
In the long term picture, for now, price actions from 1.0351 (2022 low) are still seen as a corrective pattern to the long term down trend from 2.1161 (2007 high) only. However, firm break of 1.4248 resistance (38.2% retracement of 2.1161 to 1.0351 at 1.4480) will be a strong sign of long term bullish reversal.
USD/CHF Weekly Outlook
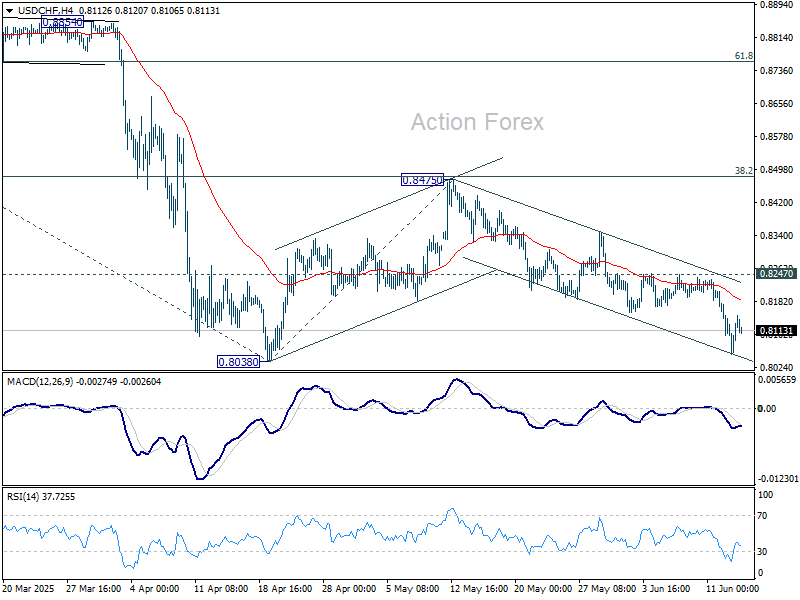
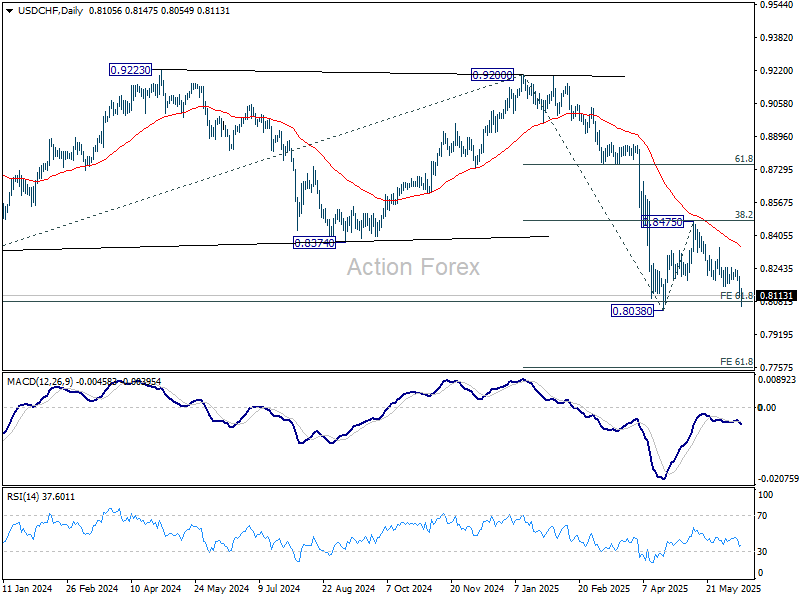
USD/CHF's fall from 0.8475 extended lower last week but recovered ahead of 0.8038 low. Initial bias is turned neutral this week first. On the upside, break of 0.8247 resistance will argue that corrective pattern from 0.8038 is starting the third leg. Bias will be turned back to the upside for 0.8475 resistance again. However, firm break of 0.8038 will resume larger down trend. Next target will be 61.8% projection of 0.9200 to 0.8038 from 0.8475 at 0.7757.
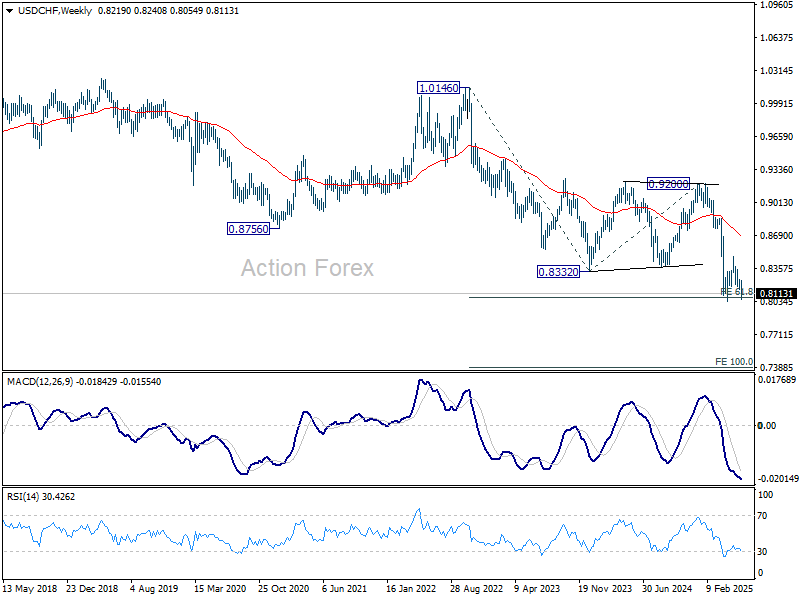
In the bigger picture, long term down trend from 1.0342 (2017 high) is still in progress and met 61.8% projection of 1.0146 (2022 high) to 0.8332 from 0.9200 at 0.8079 already. In any case, outlook will stay bearish as long as 55 W EMA (now at 0.8675) holds. Sustained break of 0.8079 will target 100% projection at 0.7382.
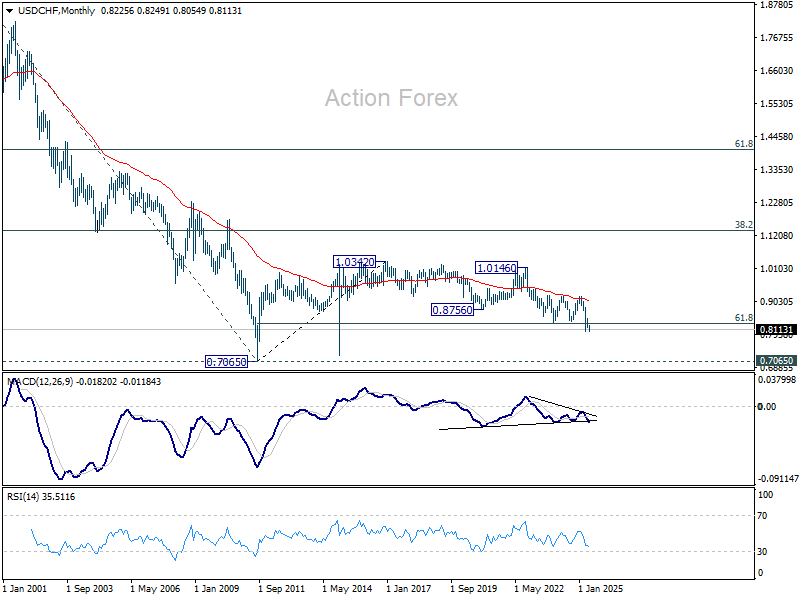
In the long term picture, price action from 0.7065 (2011 low ) are seen as a corrective pattern to the multi-decade down trend from 1.8305 (2000 high). It's uncertain if the fall from 1.0342 is the second leg of the pattern, or resumption of the down trend. But in either case, sustained trading below 61.8% retracement of 0.7065 to 1.0342 at 0.8317 will pave the way back to 0.7065.
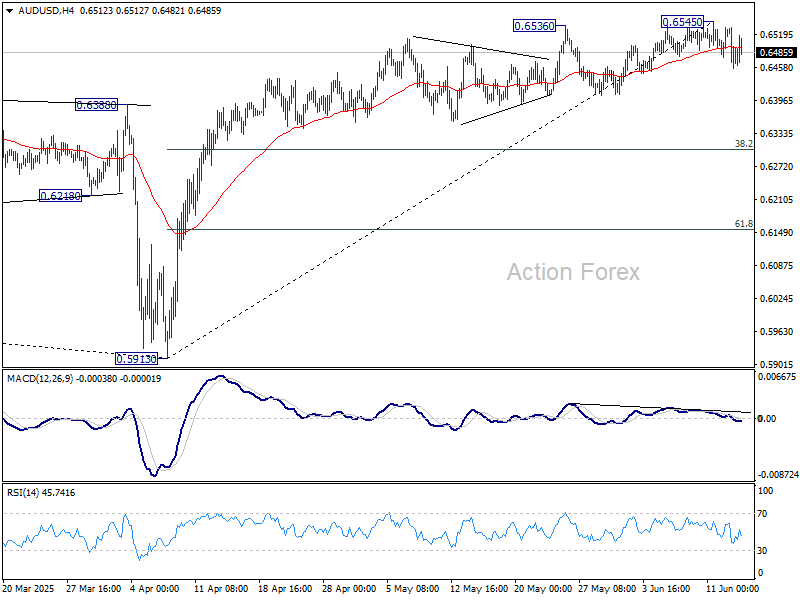
AUD/USD Weekly Report
Despite edging higher to 0.6545 last week, subsequent pullback suggests that a short term top was already form. Risk will now stay on the downside as long as 1.6545 resistance holds. Deeper fall would be seen to 55 D EMA (now at 0.6416). Firm break there will target 38.2% retracement of 0.5913 to 0.6545 at 0.6304.
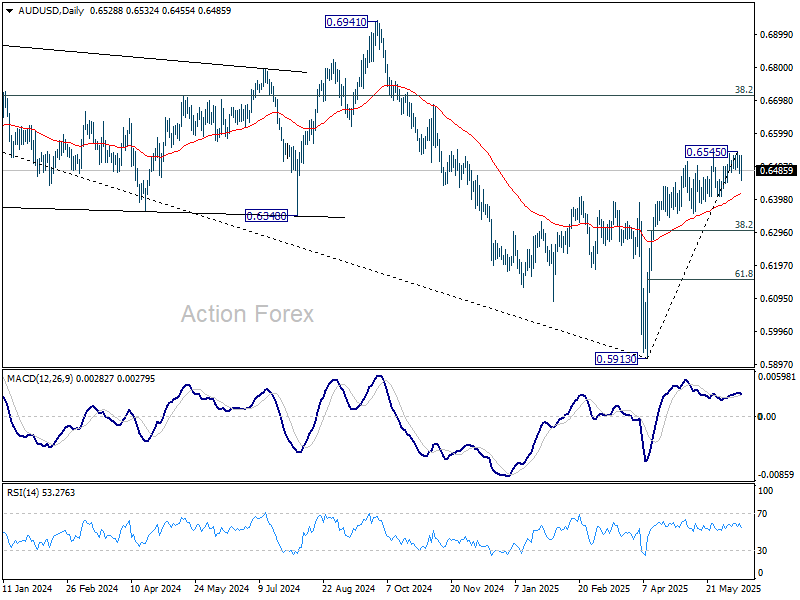
In the bigger picture, AUD/USD is still struggling to sustain above 55 W EMA (now at 0.6443) cleanly, and outlook is mixed. Sustained trading above 55 W EMA will indicate that rise from 0.5913 is at least correcting the down trend from 0.8006 (2021 high), with risk of trend reversal. Further rise should be seen to 38.2% retracement of 0.8006 to 0.5913 at 0.6713. However, rejection by 55 W EMA will revive medium term bearishness for another fall through 0.5913 at a later stage.
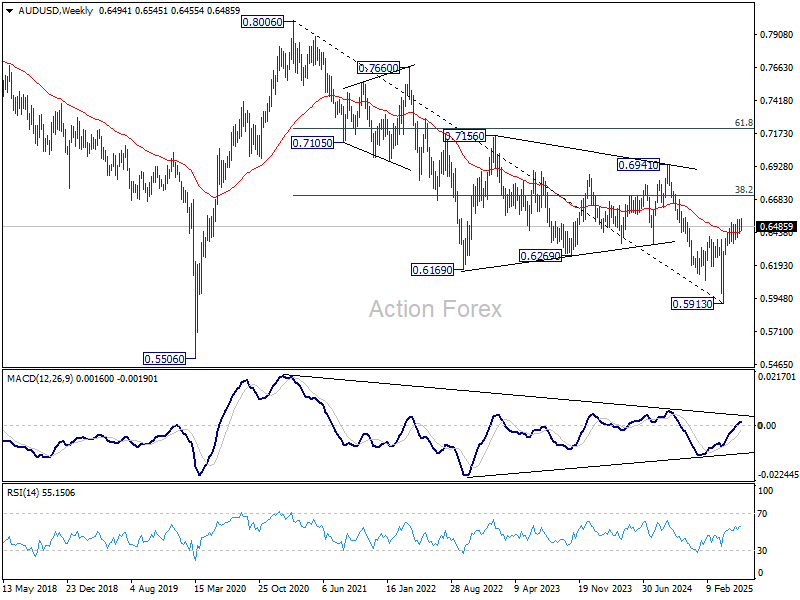
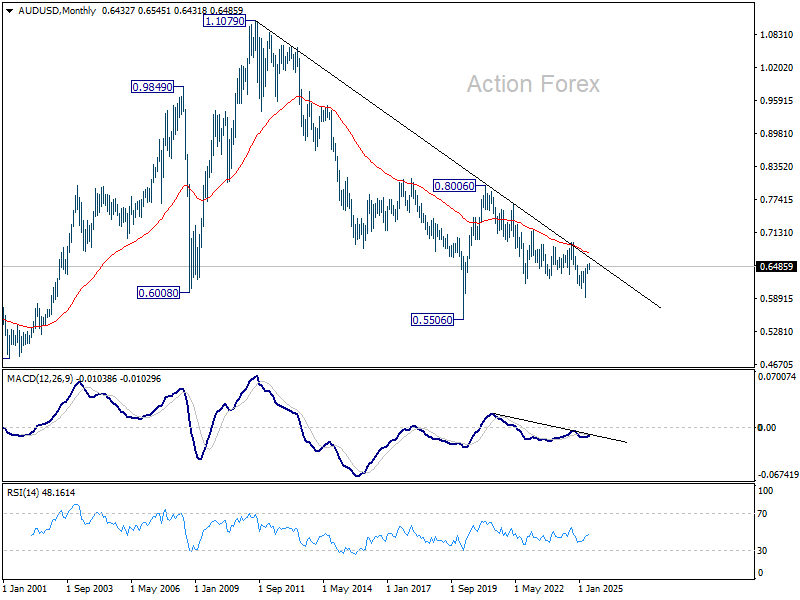
In the long term picture, fall from 0.8006 is seen as the second leg of the corrective pattern from 0.5506 long term bottom (2020 low). Hence, in case of deeper decline, strong support should emerge above 0.5506 to contain downside to bring reversal. On the upside, firm break of 0.6941 will argue that the third leg has already started back to 0.8006.
USD/CAD Weekly Outlook
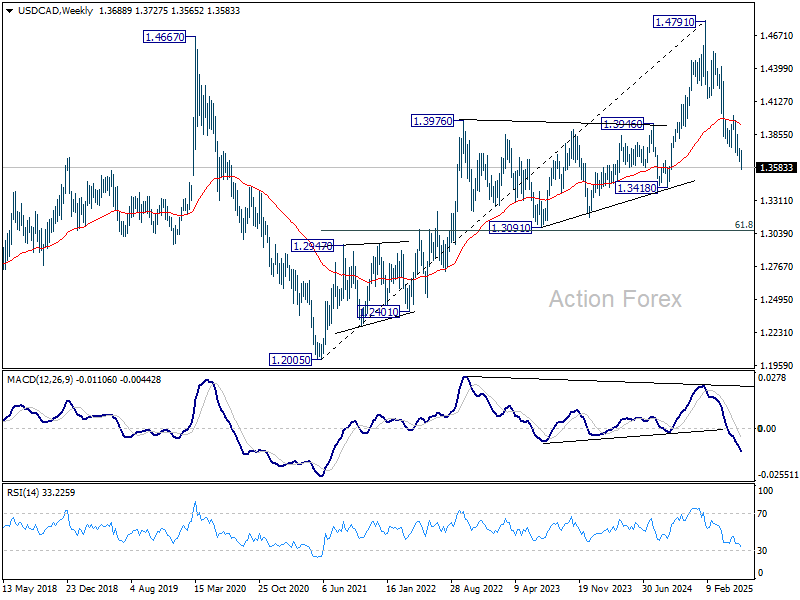
USD/CAD's fall from 1.4791 continued last week and broke 61.8% projection of 1.4414 to 1.3749 from 1.4014 at 1.3603. There is no sign of bottoming yet, and initial bias stays on the downside this week for 100% projection at 1.3349. On the upside, through, break of 1.3650 minor resistance will turn intraday bias neutral first.
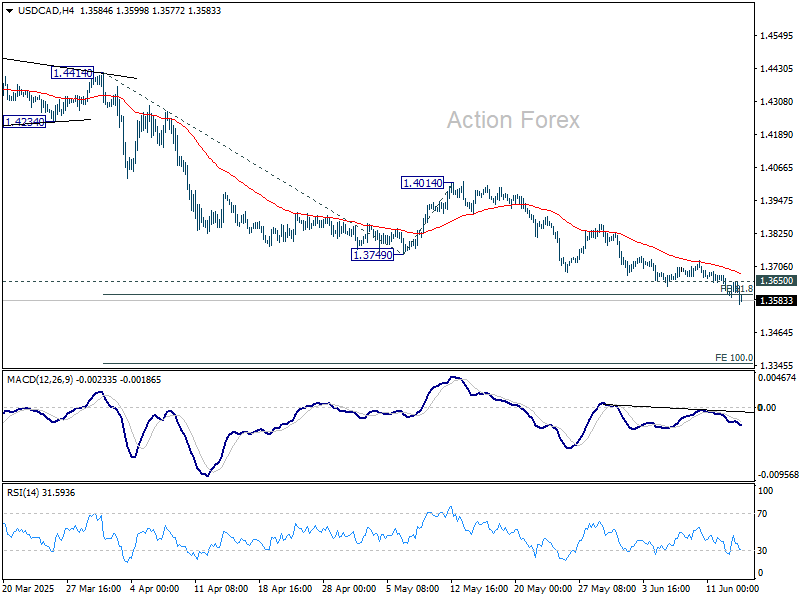
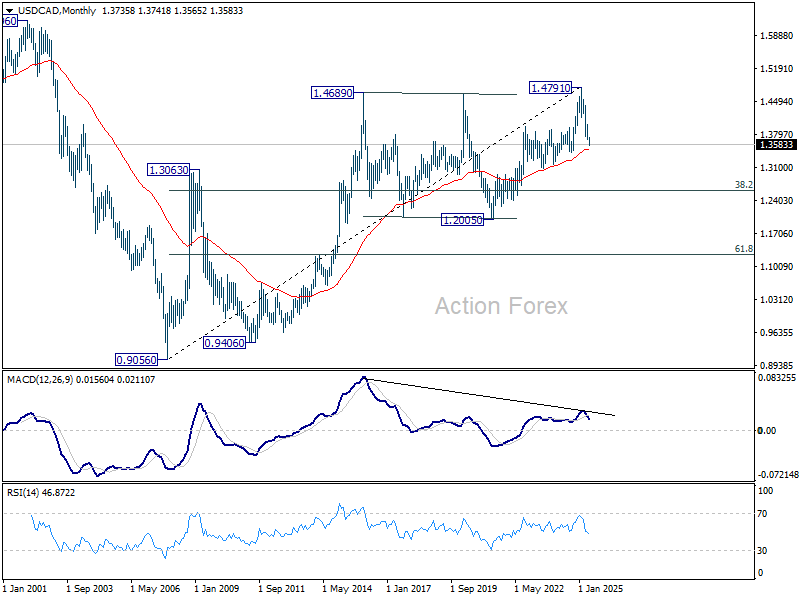
In the bigger picture, price actions from 1.4791 medium term top could either be a correction to rise from 1.2005 (2021 low), or trend reversal. In either case, further decline is expected as long as 1.4014 resistance holds. Next target is 61.8% retracement of 1.2005 (2021 low) to 1.4791 at 1.3069.
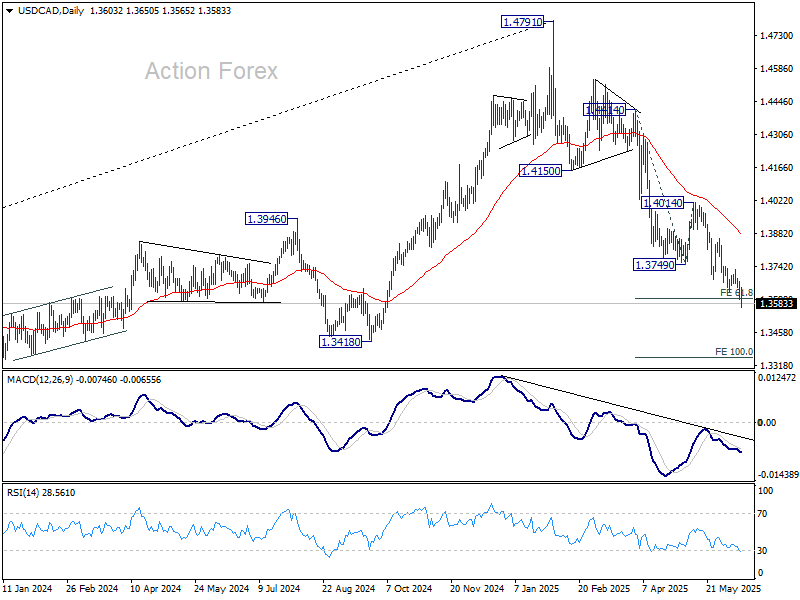
In the long term picture, as long as 55 M EMA (now at 1.3489) holds, up trend from 0.9056 (2007 low) should still resume through 1.4791 at a later stage. However, sustained trading below 55 M EMA will argue that the up trend has already completed, with rise from 1.2005 to 1.4791 as the fifth wave. 1.4791 would then be seen as a long term top and deeper medium term down trend should then follow.