Sample Category Title
Geopolitical Escalation Fuels Risk Aversion; Dollar Still Lags Despite Bounce
Risk aversion dominates global markets today as geopolitical tensions in the Middle East intensify, though the broader equity selloff has remained contained so far. The trigger came early Friday when Israel launched a series of airstrikes deep into Iranian territory, targeting key military and nuclear infrastructure. In response, Iran retaliated with a wave of drone attacks aimed at Israel—estimated at around 100 drones. The development marked a sharp escalation in hostilities that took markets by surprise. While the US has so far distanced itself from the conflict, analysts have warned that any Iranian attack on American bases could pull Washington into the war, an outcome that would significantly raise the stakes for global markets.
In currency markets, risk-sensitive assets are bearing the brunt of the shift in sentiment. Aussie and Kiwi have fallen to the bottom of the weekly performance board, weighed down by geopolitical fear and, in the Kiwi's case, a sharp deterioration in domestic manufacturing activity too. Dollar has managed to rebound modestly today, but remains the third worst-performing major for the week. Earlier inflation data, both CPI and PPI, came in softer than expected, reinforcing expectations for a Fed rate cut in September and limiting the Dollar’s momentum.
Swiss Franc stands out as the strongest performer for the week, benefiting from traditional safe-haven demand amid heightened geopolitical uncertainty. Euro has also held firm, underpinned by a steady flow of ECB commentary indicating that the easing cycle is nearing its end. Loonie ranks third, supported by surging oil prices. Yen and Sterling are trading in the middle of the pack. The Yen, despite an early jump, has given back gains as safe-haven flows rotate toward the Franc.
In Europe, at the time of writing, FTSE is down -0.02%. DAX is down -1.08%. CAC is down -0.78%. UK 10-year yield is up 0.042 at 4.524. Germany 10-year yield is up 0.016 at 2.500. Earlier in Asia, Nikkei fell -0.89%. Hong Kong HSI fell -0.59%. China Shanghai SSE fell -0.75%. Singapore Strait Times fell -0.27%. Japan 10-year JGB yield fell -0.058 to 1.402.
Eurozone industrial production down -2.4% mom in April, broad-based weakness
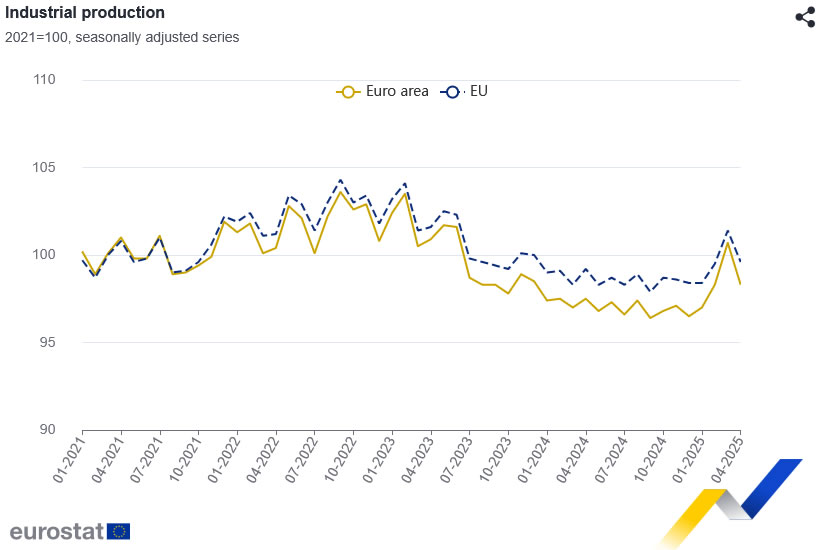
Eurozone industrial production dropped sharply by -2.4% mom in April, significantly below expectations of a -1.6% decline. Output fell in all major categories, with non-durable consumer goods posting the steepest drop at -3.0%. Capital goods, energy (-1.1%), and intermediate goods (-0.7%) also contracted. Durable consumer goods saw a modest -0.2% fall, offering little relief in an otherwise dismal report.
At the EU level, industrial output slipped -1.8% mom, driven by steep declines in Ireland (-15.2%), Malta (-6.2%), and Lithuania (-3.0%). While a few economies such as Denmark (+3.5%) and Luxembourg (+3.2%) managed modest gains, the regional picture remains weak.
EU exports drop -1.9% yoy in April as shipments to China plunge -15.9% yoy
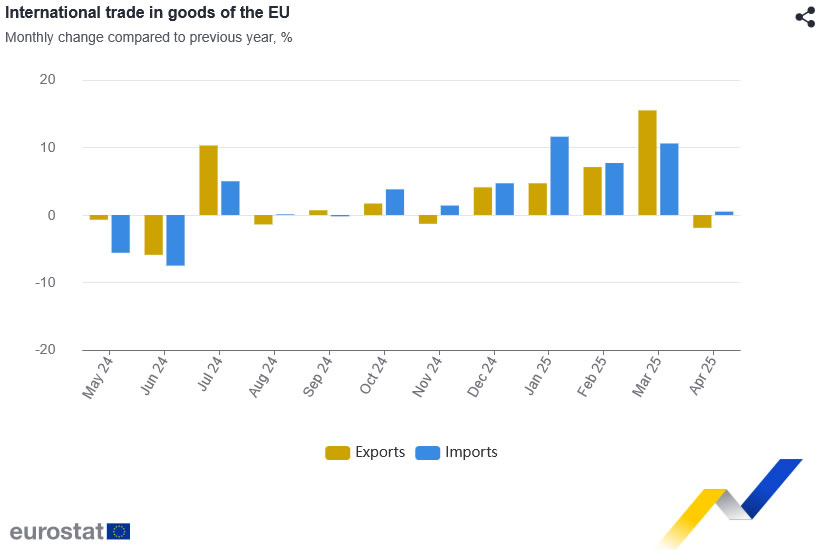
Eurozone trade data for April showed signs of weakening external demand, with goods exports falling -1.4% yoy to EUR 243.0B, while imports edged up 0.1% yoy to EUR 233.1B. Despite the drop in exports, the region maintained a trade surplus of EUR 9.9B, helped by subdued import growth. Intra-Eurozone trade also declined, down -2.0% yoy to EUR 217.3B.
Across the broader European Union, the trade picture reflected similar pressures. EU exports dropped -1.9% yoy to EUR 218.2B, while imports increased 0.5% yoy to EUR 210.7B, yielding a surplus of EUR 7.4B. Intra-EU trade fell -1.7% yoy to EUR 341.9B.
While exports to the US remained a bright spot, rising 3.8% yoy, exports to China plunged -15.9% yoy. On the import side, EU purchases from China rose 8.4% yoy. Imports from the U.S. rose modestly by 2.4% yoy.
NZ BNZ manufacturing fall to 47.5, slumps back into contraction
New Zealand’s manufacturing sector slipped sharply back into contraction in May, with the BusinessNZ Performance of Manufacturing Index plunging from 53.3 to 47.5. The reading not only marks a decisive reversal from April's expansion but also sits well below the historical average of 52.5.
Key components of the index showed broad-based weakness: production dropped from 53.0 to 48.7, employment tumbled from 54.6 to 45.7, and new orders fell sharply from 50.8 to 45.3—all signaling deteriorating activity across the sector.
The sharp decline was echoed in business sentiment, with 64.5% of survey respondents offering negative comments—up from 58% in April. The commentary reflects a growing sense of pessimism as manufacturers grapple with falling demand, weak forward orders, and subdued consumer spending. Rising input costs, ongoing economic uncertainty, and stalled investment plans are compounding pressures.
BNZ’s Senior Economist Doug Steel said that “the New Zealand economy can claw its way forward over the course of 2025, but the PMI is yet another indicator that suggests an increased risk that the bounce in GDP reported for Q4, 2024 and Q1, 2025 could come to a grinding halt”.
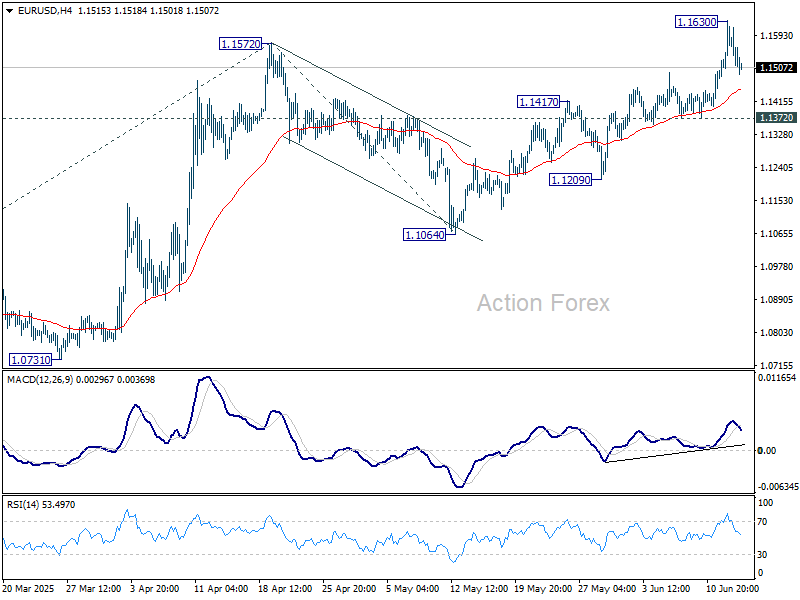
EUR/USD Mid-Day Outlook
Daily Pivots: (S1) 1.1503; (P) 1.1567; (R1) 1.1649; More...
Intraday bias in EUR/USD remains neutral and more consolidations could be seen below 1.1630 temporary top. . Further rally is expected as long as 1.1372 support holds. Above 1.1630 will resume the rally from 1.0176 to 61.8% projection of 1.0176 to 1.1572 from 1.1064 at 1.1927. However, break of 1.1372 support will indicate short term topping, and turn bias to the downside for deeper pullback.
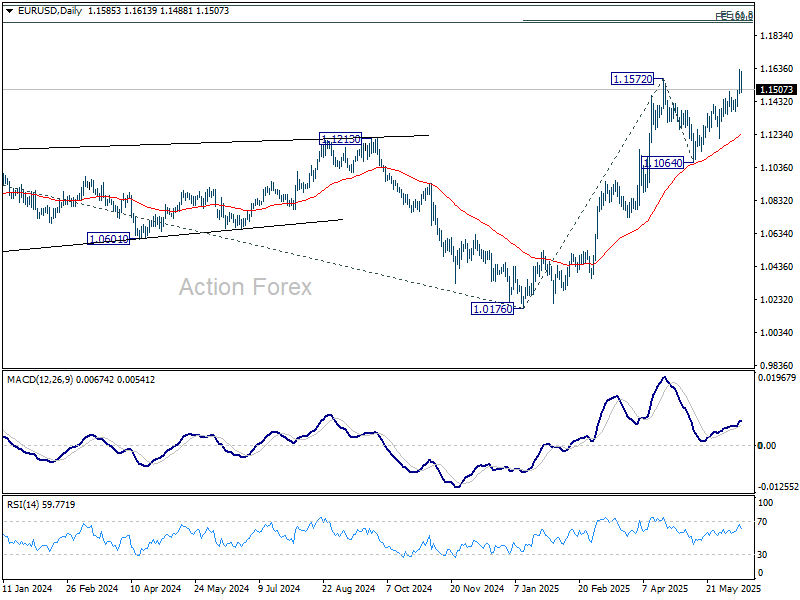
In the bigger picture, rise from 0.9534 long term bottom could be correcting the multi-decade downtrend or the start of a long term up trend. In either case, further rise should be seen to 100% projection of 0.9534 to 1.1274 from 1.0176 at 1.1916. This will now remain the favored case as long as 1.1604 support holds.
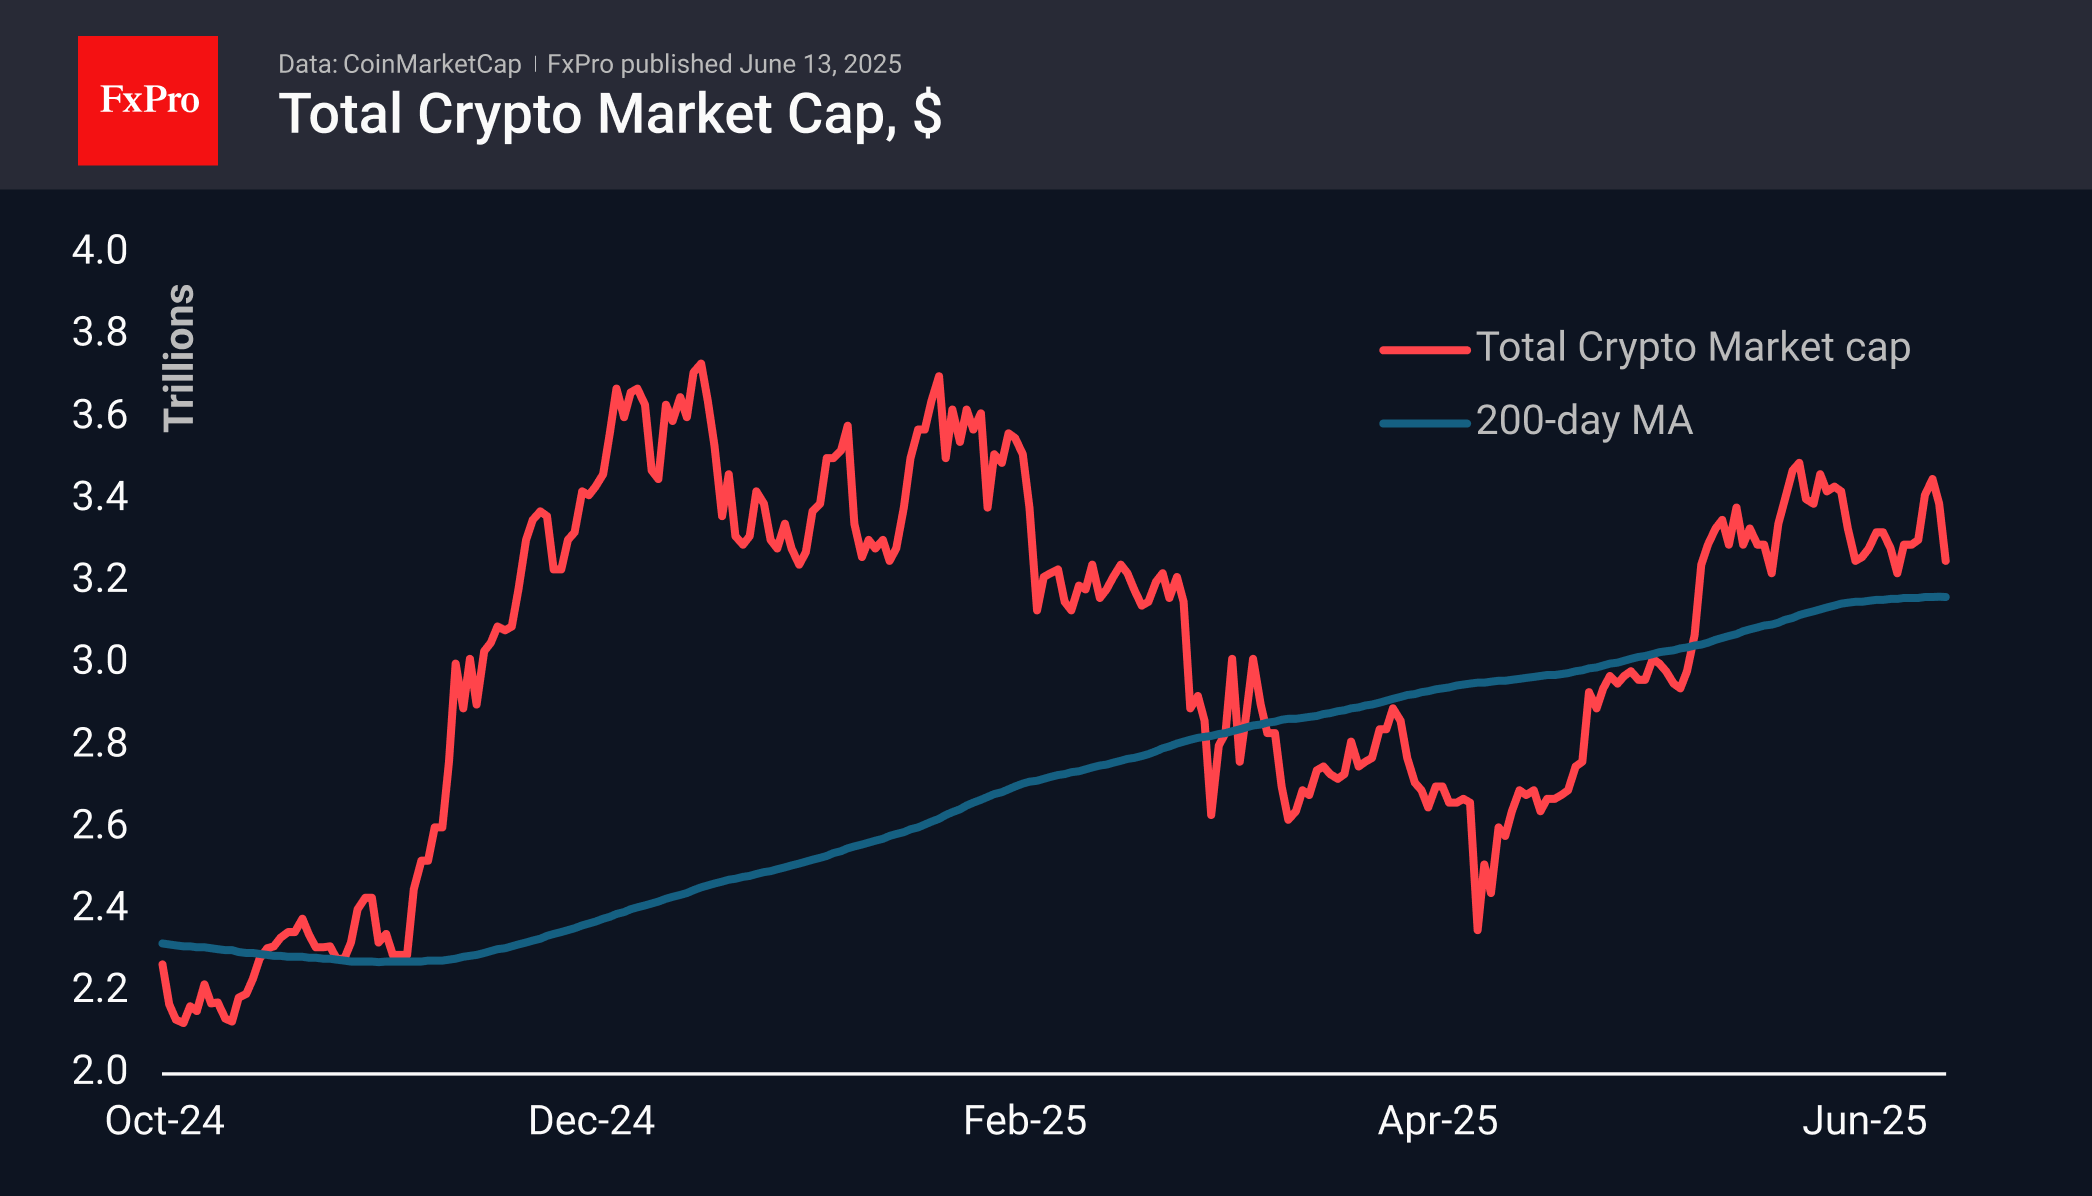
Crypto Market Tests Support Again
Market Picture
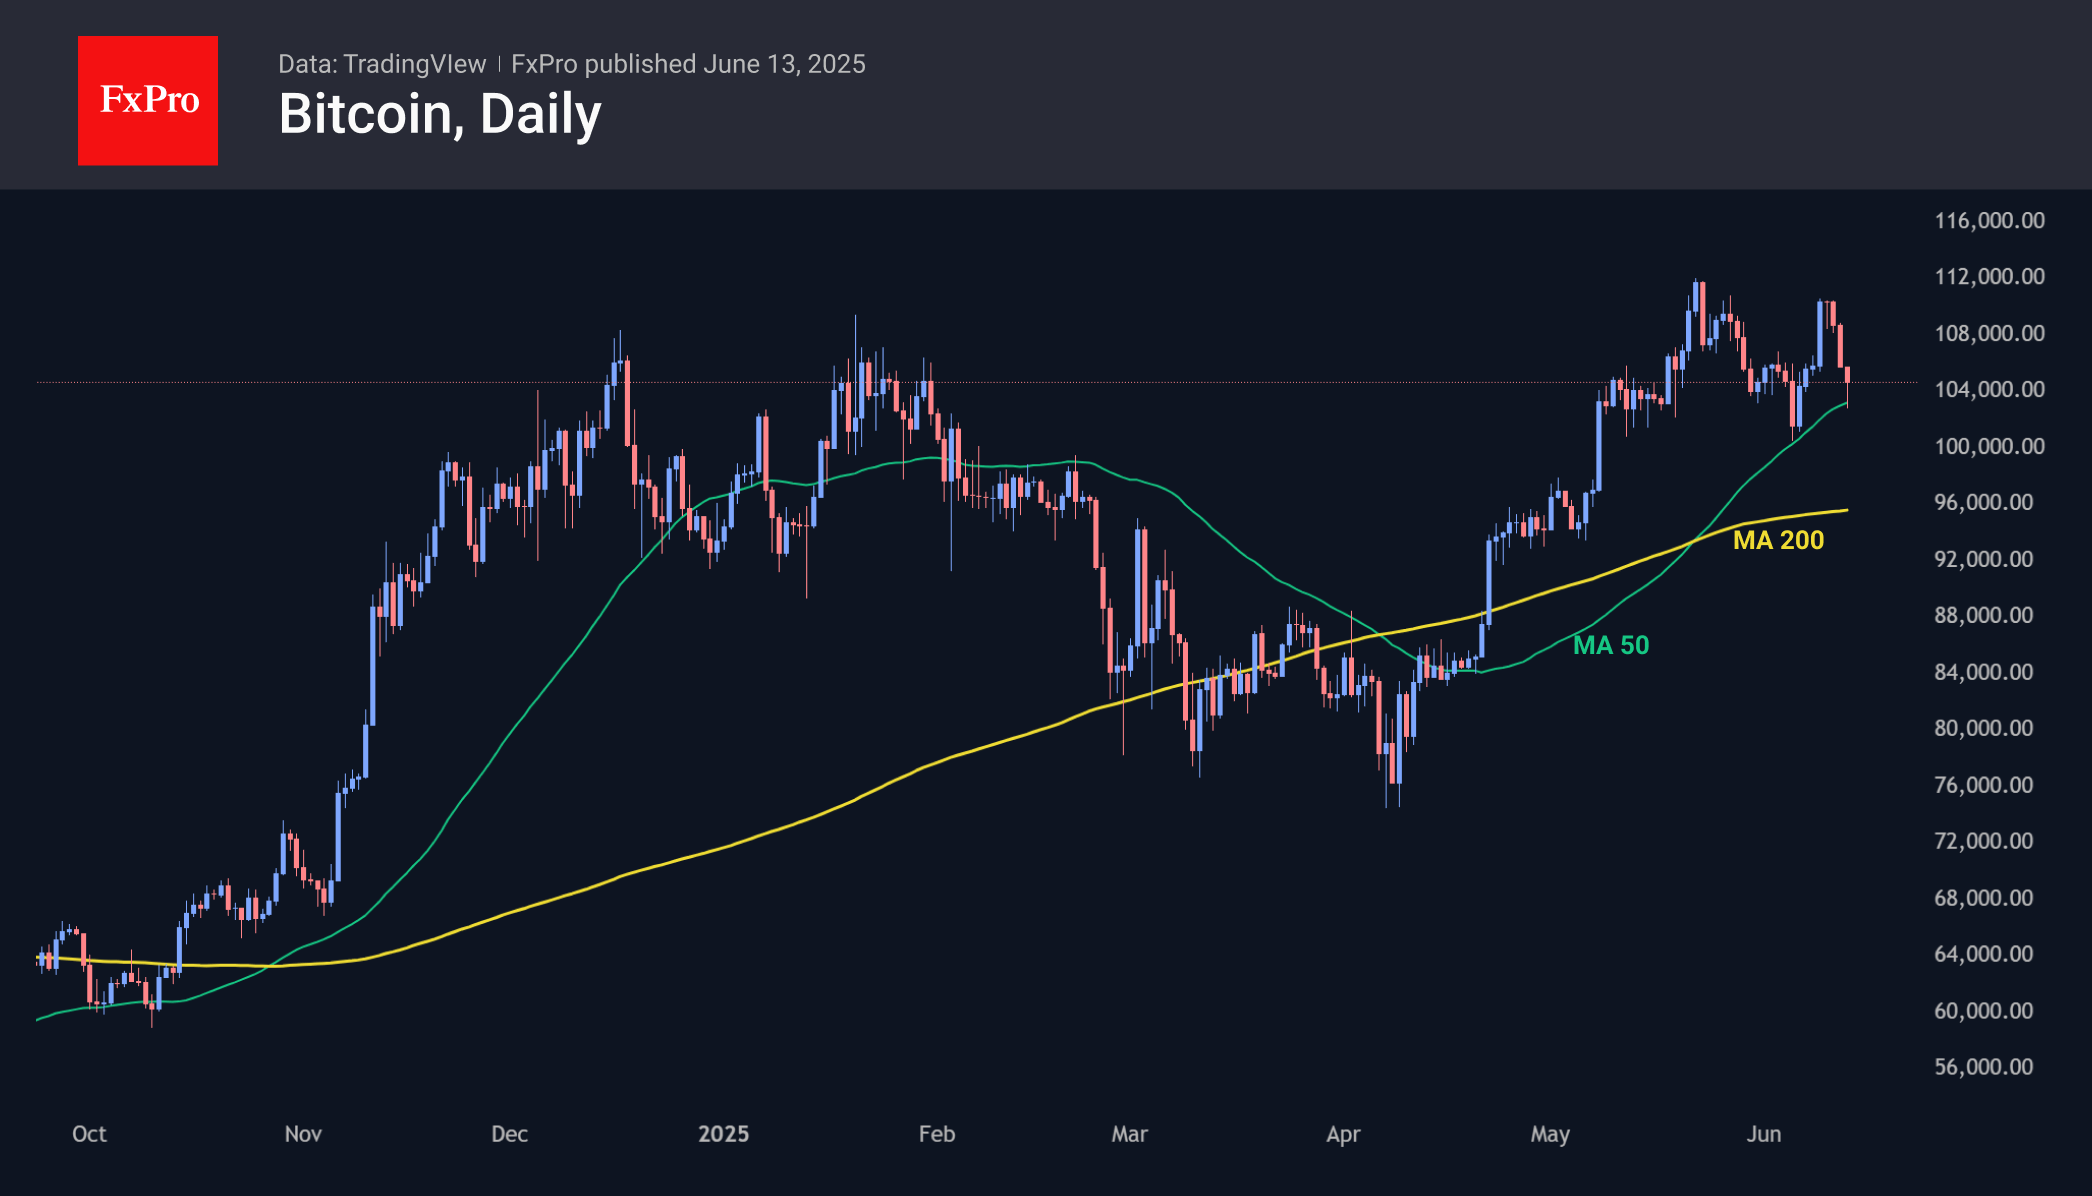
Market capitalisation fell to $3.22 trillion on Friday morning from a peak of $3.47 trillion at the end of Wednesday amid a flight from risk assets due to the conflict between Israel and Iran. In recent hours, the market has rebounded from the support line that has been in place since May, reaching $3.28 trillion. Technical levels are working in the short term, but they may prove powerless in the event of a broader liquidation of bulls with a breakout of support in the $3.20–3.25 trillion range. In this case, the market could easily drop to $3 trillion or even target cyclical support in the $2.50 trillion area.
Bitcoin fell to $102.5K at the start of the day in Asia, repeating its touch of the 50-day moving average, as it did a week earlier. Although the reaction of the first cryptocurrency was sharp, the recovery to $105.0 at the time of writing indicates strong interest in buying on dips. At the same time, we do not support the idea that military conflicts are favourable for cryptocurrencies.
News Background
LVRG notes that investors are increasingly viewing Ethereum as an undervalued asset as the SEC hints at possible concessions for DeFi.
Santiment notes bullish sentiment among retail investors and a lack of desire among whales to lock in profits despite Bitcoin’s proximity to historic highs.
Bitcoin on-chain data signals a reduction in supply. Despite low retail investor activity and recent negative funding rates, large players continue to accumulate the asset, CryptoQuant notes.
The number of coins in centralised exchange wallets continues to fall, dropping to 2.5 million BTC — the lowest since August 2022. Over-the-counter (OTC) platforms used for large transactions are also experiencing a shortage. Their reserves have fallen to an all-time low.
The Bitcoin market has undergone a structural transformation towards institutional maturity. According to a report by Gemini and Glassnode, 30.9% of the available supply of BTC is held in the reserves of exchanges, ETFs, companies, and governments. This will contribute to a ‘more sustainable and orderly rally’, as opposed to the sharp spikes seen previously.
Tether acquired nearly 32% of the shares of gold mining company Elemental Altus Royalties for $89 million. The investment is part of Tether’s strategy to strengthen its position in the asset segment, which is backed by real values such as gold and Bitcoin.
EU exports drop -1.9% yoy in April as shipments to China plunge -15.9% yoy
Eurozone trade data for April showed signs of weakening external demand, with goods exports falling -1.4% yoy to EUR 243.0B, while imports edged up 0.1% yoy to EUR 233.1B. Despite the drop in exports, the region maintained a trade surplus of EUR 9.9B, helped by subdued import growth. Intra-Eurozone trade also declined, down -2.0% yoy to EUR 217.3B.
Across the broader European Union, the trade picture reflected similar pressures. EU exports dropped -1.9% yoy to EUR 218.2B, while imports increased 0.5% yoy to EUR 210.7B, yielding a surplus of EUR 7.4B. Intra-EU trade fell -1.7% yoy to EUR 341.9B.
While exports to the US remained a bright spot, rising 3.8% yoy, exports to China plunged -15.9% yoy. On the import side, EU purchases from China rose 8.4% yoy. Imports from the U.S. rose modestly by 2.4% yoy.
Eurozone industrial production down -2.4% mom in April, broad-based weakness
Eurozone industrial production dropped sharply by -2.4% mom in April, significantly below expectations of a -1.6% decline. Output fell in all major categories, with non-durable consumer goods posting the steepest drop at -3.0%. Capital goods, energy (-1.1%), and intermediate goods (-0.7%) also contracted. Durable consumer goods saw a modest -0.2% fall, offering little relief in an otherwise dismal report.
At the EU level, industrial output slipped -1.8% mom, driven by steep declines in Ireland (-15.2%), Malta (-6.2%), and Lithuania (-3.0%). While a few economies such as Denmark (+3.5%) and Luxembourg (+3.2%) managed modest gains, the regional picture remains weak.
GBPUSD Calling the Rally After Elliott Wave Double Three Pattern
Hello fellow traders. In this technical article we’re going to take a look at the Elliott Wave charts charts of GBPUSD Forex pair published in members area of the website. As our members know GBPUSD is bullish against the 1.3410 pivot in first degree. Recently the pair made a clear three-wave correction. The pull back completed as Elliott Wave Double Three pattern and made rally as expected.
In this discussion, we’ll break down the Elliott Wave pattern and forecast.
Elliott Wave Double Three Pattern
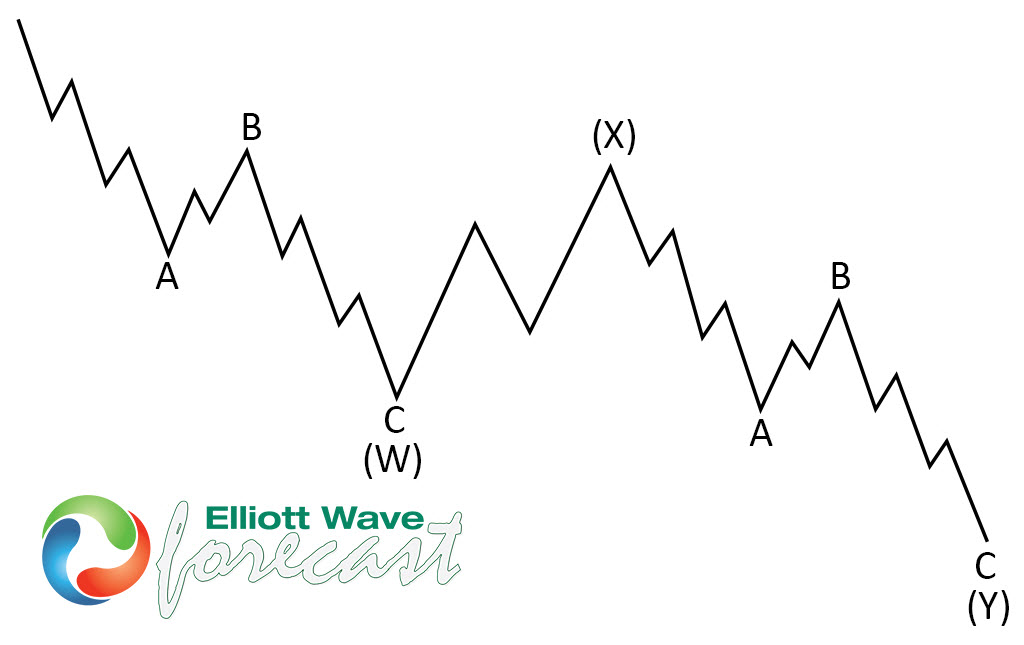
Double three is the common pattern in the market , also known as 7 swing structure. It’s a reliable pattern which is giving us good trading entries with clearly defined invalidation levels.
The picture below presents what Elliott Wave Double Three pattern looks like. It has (W),(X),(Y) labeling and 3,3,3 inner structure, which means all of these 3 legs are corrective sequences. Each (W) and (Y) are made of 3 swings , they’re having A,B,C structure in lower degree, or alternatively they can have W,X,Y labeling.
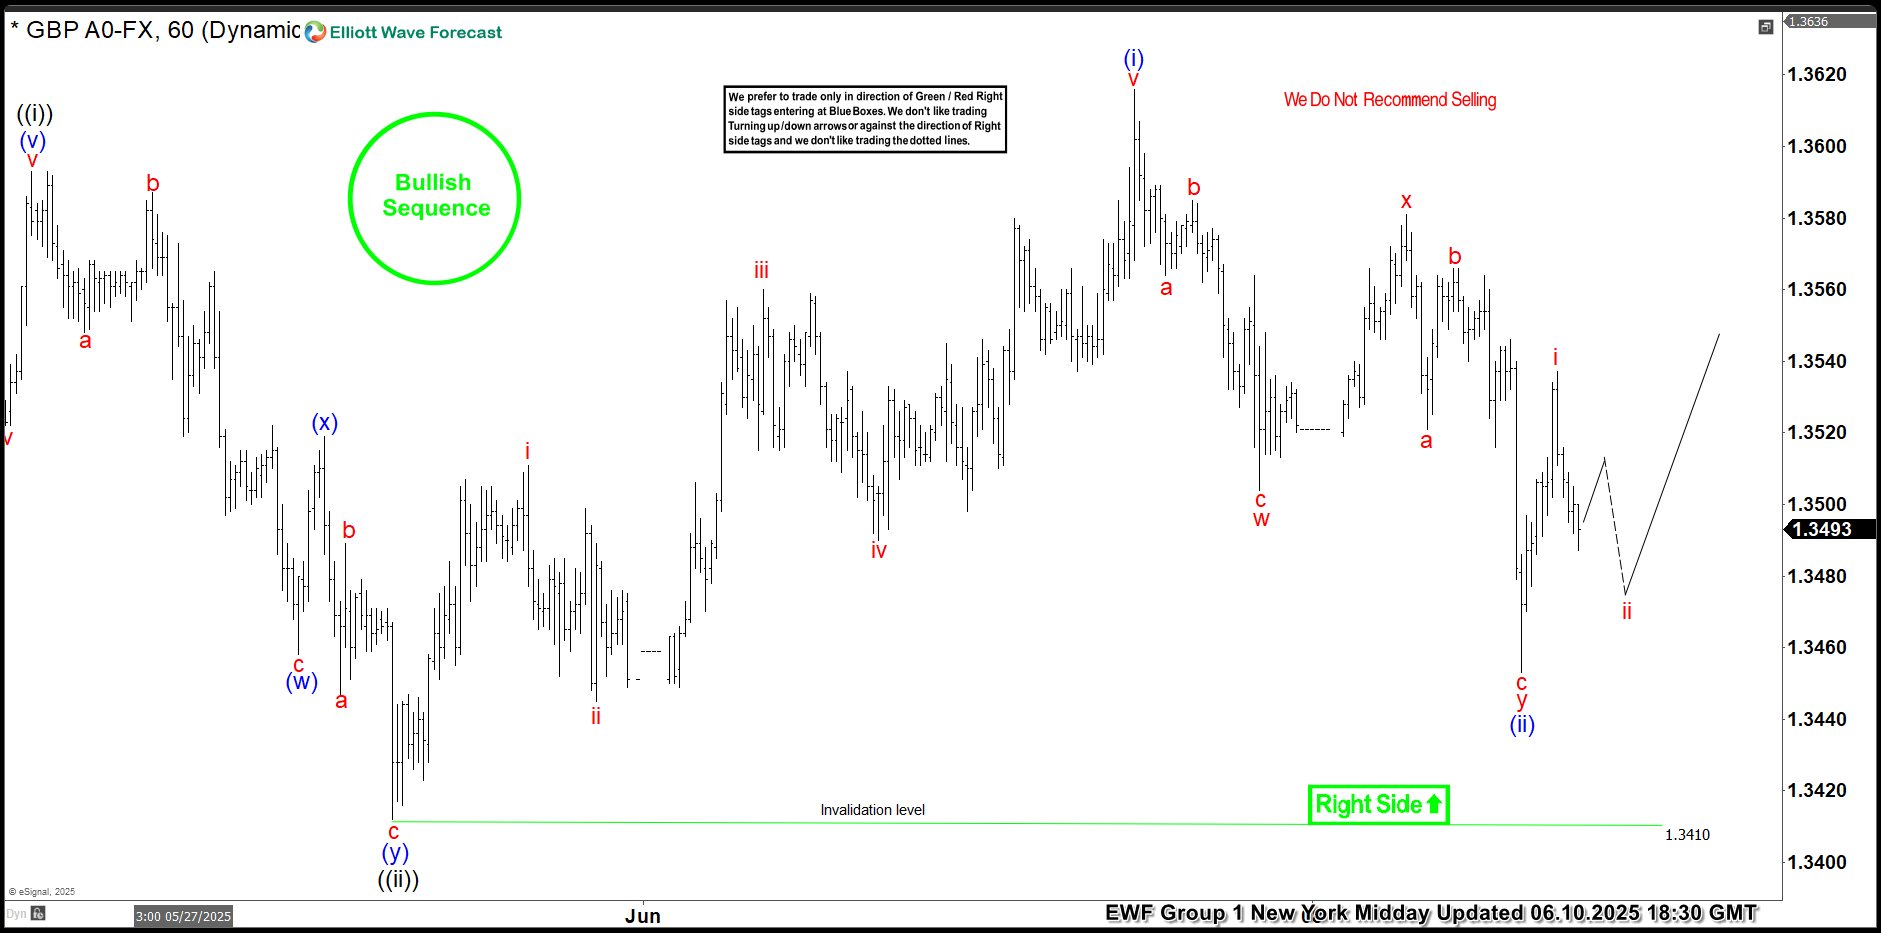
GBPUSD Elliott Wave 1 Hour Chart 06.10.2025
GBPUSD is showing higher high sequences in the cycle from the April 8th low , suggesting further strength ahead. The structure of the latest pullback shows 7 swings – Double Three Pattern. The first leg, shows a clear 3-wave structure a,b,c red, followed by a 3-wave bounce in x . We can also count 3 swings in y red leg. We advise against selling $GBPUSD and instead favor the long side. While the price stays above (ii) blue and more importantly above ((ii)) black low, we expect to see further rally toward new highs.
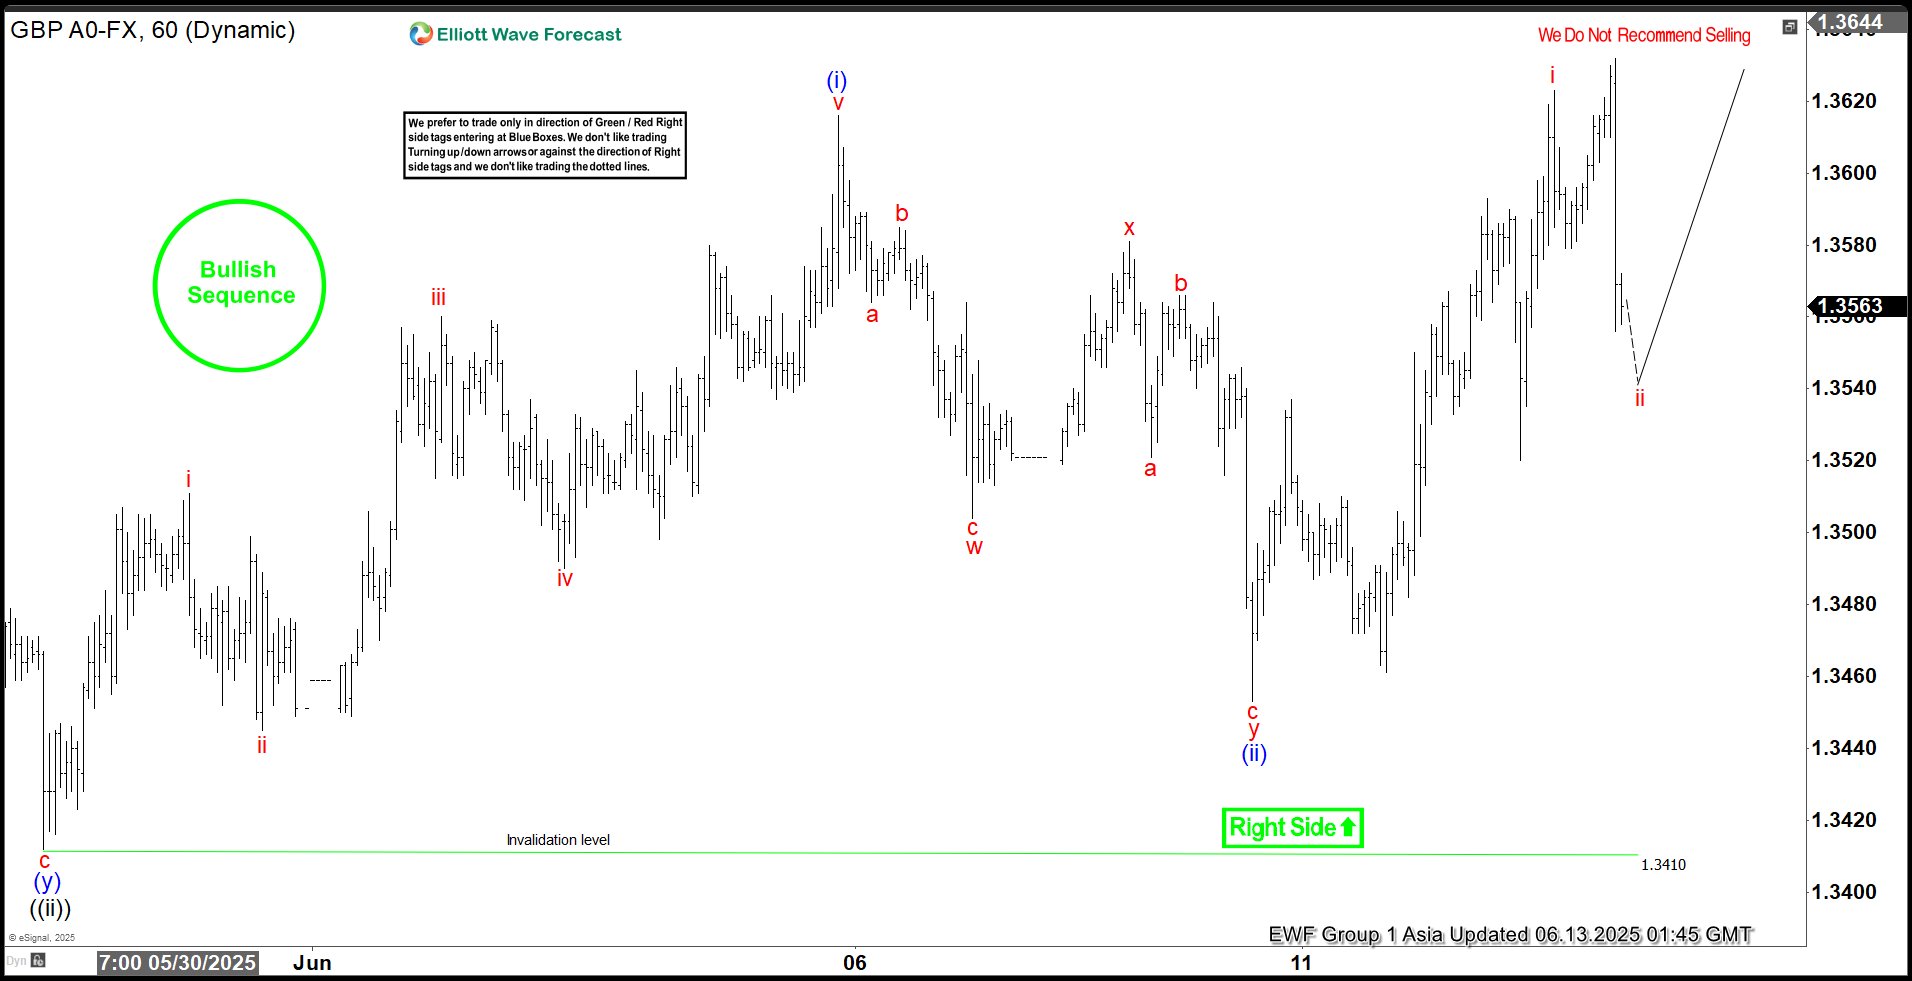
GBPUSD Elliott Wave 1 Hour Chart 06.10.2025
GBPUSD found buyers as expected. The forex pair has reacted strongly and eventually we got a break toward new highs. Now, intraday pull backs should ideally keep finding buyers as far as 1.341 pivot holds.
Israel Strikes Iran. Oil and Gold Prices Surge
According to media reports, Israel launched a large-scale overnight strike on Iranian territory, targeting dozens of military and strategic facilities linked to the country’s nuclear programme and missile capabilities. Israeli officials justified the action by citing an existential threat from Tehran, which, according to their intelligence, is accelerating its development of nuclear weapons and expanding its arsenal of ballistic missiles.
In response, Iran has vowed severe retaliation, stating that the United States and Israel will “pay a heavy price” for the attack. US President Donald Trump has urgently convened a meeting to assess the situation.
Commodities Market Reaction
In the wake of these developments, gold — the primary safe-haven asset — surged sharply. The XAU/USD price broke above its May high, rising past $3,440. However, the all-time high near $3,498 remains intact for now.
Oil prices also spiked due to fears of supply disruption. The military conflict threatens shipping through the Strait of Hormuz, a crucial chokepoint through which one-fifth of the world’s oil supply passes. Traders quickly priced in the risk of war, anticipating a supply shortage driven by large-scale instability in the Middle East.
Technical Analysis of the XBR/USD Chart
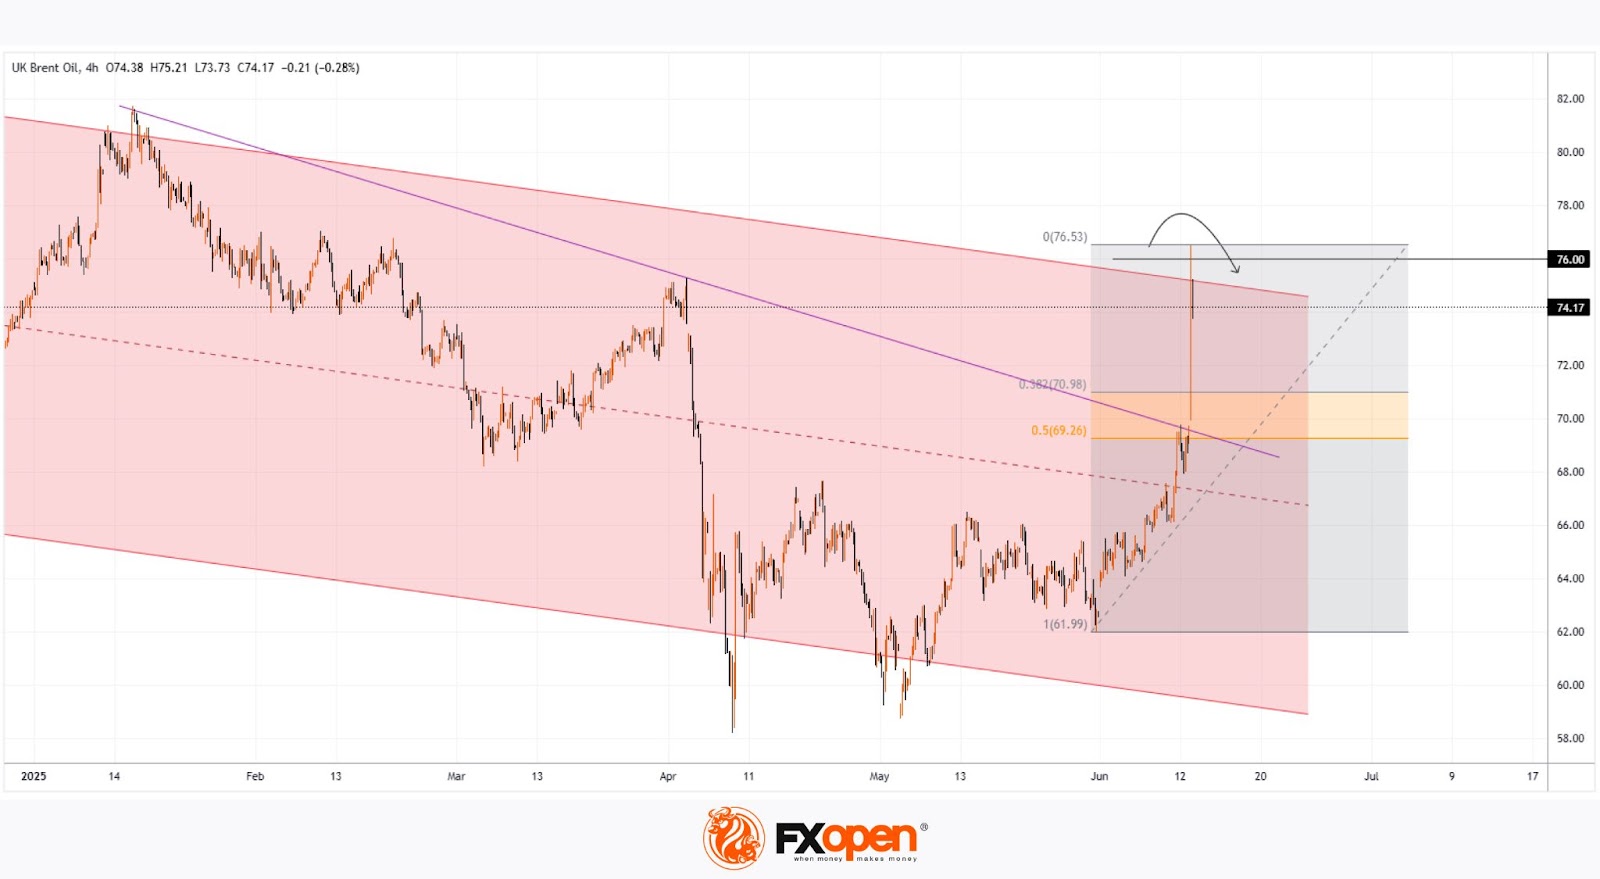
Brent crude oil price has risen to the upper boundary of a large-scale descending channel (shown in red), which is defined by lower highs from 2024–2025. As anticipated, this upper boundary acted as resistance, with the price forming a peak above $76 before reversing downward (as illustrated by the black arrow).
From a technical standpoint, following such a sharp rally, Brent is vulnerable to a corrective move. In this scenario, a pullback into the orange zone is possible, where support may be found at:
→ The psychologically important $70 level;
→ The 50% Fibonacci retracement level;
→ The former resistance of the purple descending trendline, now turned support.
Nevertheless, given the scale of the geopolitical threat, it is unlikely that market sentiment will allow Brent to decline significantly in the near term.
Start trading commodity CFDs with tight spreads. Open your trading account now or learn more about trading commodity CFDs with FXOpen.
This article represents the opinion of the Companies operating under the FXOpen brand only. It is not to be construed as an offer, solicitation, or recommendation with respect to products and services provided by the Companies operating under the FXOpen brand, nor is it to be considered financial advice.
S&P 500 Breaks Uptrend
Only yesterday we questioned the sustainability of the stock market’s upward trend amid alarming news from the Middle East and the evacuation of the US embassy in Iraq — and today, the S&P 500 chart (US SPX 500 mini on FXOpen) shows a break below the lower boundary of the ascending trend channel.
According to media reports:
→ Steve Witkoff, US President Donald Trump’s special envoy to the Middle East, was expected to meet Iran’s Foreign Minister in Oman on Sunday.
→ Friday the 13th became the date when Israel launched strikes on Iran’s nuclear facilities, dramatically altering the outlook for a potential US-Iran nuclear agreement.
→ Secretary of State Marco Rubio stated that the US was not involved in the operation, while Israel’s state broadcaster reported that Washington had been informed ahead of the strikes.
Technical Analysis of the S&P 500 Chart
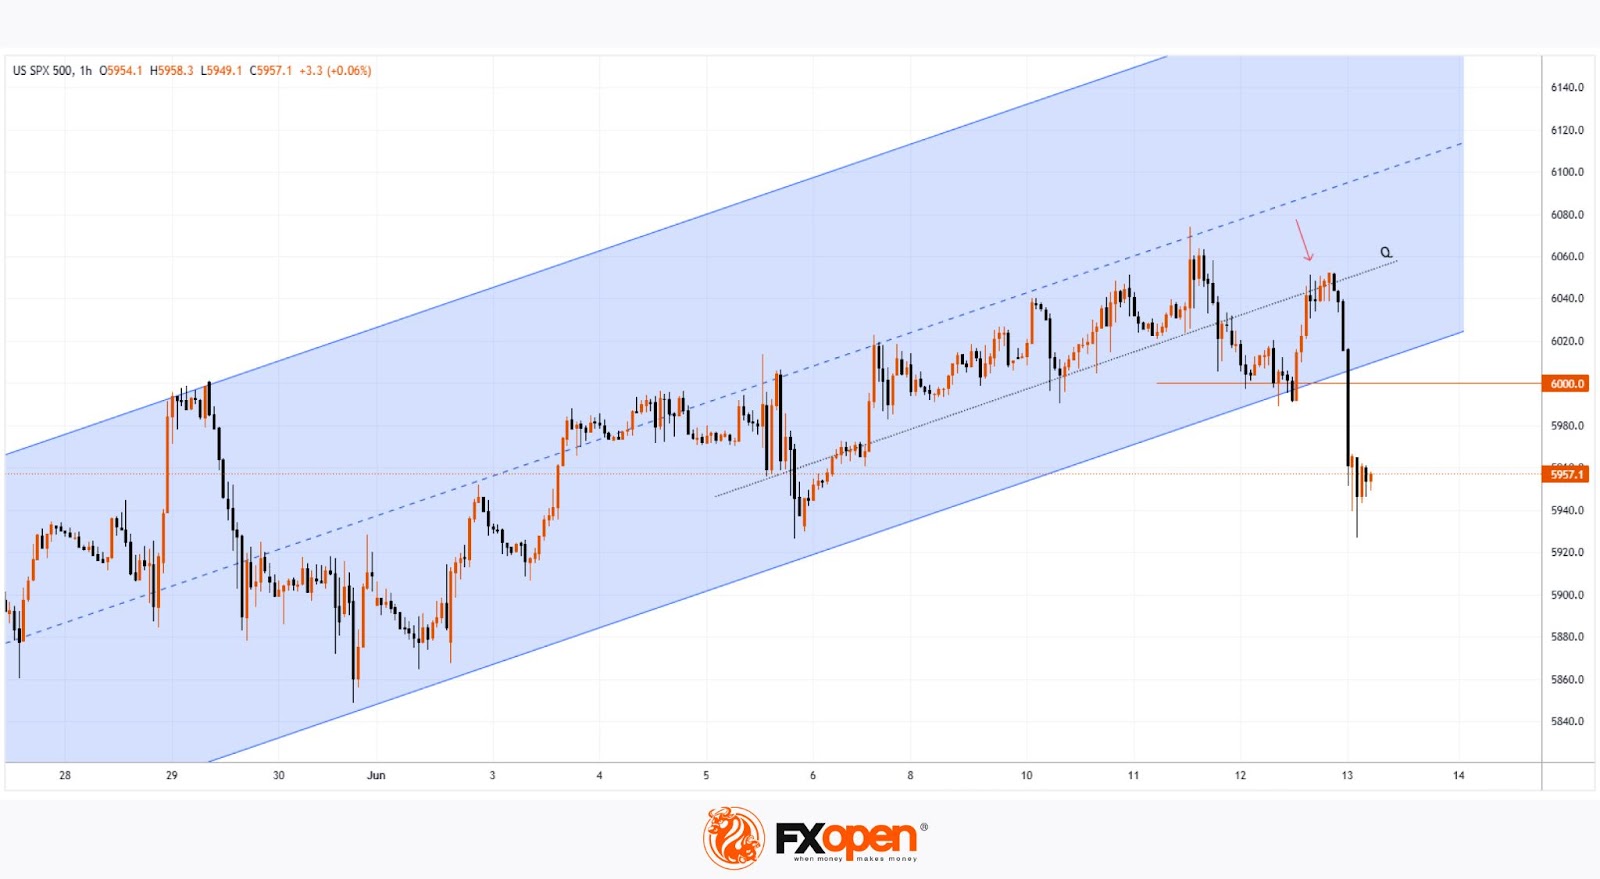
Yesterday morning, we noted that the Q-line, which divides the lower half of the channel into two quarters, had shifted from acting as support to becoming resistance. This was confirmed during the US trading session (as indicated by the arrow).
Selling pressure intensified, and the psychologically important 6,000 level — which showed signs of support earlier in June — now appears to be acting as resistance. It is in this area that the E-Mini S&P 500 (US SPX 500 mini on FXOpen) broke below the lower boundary of its uptrend channel.
In addition to ongoing discussions about potential Fed rate cuts this summer, geopolitical risk assessments are now also in focus. It remains unclear how Washington will respond if Iran retaliates.
Meanwhile, Israel’s Defence Minister has declared a state of emergency, warning of an imminent missile and drone attack — further fuelling fears of a possible escalation.
Trade global index CFDs with zero commission and tight spreads. Open your FXOpen account now or learn more about trading index CFDs with FXOpen.
This article represents the opinion of the Companies operating under the FXOpen brand only. It is not to be construed as an offer, solicitation, or recommendation with respect to products and services provided by the Companies operating under the FXOpen brand, nor is it to be considered financial advice.
GBP/JPY Daily Outlook
Daily Pivots: (S1) 194.73; (P) 195.33; (R1) 195.94; More...
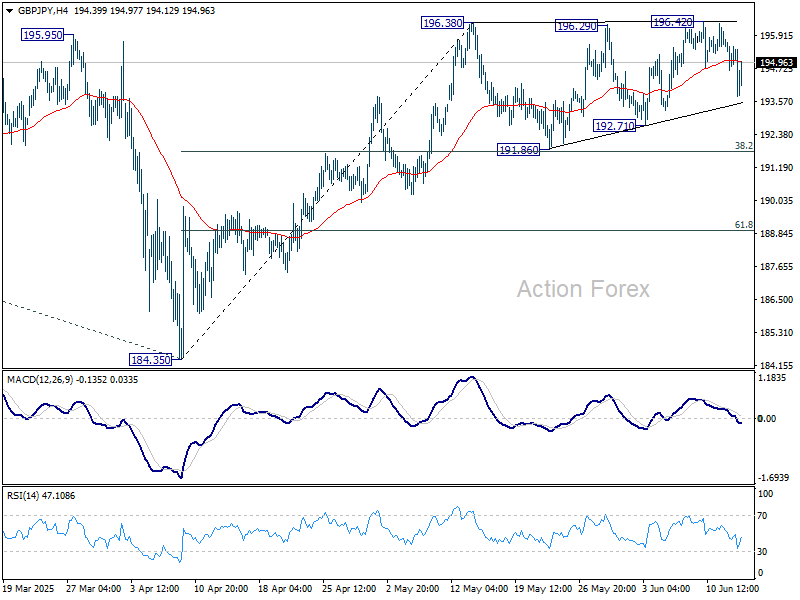
Range trading continues in GBP/JPY and intraday bias remains neutral. Further rise is in favor as long as 191.86 support holds. Firm break of 196.38 will resume whole rally from 184.35 to 199.79 resistance, and possibly further to 100% projection of 180.00 to 199.79 from 184.35 at 204.14.
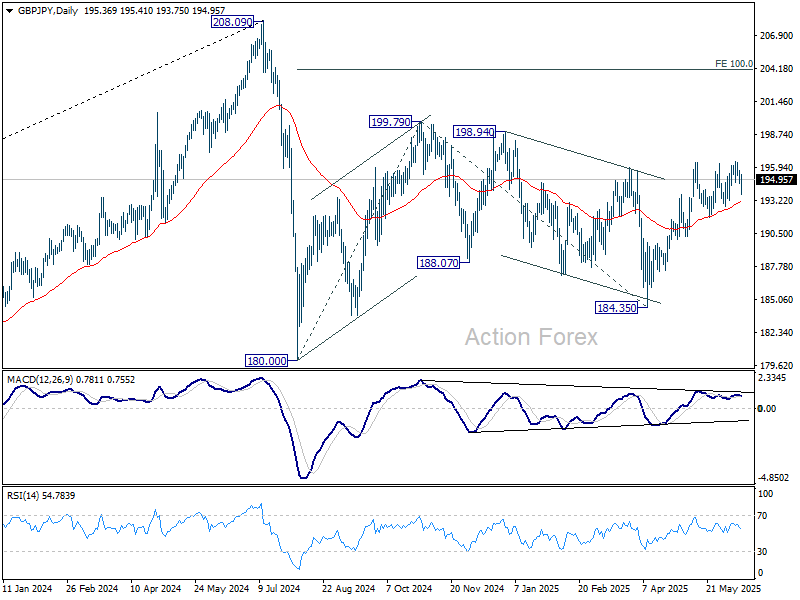
In the bigger picture, price actions from 208.09 are seen as a correction to rally from 123.94 (2020 low). Strong support should be seen from 38.2% retracement of 123.94 to 208.09 at 175.94 to contain downside. However, sustained break of 175.94 will bring deeper fall even still as a correction.
EUR/JPY Daily Outlook
Daily Pivots: (S1) 165.56; (P) 166.16; (R1) 166.82; More...
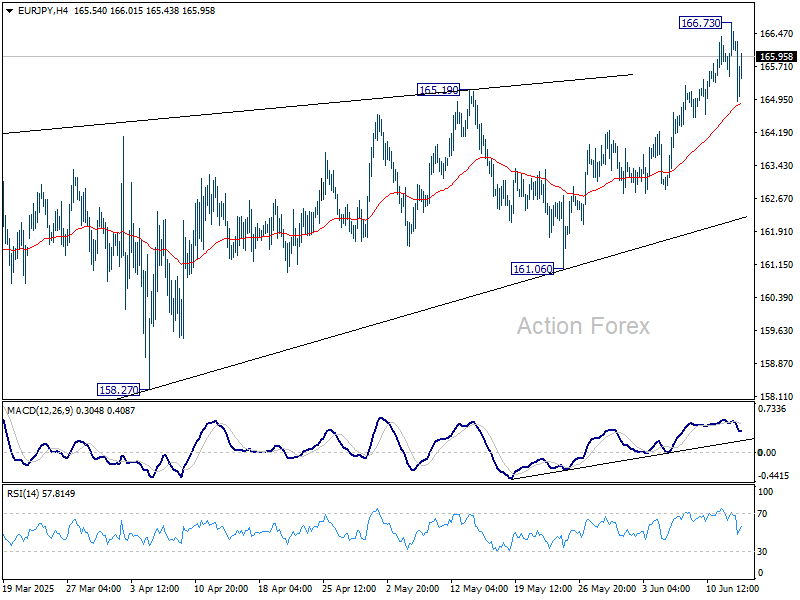
Intraday bias in EUR/JPY is turned neutral with current retreat. Some consolidations could be seen but further rise is expected as long as 55 D EMA (now at 163.15) holds. Above 166.73 will resume the rise from 154.77 to 61.8% retracement of 175.41 to 154.77 at 167.38.
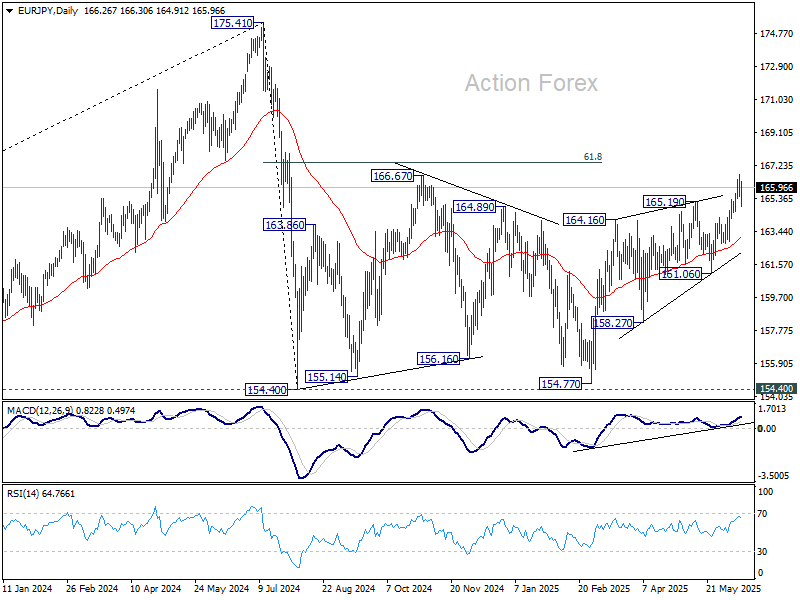
In the bigger picture, price actions from 175.41 are seen as correction to up trend from 114.42 (2020 low). Strong support should be seen from 38.2% retracement of 114.42 to 175.41 at 152.11 to contain downside. However, sustained break of 152.11 will bring deeper fall even still as a correction.
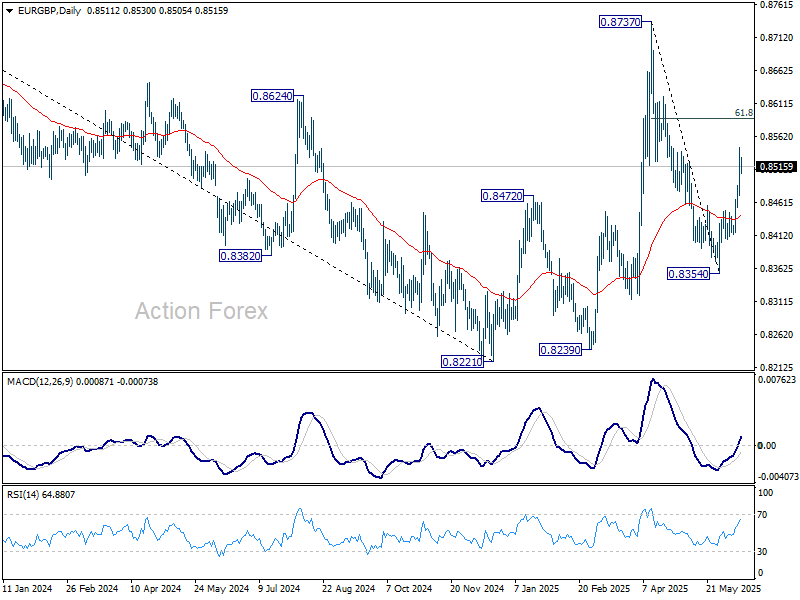
EUR/GBP Daily Outlook
Daily Pivots: (S1) 0.8474; (P) 0.8511; (R1) 0.8546; More...
Intraday bias in EUR/GBP remains on the upside for the moment. Current rebound from 0.8354 is in progress for 61.8% retracement of 0.8737 to 0.8354 at 0.8591. Firm break there will pave the way to 0.8373 resistance. On the downside, below 0.8475 minor support will turn intraday bias neutral first.
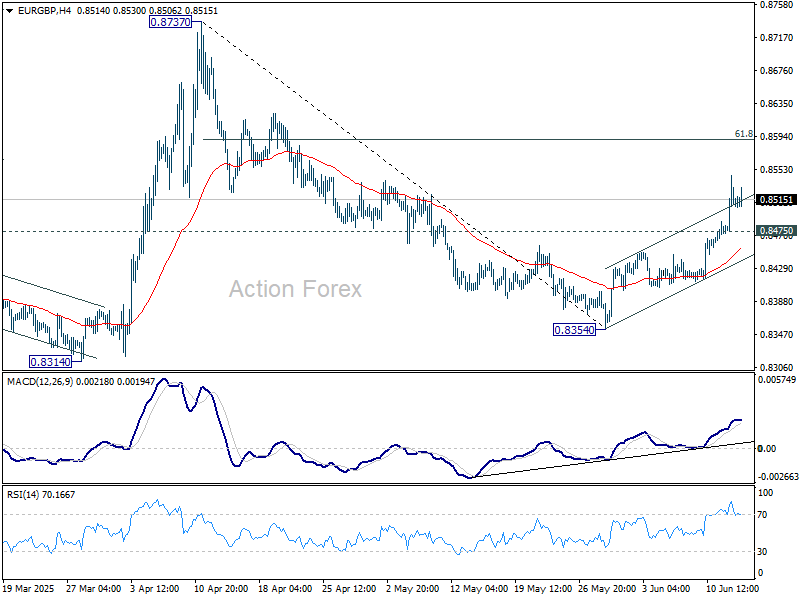
In the bigger picture, price actions from 0.8221 medium term bottom are merely forming a corrective pattern. Nevertheless, there is no clear momentum to break through 0.8201 key support (2022 low) yet. Hence, range trading is expected between 0.8221/8737 for now.