Sample Category Title
GBP/JPY Weekly Outlook
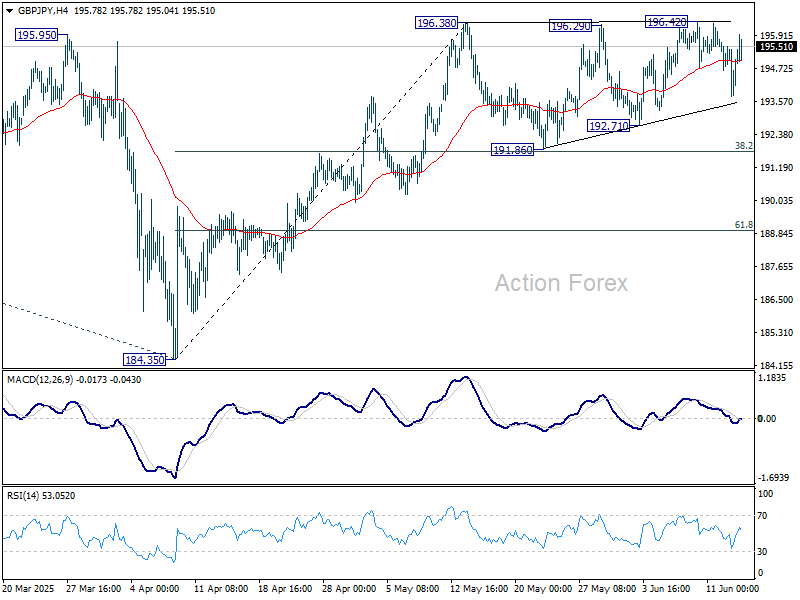
GBP/JPY was still bounded in consolidation pattern from 196.38 last week. Initial bias stays neutral this week first and further rise is expected with 191.86 support intact. Firm break of 196.38 will resume whole rally from 184.35 to 199.79 resistance, and possibly further to 100% projection of 180.00 to 199.79 from 184.35 at 204.14.
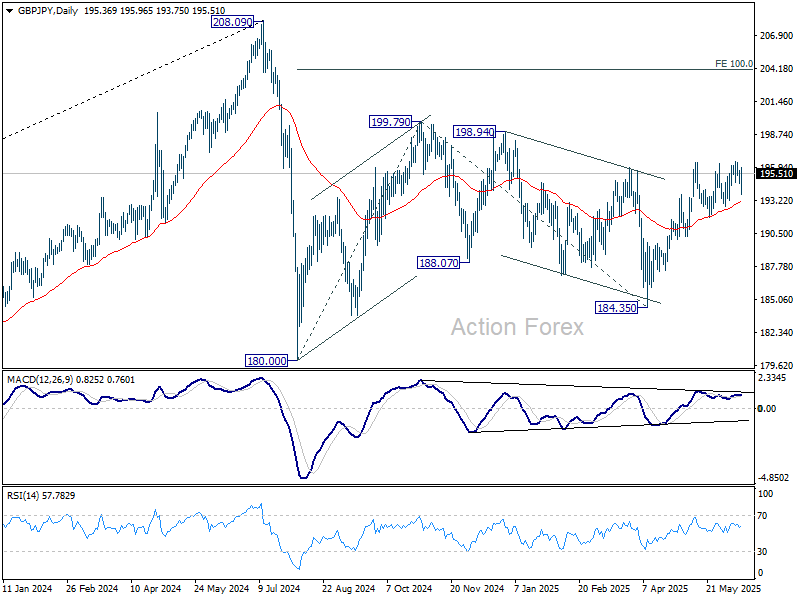
In the bigger picture, price actions from 208.09 are seen as a correction to rally from 123.94 (2020 low). Strong support should be seen from 38.2% retracement of 123.94 to 208.09 at 175.94 to contain downside. However, sustained break of 175.94 will bring deeper fall even still as a correction.
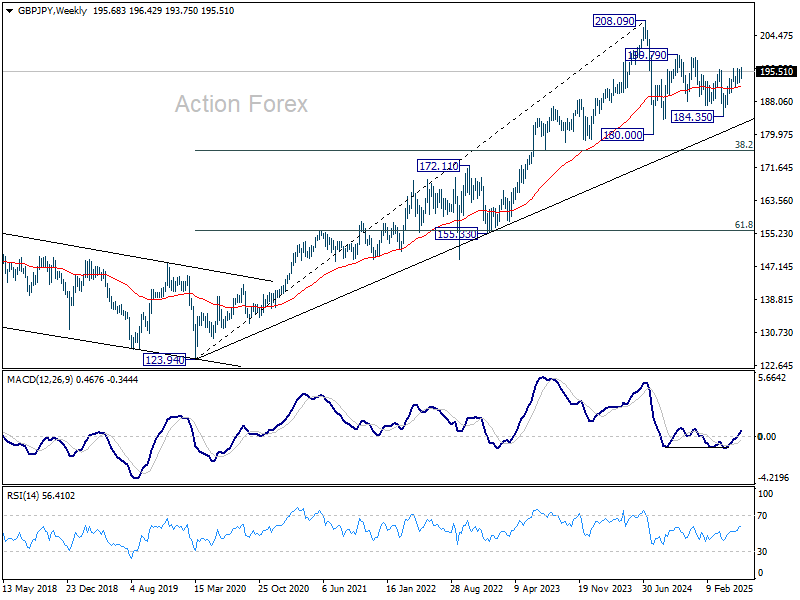
In the longer term picture, while a medium term top was formed at 208.09 (2024 high), it's still early to conclude that the up trend from 122.75 (2016 low) has completed. But GBP/JPY is at least in a medium term corrective phase, with risk of correction to 55 M EMA (now at 176.62).
EUR/JPY Weekly Outlook
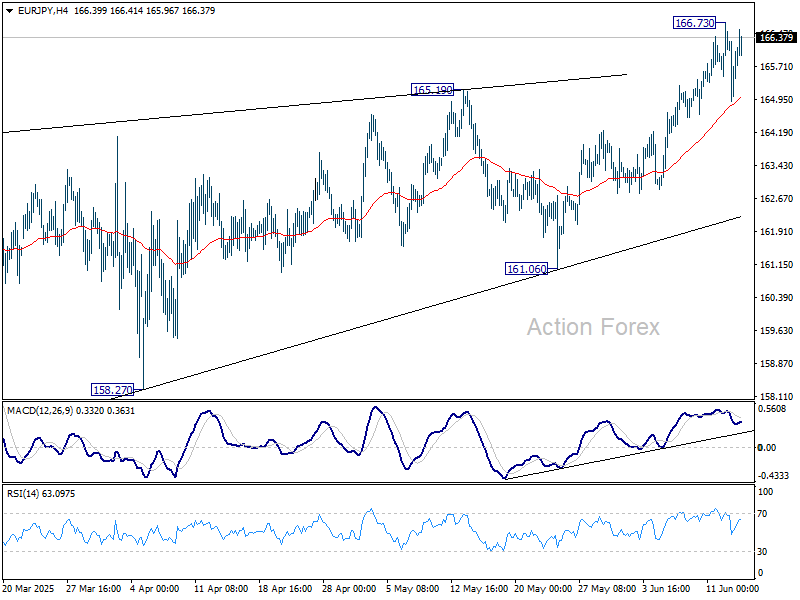
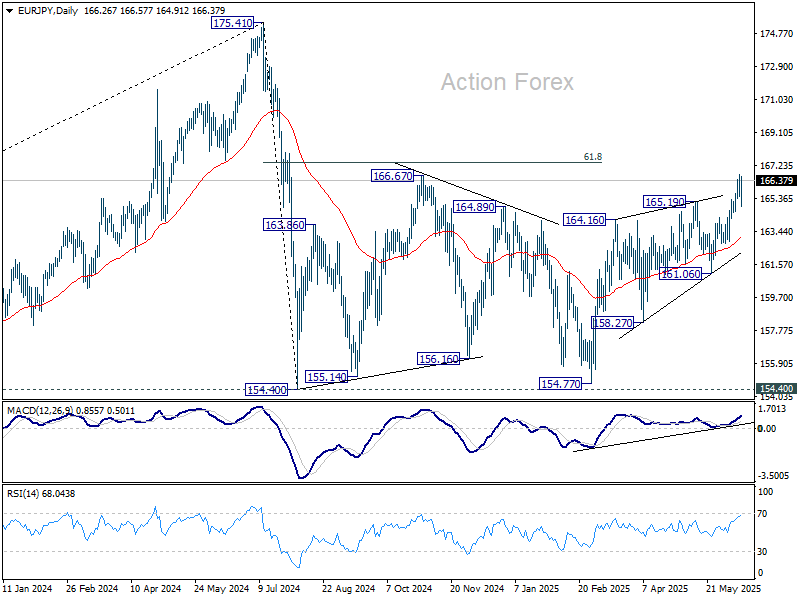
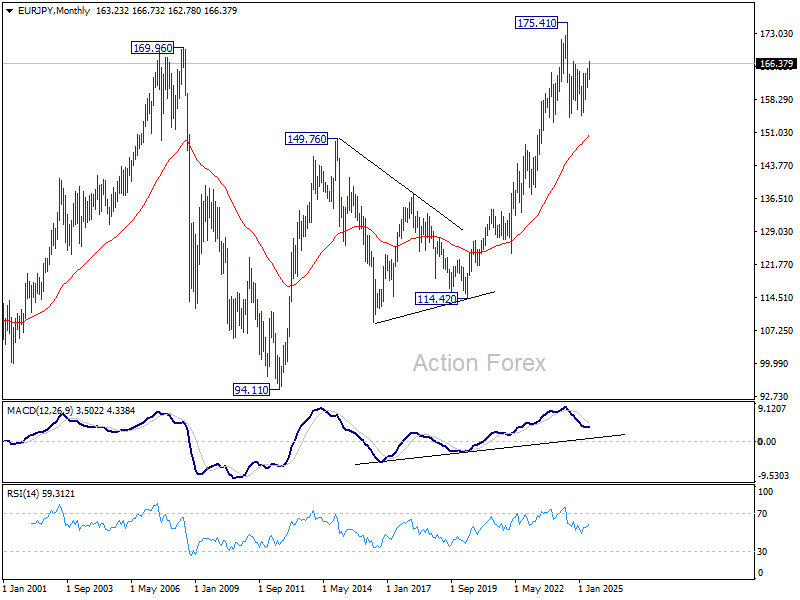
EUR/JPY surged to as high as 166.73 last week but turned sideway since then. Initial bias remains neutral this week first. Further rally is expected as long as 55 D EMA (now at 163.16) holds. Above 166.73 will resume the rise from 154.77 to 61.8% retracement of 175.41 to 154.77 at 167.38.
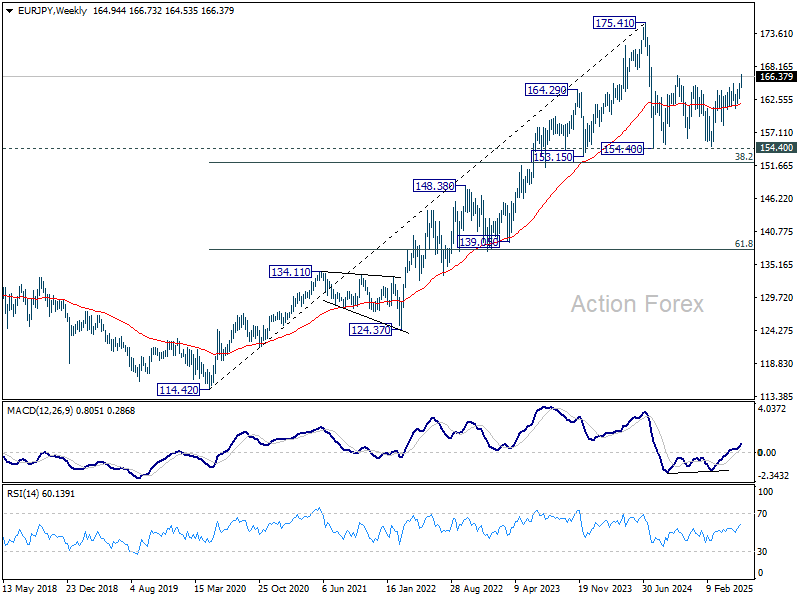
In the bigger picture, price actions from 175.41 are seen as correction to up trend from 114.42 (2020 low). Strong support should be seen from 38.2% retracement of 114.42 to 175.41 at 152.11 to contain downside. However, sustained break of 152.11 will bring deeper fall even still as a correction.
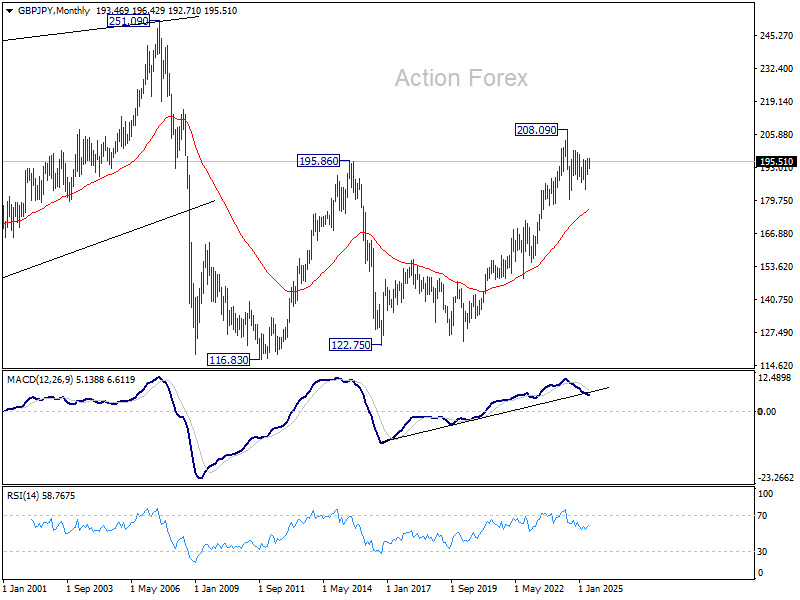
In the long term picture, while 175.41 is at least a medium term top, it's still early to conclude that up trend from 94.11 (2012 low) has completed. A medium term corrective phase is in progress with risk of deeper fall back to 55 M EMA (now at 150.49).
EUR/GBP Weekly Outlook
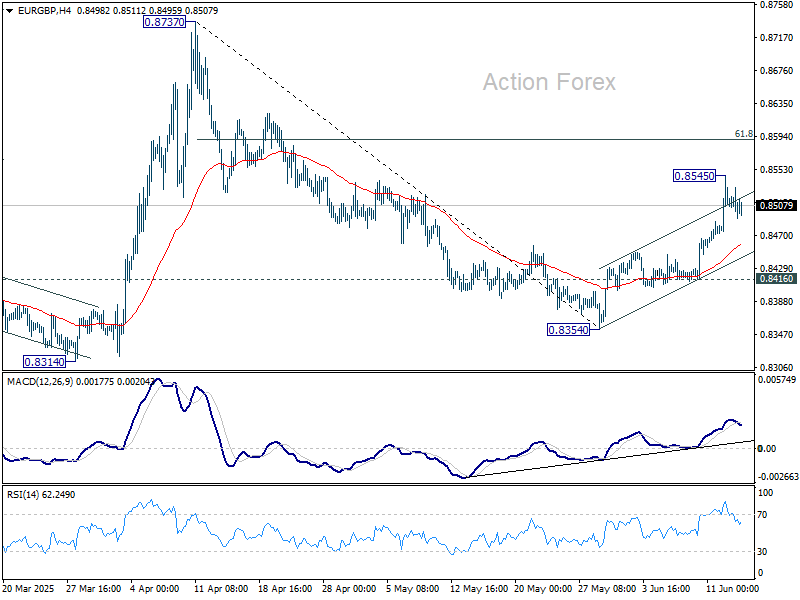
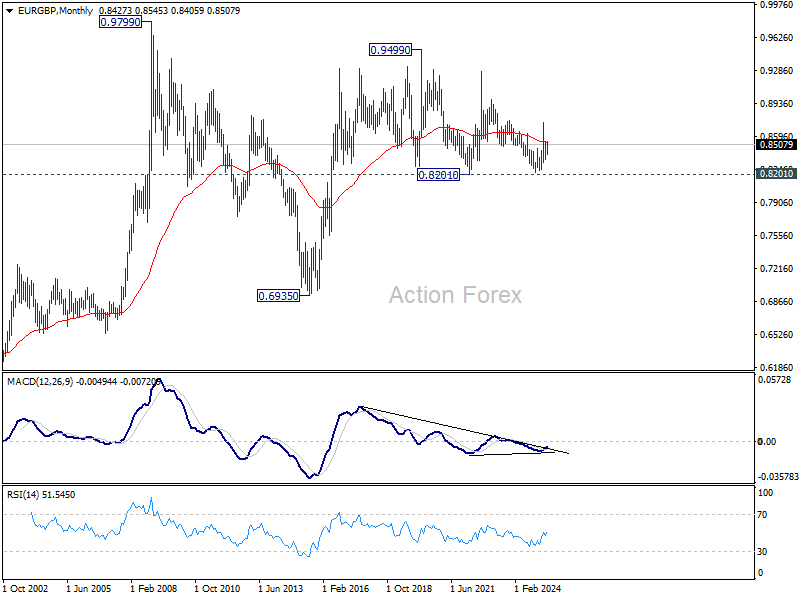
EUR/GBP's rebound from 0.8354 extended higher last week but lost momentum after hitting 0.8545. Initial bias is turned neutral this week first. Further rally is expected as long as 0.8416 support holds. Above 0.8545 will target for 61.8% retracement of 0.8737 to 0.8354 at 0.8591. Firm break there will pave the way to 0.8373 resistance.
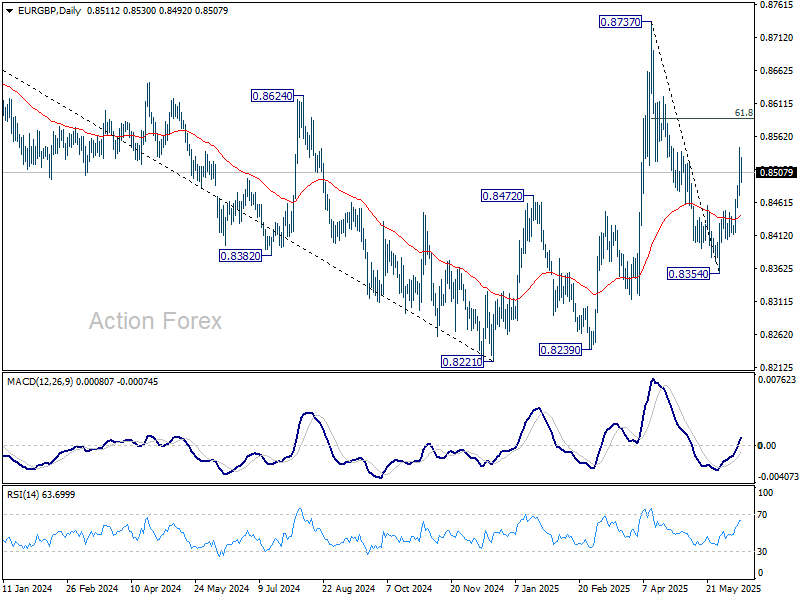
In the bigger picture, price actions from 0.8221 medium term bottom are merely forming a corrective pattern to the down trend from 0.9267 (2022 high). Nevertheless, there is no clear momentum to break through 0.8201 key support (2022 low) yet. Hence, range trading is expected between 0.8221/8737 for now.
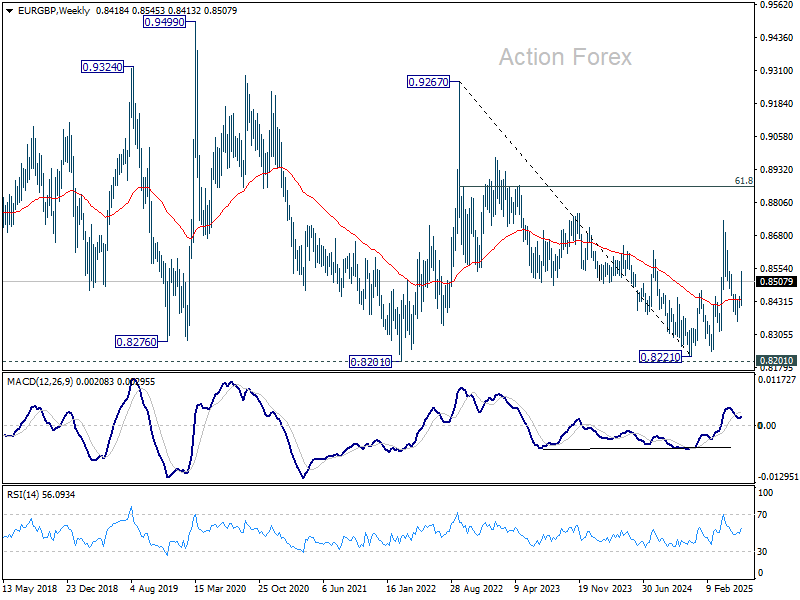
In the long term picture, price action from 0.9499 (2020 high) is seen as part of the long term range pattern from 0.9799 (2008 high). Range trading should continue between 0.8201 and 0.9499, until there is clear signal of imminent breakout.
EUR/AUD Weekly Outlook
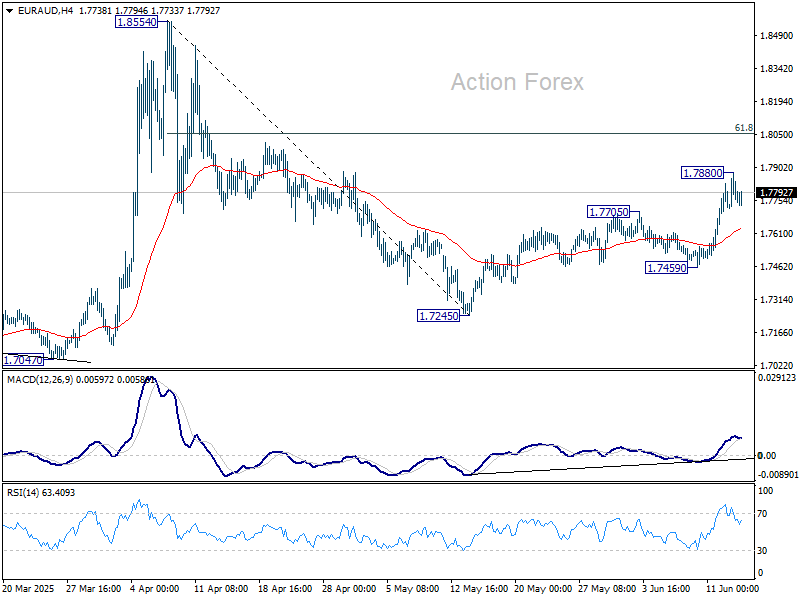
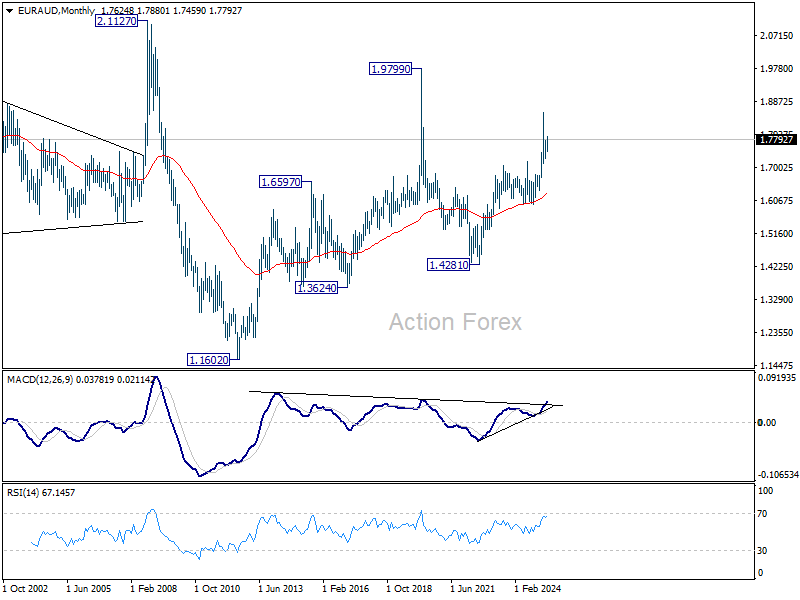
EUR/AUD's rebound from 1.7245 resumed last week but lost some momentum after hitting 1.7880. Initial bias is turned neutral this week first. Overall development suggests that fall from 1.8554 has completed as a corrective move. Further rise is expected as long as 1.7459 support holds. Above 1.7880 will target 61.8% retracement of 1.8554 to 1.7245 at 1.8054. Firm break there will pave the way to 1.8554.
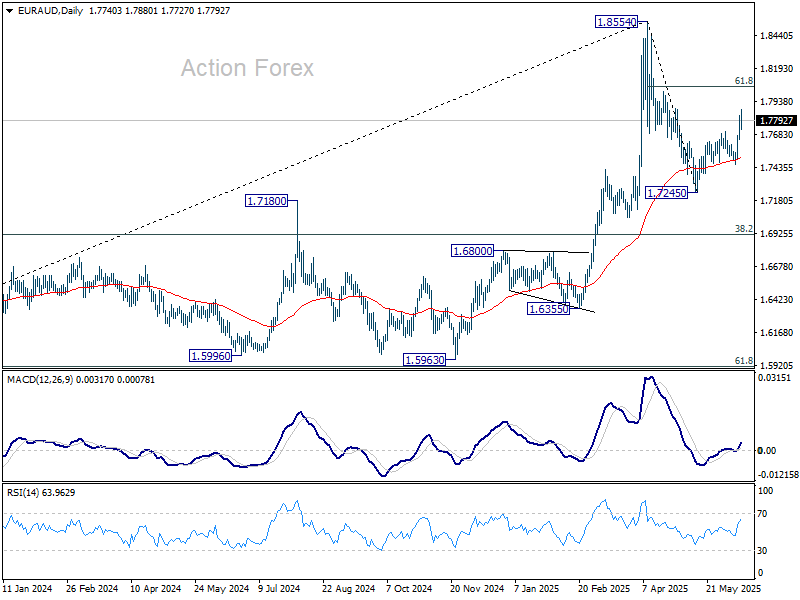
In the bigger picture, with 55 W MACD staying well below signal line, 1.8554 is likely a medium term top already. Price actions from there are seen as a corrective pattern only. While deeper pullback might be seen, downside should be contained by 38.2% retracement of 1.4281 (2022 low) to 1.8554 at 1.6922 to bring rebound. Up trend from 1.4281 is still expected to resume at a later stage.
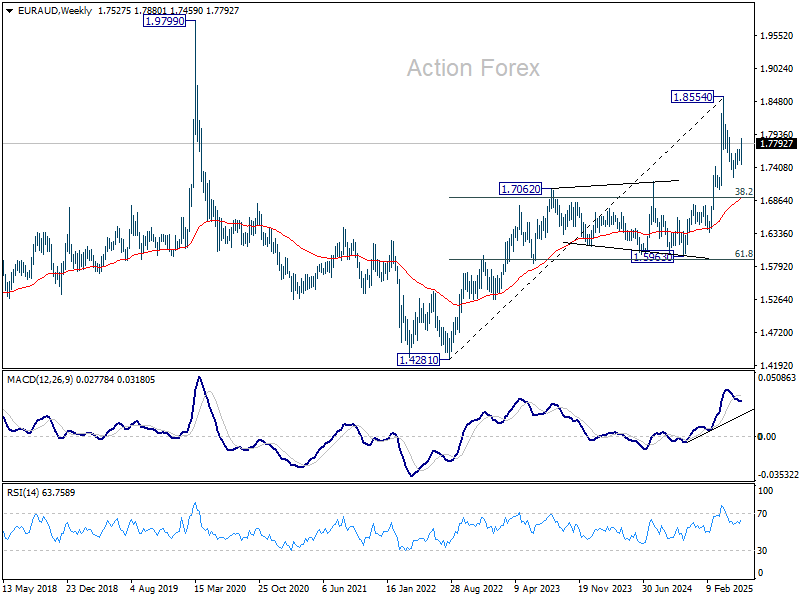
In the longer term picture, rise from 1.4281 is seen as the second leg of the pattern from 1.9799 (2020 high), which is part of the pattern from 2.1127 (2008 high). As long as 55 M EMA (now at 1.6303) holds, this second leg could still extend higher.
EUR/CHF Weekly Outlook
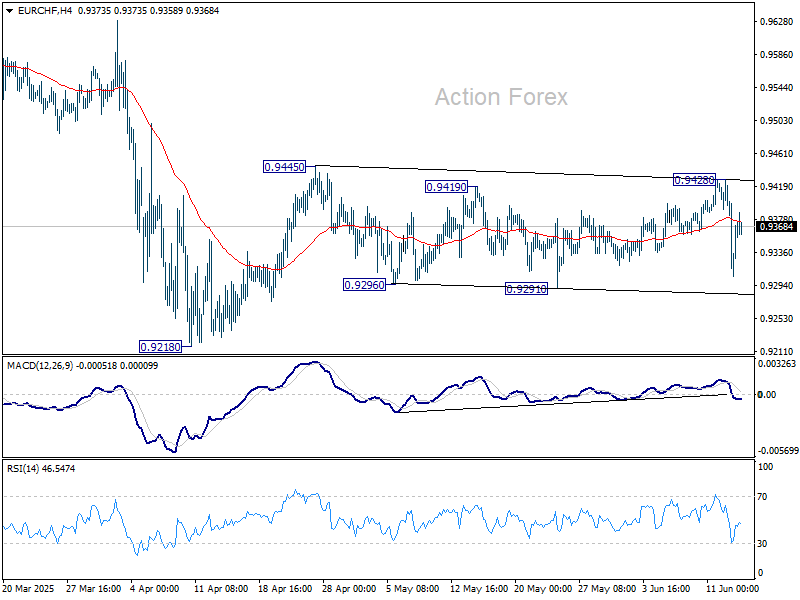
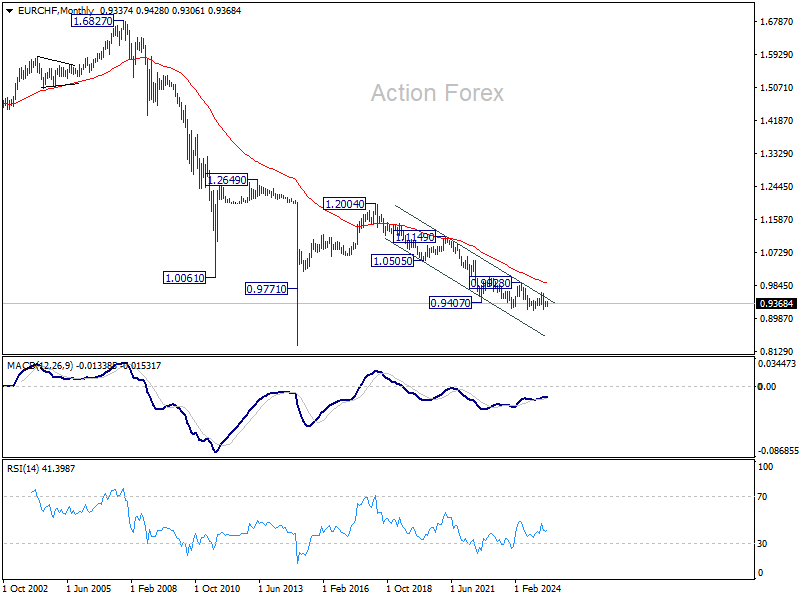
EUR/CHF rose to 0.9428 last week but reversed from there. Nevertheless, downside is contained above 0.9291 support so far. Initial bias stays neutral this week first. On the upside, break of 0.9428/45 resistance zone will resume the rebound from 0.9218. On the downside, break of 0.9291 will bring retest of 0.9218 low instead.
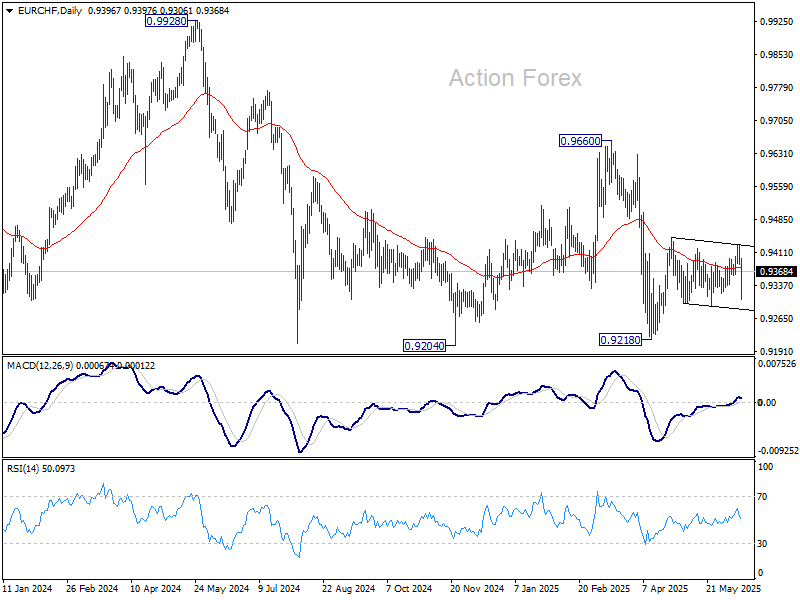
In the bigger picture, prior rejection by long-term falling channel resistance (now at 0.9523) retains medium term bearishness. That is, down trend from 1.2004 (2018 high) is still in progress. Firm break of 0.9204 (2024 low) will confirm resumption. This will remain the favored case as long as 0.9660 resistance holds.
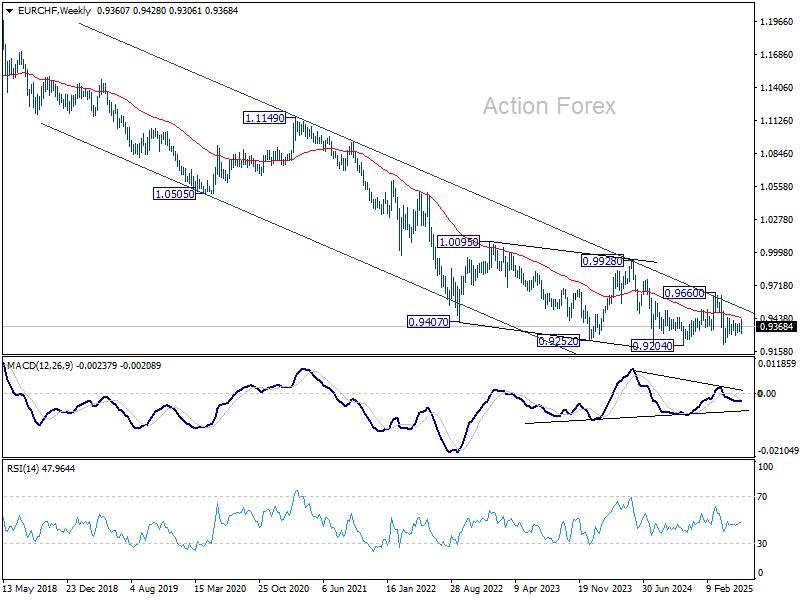
In the long term picture, overall long term down trend is still in force in EUR/CHF. Outlook will continue to stay bearish as long as 55 M EMA (now at 0.9919) holds.
Summary 6/16 – 6/20
Monday, Jun 16, 2025
| GMT | Ccy | Events | Consensus | Previous |
|---|---|---|---|---|
| 22:30 | NZD | Business NZ PSI May | 48.5 | |
| 23:01 | GBP | Rightmove House Price Index M/M Jun | 0.60% | |
| 02:00 | CNY | Industrial Production Y/Y May | 6.00% | 6.10% |
| 02:00 | CNY | Retail Sales Y/Y May | 5.00% | 5.10% |
| 02:00 | CNY | Fixed Asset Investment YTD Y/Y May | 3.90% | 4.00% |
| 06:30 | CHF | PPI M/M May | 0.10% | 0.10% |
| 06:30 | CHF | PPI Y/Y May | -0.50% | |
| 07:00 | CHF | SECO Economic Forecasts | ||
| 12:30 | USD | Empire State Manufacturing Jun | -6.7 | -9.2 |
| GMT | Ccy | Events | |
|---|---|---|---|
| 22:30 | NZD | Business NZ PSI May | |
| Forecast: | Previous: 48.5 | ||
| 23:01 | GBP | Rightmove House Price Index M/M Jun | |
| Forecast: | Previous: 0.60% | ||
| 02:00 | CNY | Industrial Production Y/Y May | |
| Forecast: 6.00% | Previous: 6.10% | ||
| 02:00 | CNY | Retail Sales Y/Y May | |
| Forecast: 5.00% | Previous: 5.10% | ||
| 02:00 | CNY | Fixed Asset Investment YTD Y/Y May | |
| Forecast: 3.90% | Previous: 4.00% | ||
| 06:30 | CHF | PPI M/M May | |
| Forecast: 0.10% | Previous: 0.10% | ||
| 06:30 | CHF | PPI Y/Y May | |
| Forecast: | Previous: -0.50% | ||
| 07:00 | CHF | SECO Economic Forecasts | |
| Forecast: | Previous: | ||
| 12:30 | USD | Empire State Manufacturing Jun | |
| Forecast: -6.7 | Previous: -9.2 | ||
Tuesday, Jun 17, 2025
| GMT | Ccy | Events | Consensus | Previous |
|---|---|---|---|---|
| JPY | BoJ Interest Rate Decision | 0.50% | 0.50% | |
| 06:30 | JPY | BoJ Press Conference | ||
| 09:00 | EUR | Germany ZEW Economic Sentiment Jun | 34.5 | 25.2 |
| 09:00 | EUR | Germany ZEW Current Situation Jun | -78 | -82 |
| 09:00 | EUR | Eurozone ZEW Economic Sentiment Jun | 23.5 | 11.6 |
| 12:30 | USD | Retail Sales M/M May | -0.60% | 0.10% |
| 12:30 | USD | Retail Sales ex Autos M/M May | 0.20% | 0.10% |
| 12:30 | USD | Import Price Index M/M May | -0.20% | 0.10% |
| 13:15 | USD | Industrial Production M/M May | 0.10% | 0.00% |
| 13:15 | USD | Capacity Utilization May | 77.70% | 77.70% |
| 14:00 | USD | Business Inventories Apr | 0.00% | 0.10% |
| 14:00 | USD | NAHB Housing Market Index Jun | 35 | 34 |
| 22:45 | NZD | Current Account (NZD) Q1 | -2.19B | -7.04B |
| 23:50 | JPY | Trade Balance (JPY) May | -0.38T | -0.41T |
| 23:50 | JPY | Machinery Orders M/M Apr | -9.60% | 13% |
| GMT | Ccy | Events | |
|---|---|---|---|
| JPY | BoJ Interest Rate Decision | ||
| Forecast: 0.50% | Previous: 0.50% | ||
| 06:30 | JPY | BoJ Press Conference | |
| Forecast: | Previous: | ||
| 09:00 | EUR | Germany ZEW Economic Sentiment Jun | |
| Forecast: 34.5 | Previous: 25.2 | ||
| 09:00 | EUR | Germany ZEW Current Situation Jun | |
| Forecast: -78 | Previous: -82 | ||
| 09:00 | EUR | Eurozone ZEW Economic Sentiment Jun | |
| Forecast: 23.5 | Previous: 11.6 | ||
| 12:30 | USD | Retail Sales M/M May | |
| Forecast: -0.60% | Previous: 0.10% | ||
| 12:30 | USD | Retail Sales ex Autos M/M May | |
| Forecast: 0.20% | Previous: 0.10% | ||
| 12:30 | USD | Import Price Index M/M May | |
| Forecast: -0.20% | Previous: 0.10% | ||
| 13:15 | USD | Industrial Production M/M May | |
| Forecast: 0.10% | Previous: 0.00% | ||
| 13:15 | USD | Capacity Utilization May | |
| Forecast: 77.70% | Previous: 77.70% | ||
| 14:00 | USD | Business Inventories Apr | |
| Forecast: 0.00% | Previous: 0.10% | ||
| 14:00 | USD | NAHB Housing Market Index Jun | |
| Forecast: 35 | Previous: 34 | ||
| 22:45 | NZD | Current Account (NZD) Q1 | |
| Forecast: -2.19B | Previous: -7.04B | ||
| 23:50 | JPY | Trade Balance (JPY) May | |
| Forecast: -0.38T | Previous: -0.41T | ||
| 23:50 | JPY | Machinery Orders M/M Apr | |
| Forecast: -9.60% | Previous: 13% | ||
Wednesday, Jun 18, 2025
| GMT | Ccy | Events | Consensus | Previous |
|---|---|---|---|---|
| 01:00 | AUD | Westpac Leading Index M/M May | -0.01% | |
| 06:00 | GBP | CPI M/M May | 1.20% | |
| 06:00 | GBP | CPI Y/Y May | 3.30% | 3.50% |
| 06:00 | GBP | Core CPI Y/Y May | 3.50% | 3.80% |
| 06:00 | GBP | RPI M/M May | 1.70% | |
| 06:00 | GBP | RPI Y/Y May | 4.20% | 4.50% |
| 08:00 | EUR | Eurozone Current Account (EUR) Apr | 50.9B | |
| 09:00 | EUR | Eurozone CPI Y/Y May F | 1.90% | 1.90% |
| 09:00 | EUR | Eurozone CPI Core Y/Y May F | 2.30% | 2.30% |
| 12:30 | USD | Housing Starts May | 1.360M | 1.361M |
| 12:30 | USD | Building Permits May | 1.420M | 1.422M |
| 12:30 | USD | Initial Jobless Claims (Jun 13) | 248K | |
| 14:30 | USD | Crude Oil Inventories | -3.6M | |
| 16:00 | USD | Natural Gas Storage | 109B | |
| 18:00 | USD | Fed Interest Rate Decision | 4.50% | 4.50% |
| 18:30 | USD | FOMC Press Conference | ||
| 22:45 | NZD | GDP Q/Q Q1 | 0.70% | 0.70% |
| GMT | Ccy | Events | |
|---|---|---|---|
| 01:00 | AUD | Westpac Leading Index M/M May | |
| Forecast: | Previous: -0.01% | ||
| 06:00 | GBP | CPI M/M May | |
| Forecast: | Previous: 1.20% | ||
| 06:00 | GBP | CPI Y/Y May | |
| Forecast: 3.30% | Previous: 3.50% | ||
| 06:00 | GBP | Core CPI Y/Y May | |
| Forecast: 3.50% | Previous: 3.80% | ||
| 06:00 | GBP | RPI M/M May | |
| Forecast: | Previous: 1.70% | ||
| 06:00 | GBP | RPI Y/Y May | |
| Forecast: 4.20% | Previous: 4.50% | ||
| 08:00 | EUR | Eurozone Current Account (EUR) Apr | |
| Forecast: | Previous: 50.9B | ||
| 09:00 | EUR | Eurozone CPI Y/Y May F | |
| Forecast: 1.90% | Previous: 1.90% | ||
| 09:00 | EUR | Eurozone CPI Core Y/Y May F | |
| Forecast: 2.30% | Previous: 2.30% | ||
| 12:30 | USD | Housing Starts May | |
| Forecast: 1.360M | Previous: 1.361M | ||
| 12:30 | USD | Building Permits May | |
| Forecast: 1.420M | Previous: 1.422M | ||
| 12:30 | USD | Initial Jobless Claims (Jun 13) | |
| Forecast: | Previous: 248K | ||
| 14:30 | USD | Crude Oil Inventories | |
| Forecast: | Previous: -3.6M | ||
| 16:00 | USD | Natural Gas Storage | |
| Forecast: | Previous: 109B | ||
| 18:00 | USD | Fed Interest Rate Decision | |
| Forecast: 4.50% | Previous: 4.50% | ||
| 18:30 | USD | FOMC Press Conference | |
| Forecast: | Previous: | ||
| 22:45 | NZD | GDP Q/Q Q1 | |
| Forecast: 0.70% | Previous: 0.70% | ||
Thursday, Jun 19, 2025
| GMT | Ccy | Events | Consensus | Previous |
|---|---|---|---|---|
| 01:30 | AUD | Employment Change May | 19.9K | 89K |
| 01:30 | AUD | Unemployment Rate May | 4.10% | 4.10% |
| 06:00 | CHF | Trade Balance (CHF) May | 5.85B | 6.36B |
| 07:30 | CHF | SNB Interest Rate Decision | 0.00% | 0.25% |
| 11:00 | GBP | BoE Interest Rate Decision | 4.25% | 4.25% |
| 23:01 | GBP | GfK Consumer Confidence Jun | -20 | |
| 23:30 | JPY | National CPI Y/Y May | 3.60% | |
| 23:30 | JPY | National CPI Core Y/Y May | 3.60% | 3.50% |
| 23:30 | JPY | National CPI Core-Core Y/Y May | 3.00% | |
| 23:50 | JPY | BoJ Meeting Minutes |
| GMT | Ccy | Events | |
|---|---|---|---|
| 01:30 | AUD | Employment Change May | |
| Forecast: 19.9K | Previous: 89K | ||
| 01:30 | AUD | Unemployment Rate May | |
| Forecast: 4.10% | Previous: 4.10% | ||
| 06:00 | CHF | Trade Balance (CHF) May | |
| Forecast: 5.85B | Previous: 6.36B | ||
| 07:30 | CHF | SNB Interest Rate Decision | |
| Forecast: 0.00% | Previous: 0.25% | ||
| 11:00 | GBP | BoE Interest Rate Decision | |
| Forecast: 4.25% | Previous: 4.25% | ||
| 23:01 | GBP | GfK Consumer Confidence Jun | |
| Forecast: | Previous: -20 | ||
| 23:30 | JPY | National CPI Y/Y May | |
| Forecast: | Previous: 3.60% | ||
| 23:30 | JPY | National CPI Core Y/Y May | |
| Forecast: 3.60% | Previous: 3.50% | ||
| 23:30 | JPY | National CPI Core-Core Y/Y May | |
| Forecast: | Previous: 3.00% | ||
| 23:50 | JPY | BoJ Meeting Minutes | |
| Forecast: | Previous: | ||
Friday, Jun 20, 2025
| GMT | Ccy | Events | Consensus | Previous |
|---|---|---|---|---|
| 01:15 | CNY | 1-Y Loan Prime Rate | 3.00% | 3.00% |
| 04:30 | CNY | 5-Y Loan Prime Rate | 3.50% | 3.50% |
| 06:00 | GBP | Retail Sales M/M May | -0.50% | 1.20% |
| 06:00 | EUR | Germany PPI M/M May | -0.20% | -0.60% |
| 06:00 | EUR | Germany PPI Y/Y May | -1.20% | -0.90% |
| 06:00 | GBP | Public Sector Net Borrowing (GBP) May | 17.8B | 20.2B |
| 12:30 | CAD | Retail Sales M/M Apr | 0.50% | 0.80% |
| 12:30 | CAD | Retail Sales ex Autos M/M Apr | -0.20% | -0.70% |
| 12:30 | CAD | Raw Material Price Index May | -3% | |
| 12:30 | CAD | Industrial Product Price M/M May | -0.80% | |
| 12:30 | CAD | New Housing Price Index M/M May | -0.20% | -0.40% |
| 12:30 | USD | Philadelphia Fed Manufacturing Jun | -0.5 | -4 |
| 14:00 | EUR | Eurozone Consumer Confidence Jun P | -15 | -15 |
| GMT | Ccy | Events | |
|---|---|---|---|
| 01:15 | CNY | 1-Y Loan Prime Rate | |
| Forecast: 3.00% | Previous: 3.00% | ||
| 04:30 | CNY | 5-Y Loan Prime Rate | |
| Forecast: 3.50% | Previous: 3.50% | ||
| 06:00 | GBP | Retail Sales M/M May | |
| Forecast: -0.50% | Previous: 1.20% | ||
| 06:00 | EUR | Germany PPI M/M May | |
| Forecast: -0.20% | Previous: -0.60% | ||
| 06:00 | EUR | Germany PPI Y/Y May | |
| Forecast: -1.20% | Previous: -0.90% | ||
| 06:00 | GBP | Public Sector Net Borrowing (GBP) May | |
| Forecast: 17.8B | Previous: 20.2B | ||
| 12:30 | CAD | Retail Sales M/M Apr | |
| Forecast: 0.50% | Previous: 0.80% | ||
| 12:30 | CAD | Retail Sales ex Autos M/M Apr | |
| Forecast: -0.20% | Previous: -0.70% | ||
| 12:30 | CAD | Raw Material Price Index May | |
| Forecast: | Previous: -3% | ||
| 12:30 | CAD | Industrial Product Price M/M May | |
| Forecast: | Previous: -0.80% | ||
| 12:30 | CAD | New Housing Price Index M/M May | |
| Forecast: -0.20% | Previous: -0.40% | ||
| 12:30 | USD | Philadelphia Fed Manufacturing Jun | |
| Forecast: -0.5 | Previous: -4 | ||
| 14:00 | EUR | Eurozone Consumer Confidence Jun P | |
| Forecast: -15 | Previous: -15 | ||
The Weekly Bottom Line: Trade Tensions De-escalate Just as Geopolitical Tensions Heat-up
Canadian Highlights
- It was a relatively quiet week for economic data, with markets focused on rumors of a potential deal with the US to reduce tariffs at the upcoming G7 meeting.
- The Canadian government did announce an increase in defense spending to meet the current 2% of GDP NATO target. This spending will be incorporated into our forecast to be released next week.
- Canadian households got a little richer overall in the first quarter, with debt servicing costs remaining steady despite mortgage renewal costs making headlines recently.
U.S. Highlights
- The U.S. and China reached a tentative ‘framework’ of a trade deal on Wednesday. The U.S. administration also signaled an openness to extend the 90-day pause on reciprocal tariffs for some countries.
- WTI prices jumped by more than 6% or $4.5 per-barrel to $72.5 on Friday, following Israeli airstrikes on Iran.
- Inflationary pressures remained subdued in May, with both CPI and PPI readings coming in lower than expected, which helped to push Treasury yields lower.
Canada – Government Plays Defense as U.S. Tariffs Hit Economy
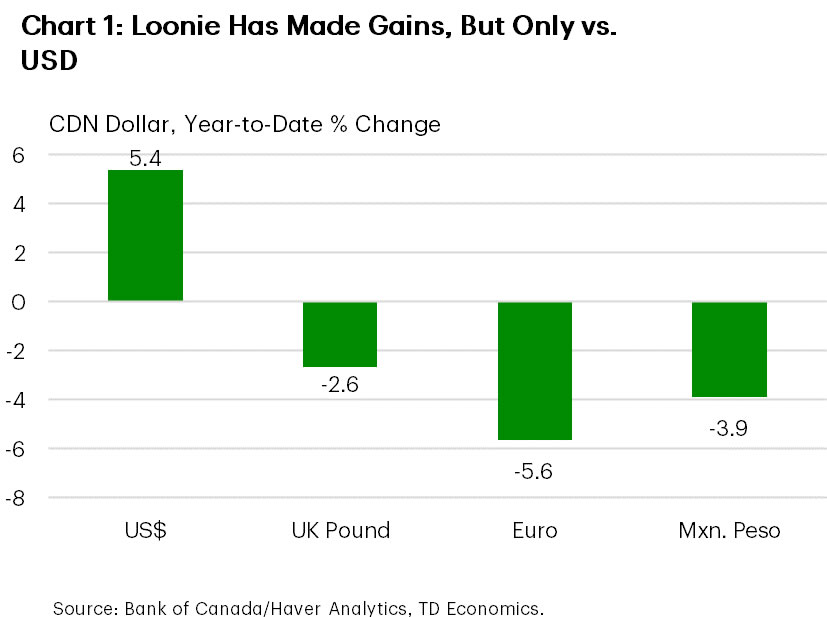
After last week’s Bank of Canada interest rate decision and May employment data, it was much quieter on the economic news front. All eyes are now focused on the G7 meeting Canada is hosting in Kananaskis starting on Sunday, and Canadians are watching closely for any rumors about a potential agreement with the U.S. on tariffs. In financial markets, it has been a good week for the Loonie which neared 74 cents U.S. But even as Israeli air strikes against Iran sent oil prices to their highest levels since January, the Loonie, a traditional beneficiary of higher oil prices, is still trailing many of its peers since the U.S. Dollar started weakening (Chart 1). For Canadians planning holidays, despite the strengthening against the U.S. Dollar, their dollars will not stretch as far as they did a few months ago at destinations in Europe, the UK or Mexico.
The Prime Minister has downplayed the likelihood of a deal with the U.S. ahead of the G7. His bigger news was announcing that Canada plans to ramp up defense spending by $9 billion (about 0.3% of GDP) this fiscal year to reach the 2% of GDP NATO target – five years earlier than the previous government. TD Economics will publish updated forecasts next week, which will include this increased spending along with some impact from the increase in nation-building infrastructure spending promised in the Throne Speech. As for defense, NATO has recently upped the ante ahead of its June meeting, proposing that member states lift spending to 5% of GDP, under a broader definition that includes “infrastructure and resilience”. This suggests some of the increased infrastructure spending could be defense-enabling. But we will likely need to wait until the fall budget to learn more.
April data on manufacturing and wholesale sales out this week corroborated what the international trade data had already shown, that U.S. tariffs are hitting activity hard. We expect Canada’s economy was thrown into reverse in the second quarter, so tariff relief can’t come soon enough.
There was some good economic news from households this week. Canadians got a little richer, with net worth rising 0.8% in the first quarter (quarter-on-quarter, q/q). The gain in net worth came as households contained their pace of borrowing to only 0.4% q/q, while their financial assets grew by 0.9%. Households slowed their accumulation of all types of debt, despite interest rate cuts from the Bank of Canada.
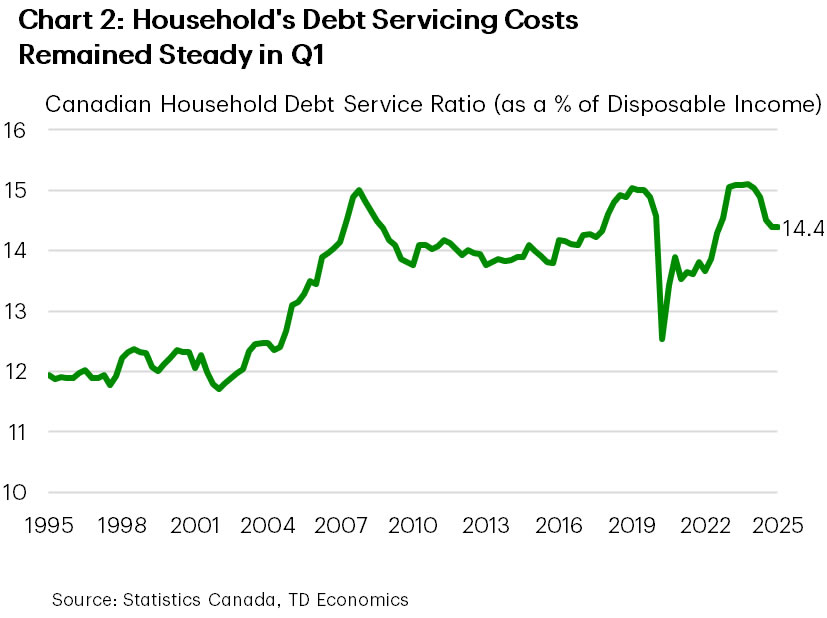
Higher costs of mortgage renewals have been making headlines recently, so it is important to note that the economy-wide household cost of debt servicing remained steady at 14.4% of disposable income, still down from its post-pandemic highs (Chart 2). Borrowing rates have come down, so new loans are costing less than a few quarters ago. The modest pace in overall borrowing growth also helps to offset some of impact from the increased costs for mortgage renewals, offering the economy a bit of a reprieve from the trade driven headwinds.
U.S. – Trade Tensions De-escalate Just as Geopolitical Tensions Heat-up
A further de-escalation in trade tensions came this week, with the U.S. and China announcing on Wednesday that they had reached a ‘framework’ of a trade deal. That same day, Treasury Secretary Scott Bessent signaled an openness to extend the administration’s current 90-day pause on reciprocal tariffs beyond July 9th for those countries who are ‘negotiating in good faith’. While the combined announcements helped to provide a temporary lift to equity markets, a further escalation in geopolitical tensions in the Middle East on Thursday evening sent shockwaves through global financial markets, pushing the S&P 500 modestly lower on the week. Oil prices shot higher by $4.5 per-barrel, with WTI currently trading at an 18-week high of $72.5. Meanwhile, cooler readings on CPI and PPI for the month of May, alongside healthy demand in 10-and-30-year Treasury auctions helped to pressure term-yields 10-15 basis points lower on the week, with the 10-year currently sitting at 4.38%.
At this point, details of the U.S.-China trade deal remain limited. Based on what media outlets have reported, China has agreed to lift export restrictions on magnets and rare earth minerals, both of which are critical components in the production of electric vehicles, semiconductors and military equipment. In exchange, the U.S. has agreed to lift its ban on Chinese students but did not remove the export restrictions on high-end semiconductors. Moreover, the agreed framework did not alter the existing tariffs imposed by either country. As it currently stands, the U.S. effective tariff rate on China is around 40%, well off the post-Liberation Day peak of 155%, but still elevated by historical standards. And with trade levies on most other countries sitting around 10-12%, that puts today’s U.S. effective tariff rate at around 15%, which remains an ongoing concern for investors.
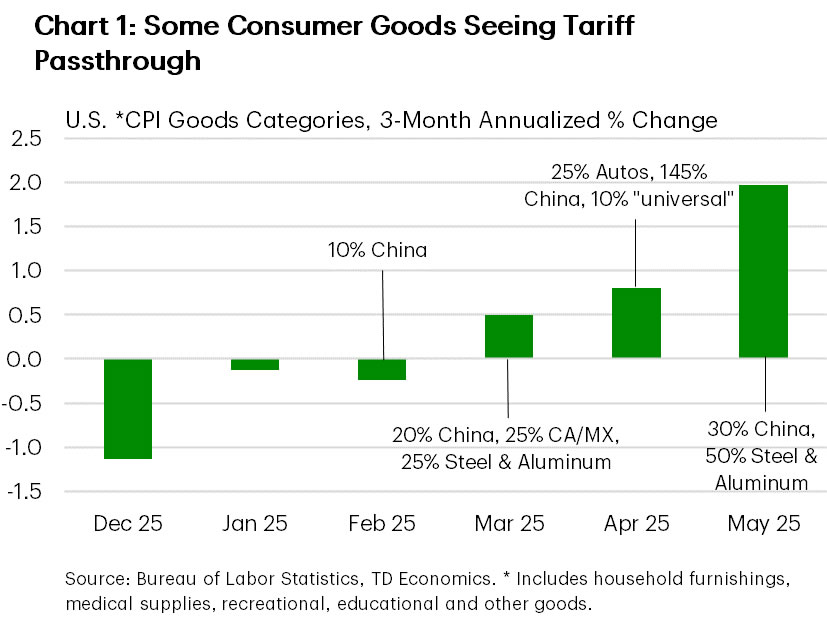
Encouragingly, broader price pressures in the economy remain subdued. May’s CPI inflation print came in on the softer side, as both goods and services prices rose by less than expected. Tariff related impacts remained minimal, though there was some evidence of price passthrough in home furnishings, recreational goods and medical supplies (Chart 1). But inflation is a lagging indicator, and with the bulk of the tariffs coming into effect between March and May, it’s still too soon to see a meaningful shift in pricing behavior. Moreover, the inventory stockpiling that occurred immediately following the tariff announcements has likely been another factor keeping the price gains at bay.
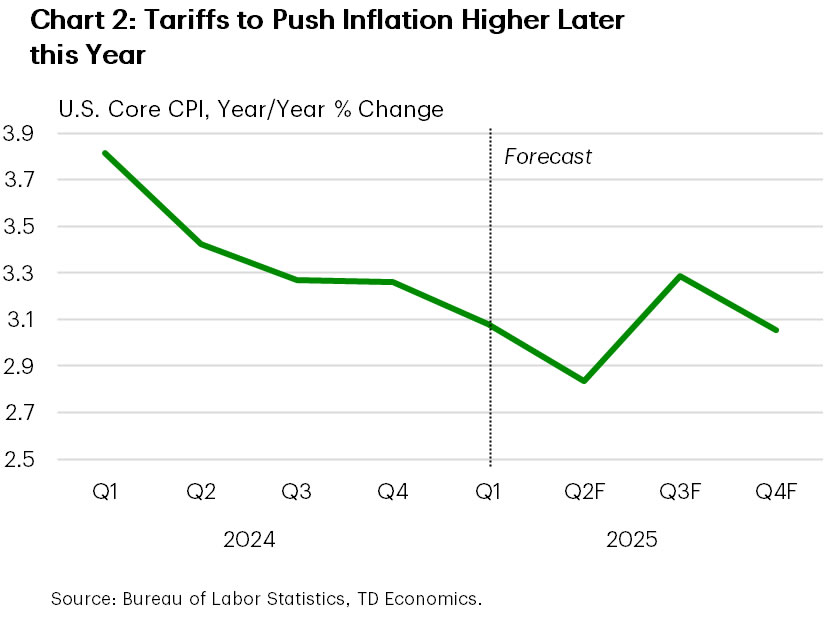
But that doesn’t mean they’re not coming. Over the coming months, inventory restocking will expose more firms to the tariffs, squeezing profit margins and leading to some price increases for consumer goods. Even assuming a mild passthrough to prices, where goods prices increase by just 3.5% by year-end, would likely be enough to push core measures of inflation up to the 3%-3.5% range over the coming quarters (Chart 2).
We’ll hear from the Federal Reserve next week, where it’s widely expected that they’ll keep the policy rate unchanged and continue to communicate a ‘wait-and-see’ approach. But investors will parse every word change of the statement and Powell’s press conference for signs of whether the recent softening in inflation has nudged policymakers any closer to reducing its policy rate.
Weekly Economic & Financial Commentary: Few Signs of Tariff Inflation
Summary
United States: Few Signs of Tariff Inflation
- This week was all about prices, and thus far, the expected tariff-induced inflation pickup has yet to appear in the hard data. Both consumer and producer price growth came in cooler than expected in May with only hints of tariff-related price pressures in specific categories. It is still the early innings, however, and we expect price growth to accelerate as the year progresses.
- Next week: Retail Sales (Tue.), Industrial Production (Tue.), Housing Starts (Wed.)
International: Market Fixation on Inflation Nation
- This week, we got price and wage data from a variety of advanced and emerging economies. In the United Kingdom, wage growth eased slightly but remains somewhat elevated, and we maintain our outlook for gradual Bank of England easing. Norway's inflation report was somewhat mixed. In Latin America, Mexico's inflation ticked up slightly, price growth in Brazil remains elevated but did ease more than expected, and Colombia's inflation also slowed more than expected.
- Next week: China Industrial Production and Retail Sales (Mon.), Brazil Selic Rate (Wed.), Bank of England Policy Rate (Thu.)
Interest Rate Watch: June Flashlight for the FOMC Blackout Period
- Despite the ongoing tumult around trade policy, the near-term outlook for monetary policy is steady-as-she-goes. We expect the FOMC to leave the federal funds rate unchanged at its meeting next week and signal that monetary policy remains in a holding pattern.
Topic of the Week: The Shifting Immigration Landscape
- A recent pullback in immigrant workers appears to be weighing on labor force growth. Assuming that population growth simmers alongside a slower pace of new foreign-born entrants, the breakeven pace of nonfarm payroll growth would fall from 150K per month to 90K.
U.S. Fed to Holds Rates as Canada’s Retail Sales Show Resilience amid Tariffs
The U.S. Federal Reserve is widely expected to forego an interest rate cut again on Wednesday. The central bank has been on pause since December after cutting the fed funds rate by 100 basis points in the second half of 2024.
Policymakers will likely maintain a cautious approach given high levels of uncertainty about the impact of the ongoing trade war on growth and inflation. U.S. labour markets have shown signs of gradual cooling this year, and inflation surprised to the downside in April and May.
We continue to expect the Fed will ultimately cut interest rates later this year (starting in September), but for now remains in a wait and see mode—assessing the risk that elevated tariffs could eventually weigh more heavily on growth, but also push inflation higher.
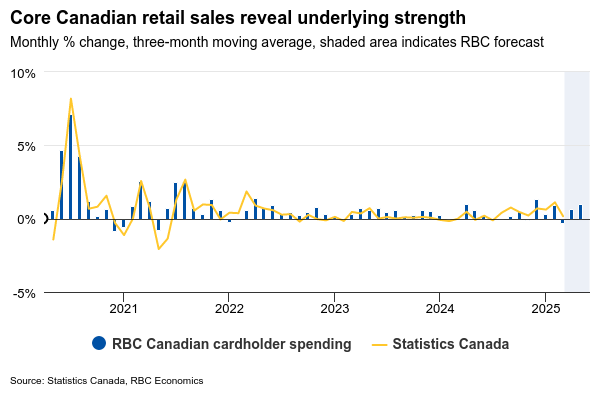
In Canada, Friday’s April retail sales will be closely watched for further signs that consumer spending is outperforming a sharp pullback in consumer confidence surveys this spring. Statistics Canada’s advance retail indicator for April showed pre-tax sales rose by 0.5%, building on a solid 0.8% gain in March. Those gains have been consistent with our RBC Canadian cardholder spending tracker, pointing to further strength in May.
Auto sales pulled back in April and May, but only partially reversed a jump in March (by our count) when buyers rushed to purchase cars ahead of threatened auto tariffs. Core retail sales, which exclude volatile components like gasoline and auto spending, remained relatively resilient in both months, according to our estimates, further hinting at underlying strength in consumer demand.
But, even with these encouraging near term trends, we expect household consumption to slow during the second half of the year. Despite the de-escalation of tariff rhetoric over the past month, persistent uncertainty continues to weigh on consumer confidence, which remains near historic lows even with May’s marginal rebound.
Moving forward, we anticipate consumers will likely remain cautious about big-ticket purchases, such as autos and homes, as ongoing uncertainty about tariff policies continue to dampen buyer sentiment.
Week ahead data watch
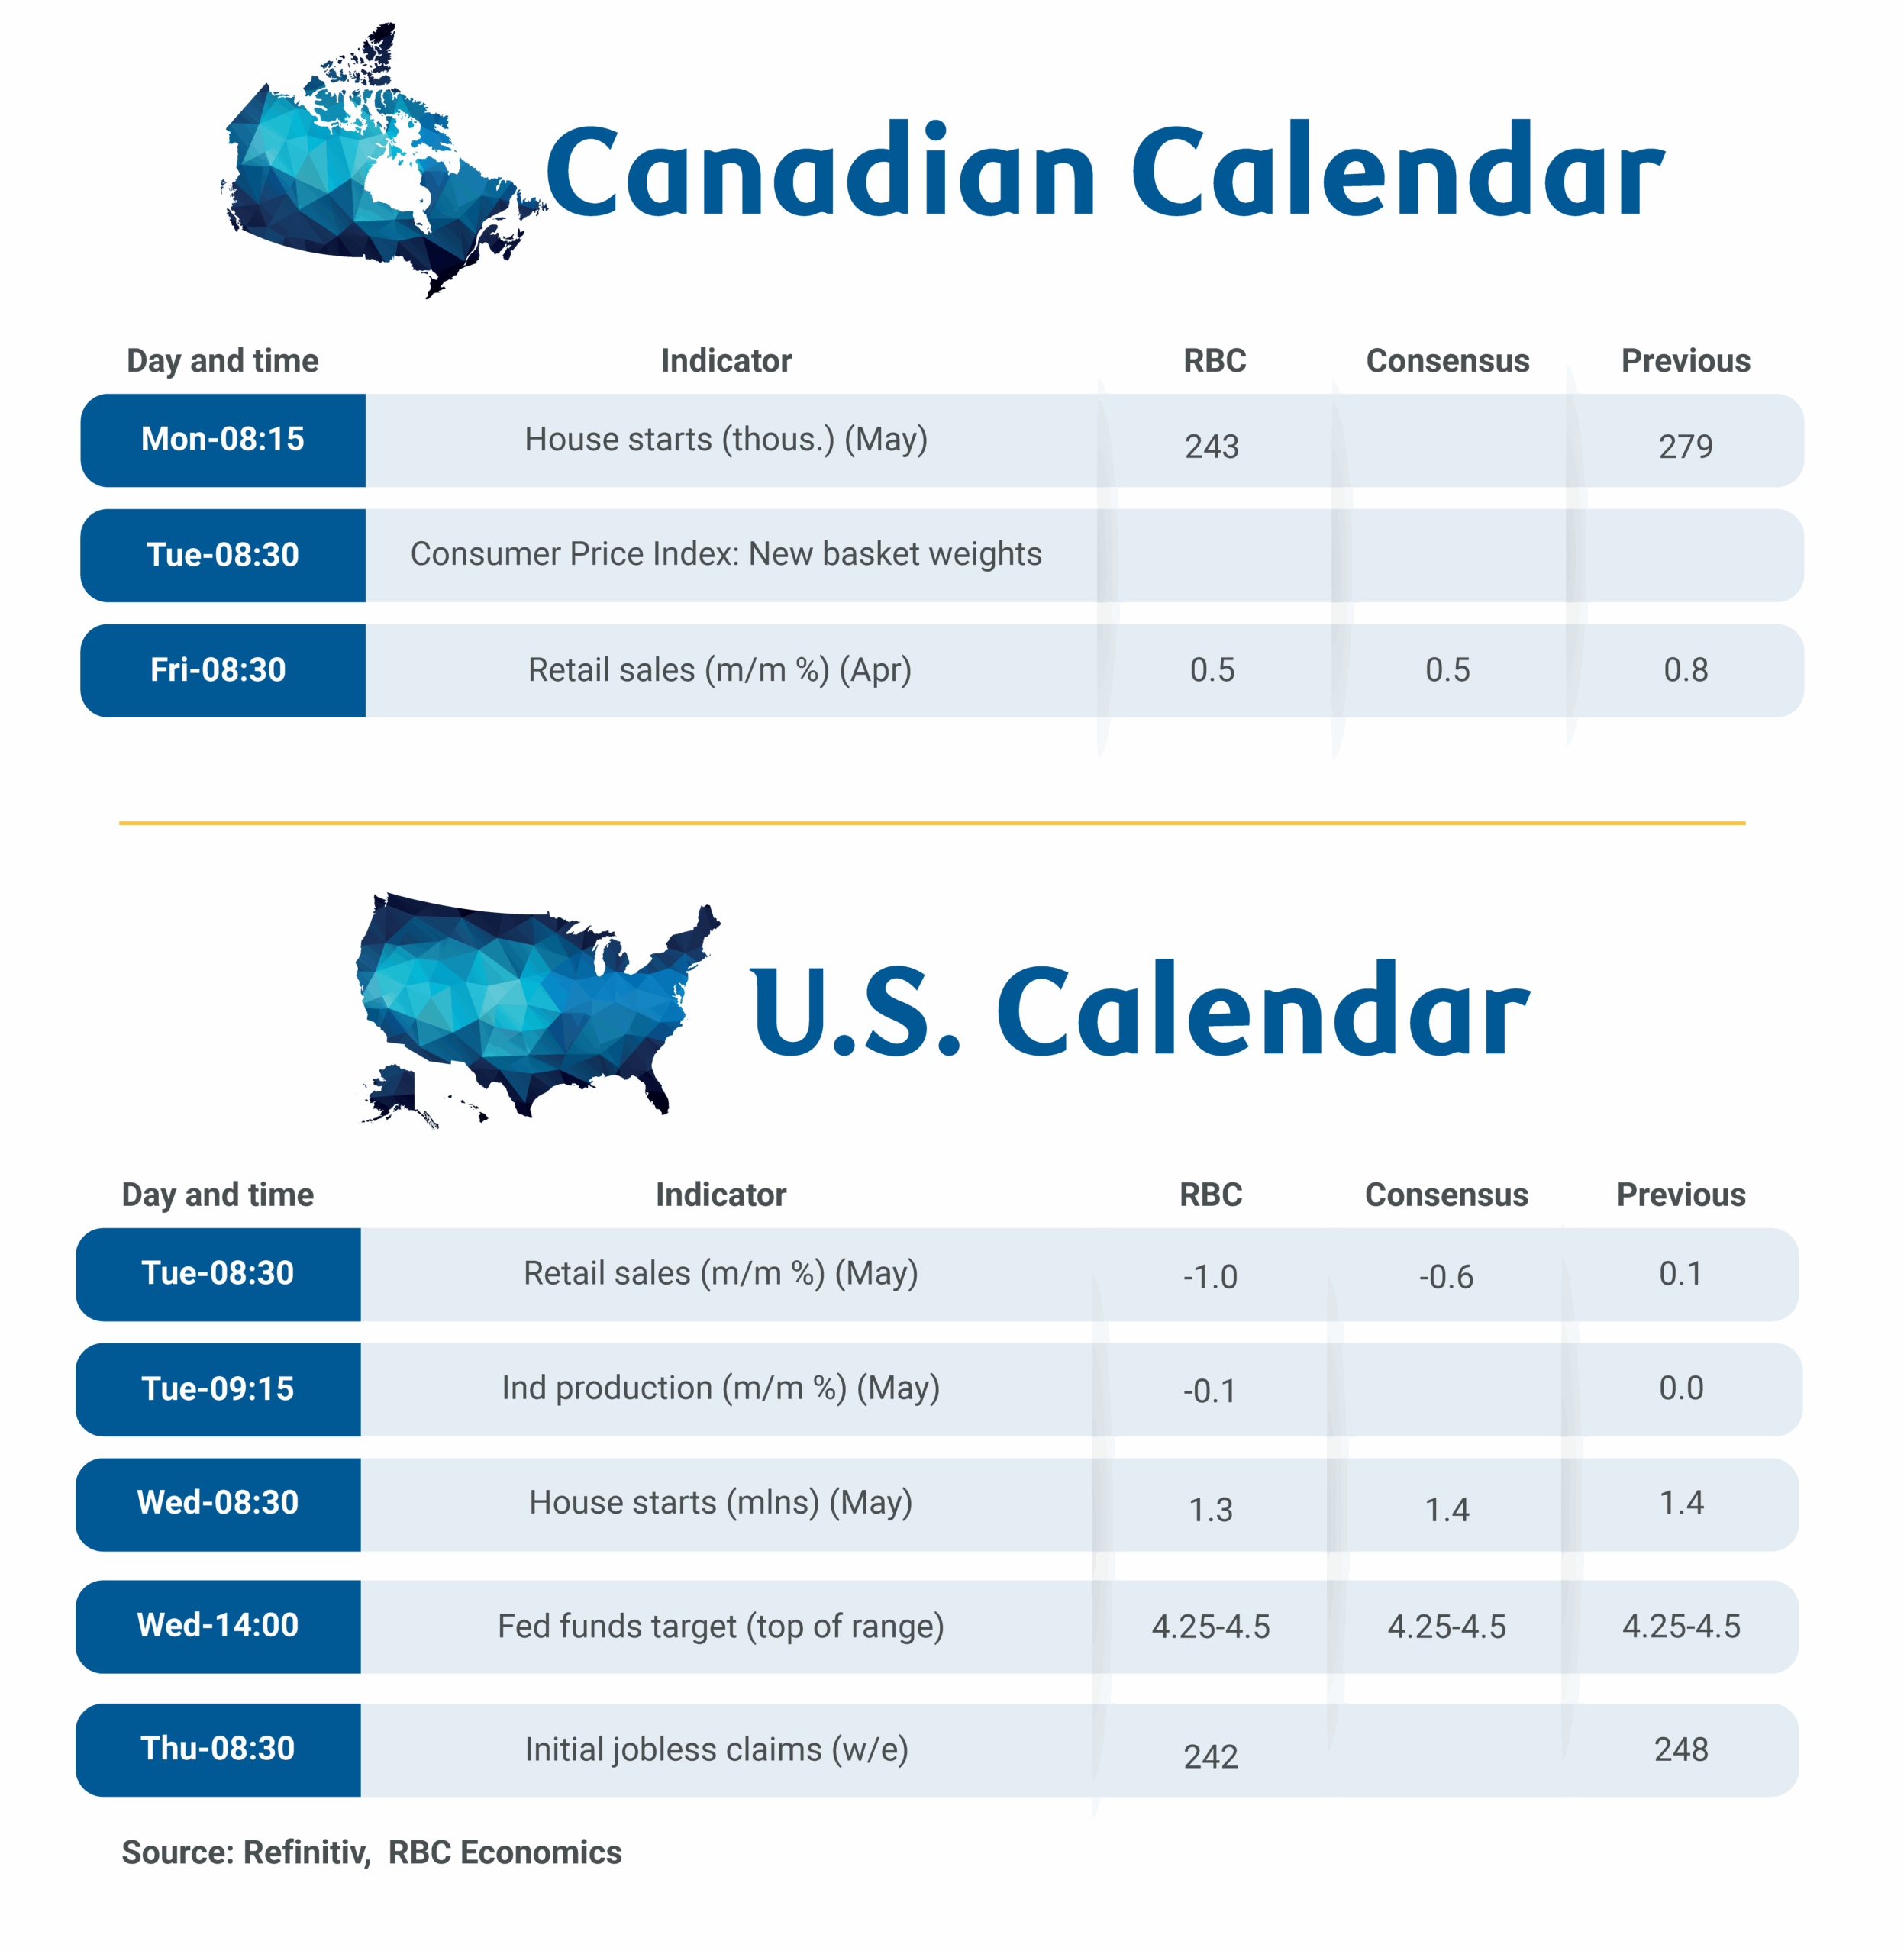
We expect May Canadian housing starts to pull back to 243,000-a 12.8% decline that would partially retrace a 30% surge in April.
U.S. retail sales likely fell by 1% in May following strong performance in April and a small uptick in March. Unit auto sales dropped another 9% in May on top of a 3% decline in the previous month, while lower-priced gas station sales further slowed headline sales. Meanwhile, control group sales likely inched up by 0.1%, insufficient to offset the 0.2% decline observed in the previous month.
Gold Ready to Update All-Time Highs
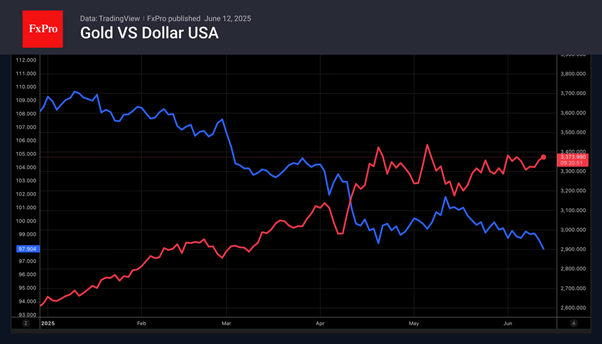
The insatiable appetite of central banks has resulted in an increase in the share of gold value in reserves to 20%. Precious metals have surpassed the euro’s 16% share. Only the US dollar is ahead with 46%. In 2022-2024, regulators increased their purchases to more than 1,000 tonnes annually. As a result, their combined gold reserves grew to 36,000 tonnes by the end of last year. They are now very close to the record set in 1965 of 38,000 tonnes.
The weakening of the US dollar and falling Treasury yields support the gold price. The reluctance of US inflation to accelerate under the influence of tariffs and the cooling of the economy increases the risks of resuming the Fed’s monetary expansion cycle as early as September. Until recently, the futures market has not been pricing a rate cut until October.
Geopolitics is playing in favour of the precious metal. Gold is a safe-haven asset and proved with its performance last night. Demand for it is growing as the risks of a new conflict in the Middle East increase. The future fate of the precious metal will depend on the resistance test at $3,400 per ounce.