
Sample Category Title
EUR/USD Rallies Past 1.1500 as USD Tumbles on Fresh Tariff Threat
The relief that the US and China may have reached some kind of agreement that could relax Chinese exports of rare earth metals to the US—in exchange for allowing more Chinese students to study at US universities, was short-lived, as many sticky points remain uncertain beyond these cited concessions. Trump apparently expects the tariffs to stay as they were set in Geneva, meaning 10% on US exports to China and 55% on Chinese exports to the US, while there’s no news regarding US technology exports to China. In summary, it looks like the US got what it wanted in the critical rare earth area, but China is walking away from the table with little more than a few student visas... I don’t think this smells good.
Even less so, as there are rumours that the EU will hardly ink a deal before the July deadline, and Trump has threatened other Asian nations with fresh tariffs, saying his administration will send letters within two weeks to inform them of unilateral tariffs as a pressure tactic. US Treasury Secretary Bessent, on the other hand, suggested that they could extend the deadline by 90 more days if they believe “good faith” efforts are being made.
So, optimism is waning. The Hang Seng Index is down after yesterday’s peak, the Nikkei is trading lower, the CSI 300 is flat, stocks in Australia are showing toppish signs near February highs, while US and European futures all point to a bearish start today.
Yesterday, the S&P 500 advanced to a fresh high since February after the US CPI update printed weaker-than-expected inflation numbers on both a monthly and yearly basis. That fueled dovish Federal Reserve (Fed) expectations and sent the US 2-year yield lower, boosting stock valuations. The 10-year yield also eased to 4.40% following a relatively strong 10-year bond auction. But the post-CPI rally was short-lived as investors quickly moved to the sidelines ahead of today’s much-watched 30-year bond auction, which could—maybe—remind investors about the US’ exploding and unsustainable debt levels.
But if today’s auction goes well, there’s a chance that US debt concerns ease—yes, yes, markets are not always rational. And easing debt worries, if not accompanied by souring trade headlines, could support equities. A weak auction, on the other hand, could revive debt concerns, send long-term yields higher, and weigh on mood—especially alongside wobbly trade headlines.
USD tumbles
The US dollar is significantly lower following the CPI release and renewed tariff and debt concerns. The EURUSD finally cleared the 1.15 offers and is consolidating above that level, while CAble is back above the 1.35 mark. Reeve’s announcement of spending details had little market impact— no surprise is a good surprise, here. The USDJPY is breaking below its 50-DMA support on broad USD weakness, while gold is up for a second session as the yellow metal regains safe-haven demand amid waning trade optimism.
Good news from tech
Oracle jumped 7.5% in after-hours trading on a set of better-than-expected quarterly results and a bullish AI-driven outlook. The company said its Cloud Infrastructure revenue rose 52% year-on-year and is expected to grow over 70% in fiscal 2026. Capex is projected to exceed $21 billion in fiscal 2025—up sharply from under $7 billion the prior year—highlighting that AI investments remain undeniably strong.
Nvidia, a major barometer of AI investments, topped near the $145 per share level yesterday and should feel the positive momentum from supportive AI news—and more! Because Jensen Huang is paving the way toward a potentially massive new revenue stream: quantum computing. Speaking in Paris yesterday, he said the industry is reaching an inflection point and could already help ‘solve some interesting problems’ in the coming years, marking a notable shift from his previous stance in January that useful quantum computers were probably ‘decades away.’ That day, he sent quantum stocks tumbling. Yesterday, he sent some of them rallying. Quantum Computing Inc. jumped more than 25%, though not all names held onto their gains. Defiance’s Quantum ETF ended the day slightly lower, after hitting a fresh all-time high. Still, the pace remains exciting for tech investors.
Back to Nvidia: their chips could support quantum tech, and their entire quantum algorithm stack will reportedly be available and accelerated on the Grace Blackwell 200 chip, writes Bloomberg. Huang also said Europe’s computing capacity will grow tenfold over the next two years and announced a partnership with France’s Mistral AI to build an AI cloud together. Nasdaq’s Europe Tech Index hit a fresh high yesterday.
US Inflation Subdued Defying Tariff-Driven Fears
In focus today
This afternoon, US May PPI will provide markets with further sense of tariff-driven cost pressures. Yesterday's lower-than-expected CPI report showed that firms have remained cautious with passing through the rising costs. Read more in Global Inflation Watch - Price pressures moderated in May despite the trade war, 11 June.
In Norway, the Q2 Regional survey will be published today. Growth picked up sharply in Q1 and was much stronger than expected by the respondents in the regional survey from March. However, the postponement of rate cuts, global trade tensions and a gradual decline in oil investments may have dampened expectations. Hence, we expect that growth expectations for the next quarter are roughly unchanged at around 0.4%, which should be in line with Norges bank's expectations from the Monetary policy report in March.
In Sweden, we will receive the PES unemployment data this morning. The labor market has shown signs of improvement, suggesting that the worst may be behind us.
Economic and market news
What happened overnight
Trade negotiations are set to advance, as Trump announced plans to send letters to trading partners within the next week or two outlining specific unilateral tariffs and telling countries what the deal is. As the tariff pause nears expiry, Trump expressed willingness to extend the deadline beyond 8 July to finalise trade discussions with 18 significant trading partners, including India, South Korea, Japan, and the EU. Yesterday, Trump posted that he had made a deal with China under which rare earth minerals would flow again, and tariff rates will be 10% on the US and 55% on China. However, the tariff numbers do not add up since tariff rates do not seem to have been part of the negotiations this time around and thus have not changed compared to mid-May. The actual rates are probably around 40% on China and 15-20% on the US when including all tariffs, including the ones imposed in the first trade war and under Biden.
What happened yesterday
In the US, May inflation figures fell short of expectations, with headline inflation rising only marginally by 0.1% m/m compared to April, against consensus of 0.2%. Aggregate inflation edged up to 2.4% y/y, slightly below expected 2.5%. Despite soaring consumer inflation expectations, inflation has been slow to react to Trump's tariffs, exerting only modest pressure on consumer prices. Core inflation remained stable at 2.8% y/y, contrary to predictions of a slight increase to 2.9% y/y. Overall, it was a soft print suggesting that underlying inflation remains weak, prompting the market to respond with lower rates and a weaker USD.
Equities: Equity markets fell yesterday, despite receiving a clearly positive data surprise in the form of a softer-than-expected US CPI report. Initially, equities responded positively to the inflation numbers, but sentiment turned in the evening amid renewed geopolitical tensions. The rotation in market leadership reflects this shift: defensives outperformed cyclicals, while the standout sector was energy, rising 1.2% in global benchmarks and 1.5% in the US. In the US yesterday, Dow 0.0%, S&P 500 -0.3%, Nasdaq -0.5%, Russell 2000 -0.4%. Overnight, Asian equities are trading slightly lower, while European futures are down close to 1% and US equity futures are also pointing lower.
FI and FX: Soft US CPI triggered a sharp decline in Treasury yields and broad-based USD weakness. Both yields and the USD took another leg lower while equity futures went red after President Trump announced plans to set unilateral tariff rates within two weeks. US10Y at 4.40% vs 4.50% prior to the CPI. EUR/USD above 1.15 for the first time since April and USD/JPY back at 144. USD/Scandies dropped ten figures while EUR/SEK and EURNOK were stable around 10.97 and 11.56, respectively.
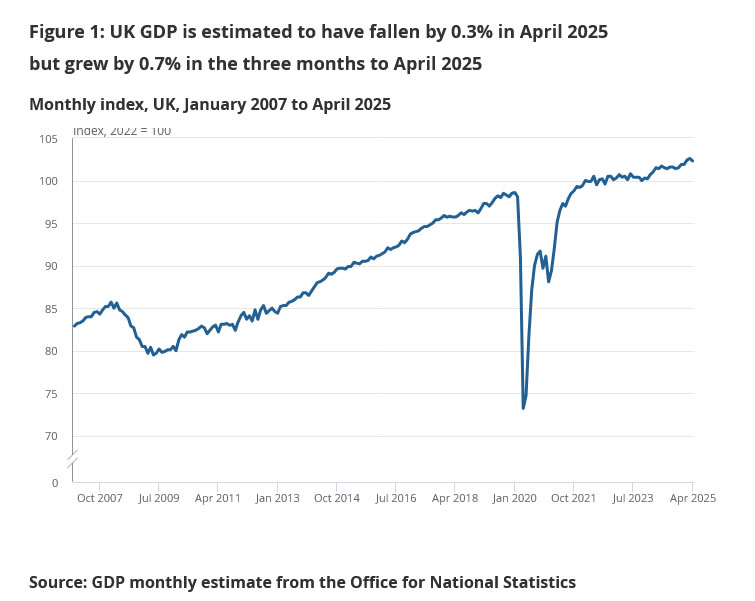
UK GDP contracts -0.3% mom in April, as services drag
The UK economy contracted -0.3% mom in April, a sharper decline than the expected -0.1%. The main drag came from the services sector, which fell -0.4% mom and contributed most to the monthly GDP drop. Production also shrank -0.6% mom. In contrast, construction provided a rare bright spot, rising 0.9% mom, though not enough to offset broader weakness.
Despite the poor April print, the broader picture remains more constructive. GDP expanded 0.7% in the three months to April compared to the prior three-month period, with services up 0.6%, production up 1.1%, and construction up 0.5%.
EUR/USD Daily Outlook
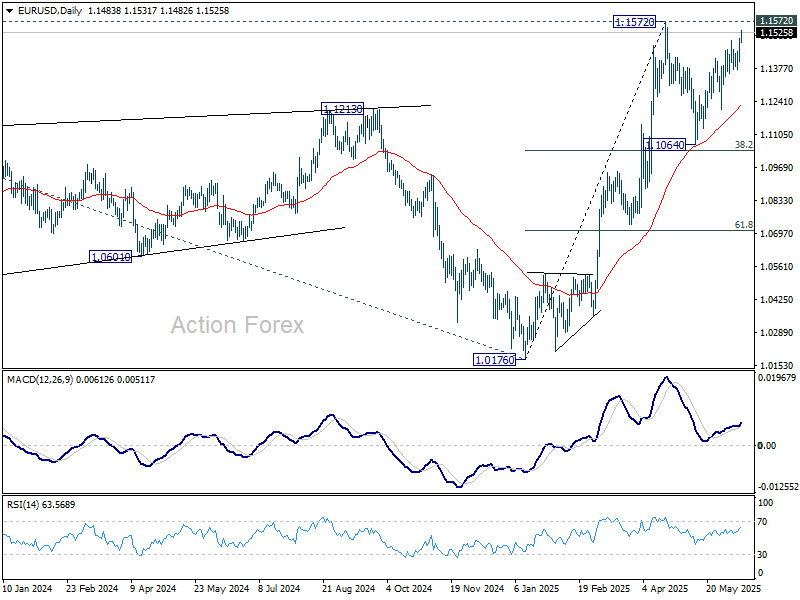
Daily Pivots: (S1) 1.1429; (P) 1.1465; (R1) 1.1524; More...
EUR/USD's rise from 1.1064 resumed by breaking through 1.1494 and intraday bias is back on the upside for 1.1572 high. Strong resistance could be seen there to bring another fall, to extend the near term consolidation pattern. Firm break of 1.1404 support will turn intraday bias back to the downside for 1.1209 first. However, decisive break of 1.1572 will resume whole rise from 1.0176.
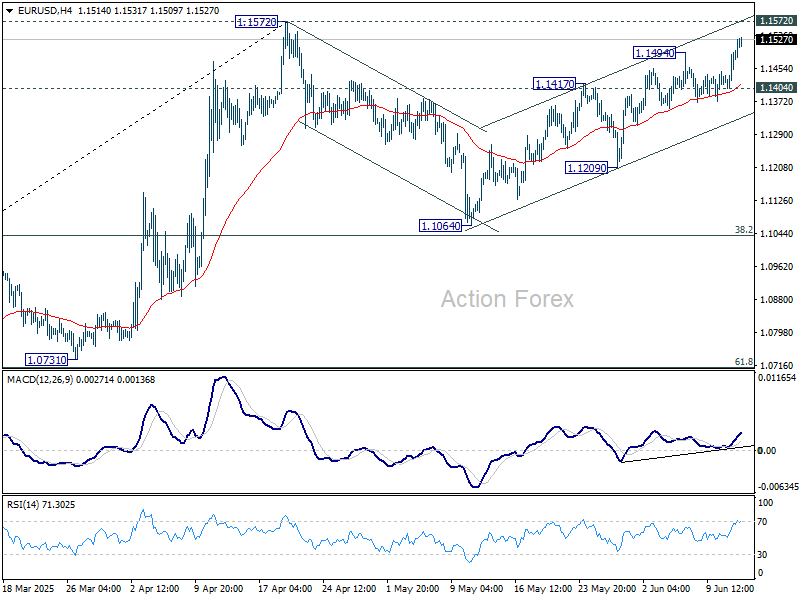
In the bigger picture, rise from 0.9534 long term bottom could be correcting the multi-decade downtrend or the start of a long term up trend. In either case, further rise should be seen to 100% projection of 0.9534 to 1.1274 from 1.0176 at 1.1916. This will now remain the favored case as long as 55 W EMA (now at 1.0894) holds.
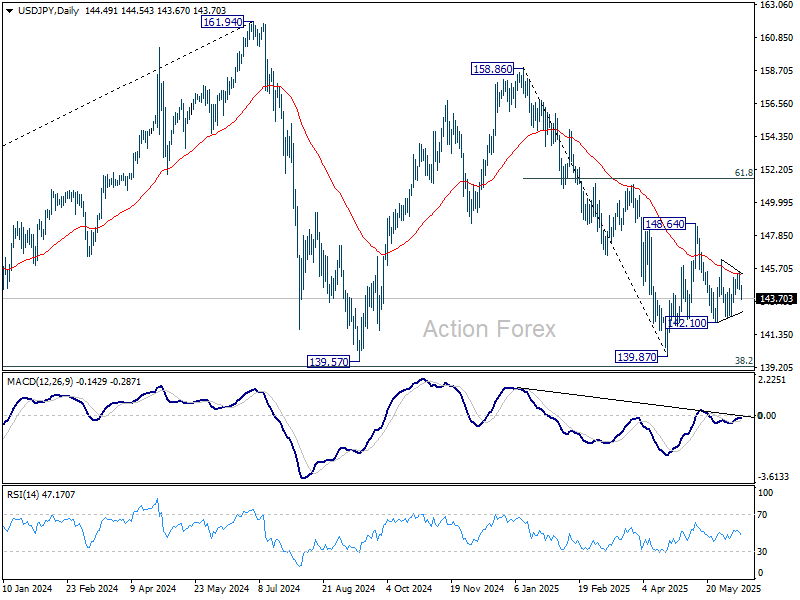
USD/JPY Daily Outlook
Daily Pivots: (S1) 144.13; (P) 144.80; (R1) 145.27; More...
Intraday bias in USD/JPY stays neutral as range trading continues. On the upside, above 146.27 resistance will argue that price actions from 148.64 has completed as a corrective pattern. Intraday bias will be back on the upside for 148.64 resistance and above to resume the rebound from 139.87 low. However, firm break of 142.10 will bring retest of 139.87 instead.
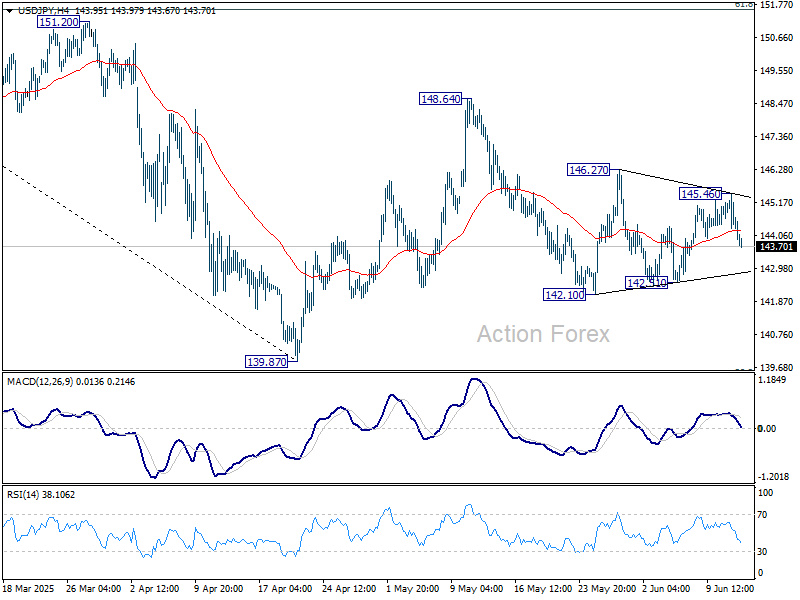
In the bigger picture, price actions from 161.94 are seen as a corrective pattern to rise from 102.58 (2021 low), with fall from 158.86 as the third leg. Strong support should be seen from 38.2% retracement of 102.58 to 161.94 at 139.26 to bring rebound. However, sustained break of 139.26 would open up deeper medium term decline to 61.8% retracement at 125.25.
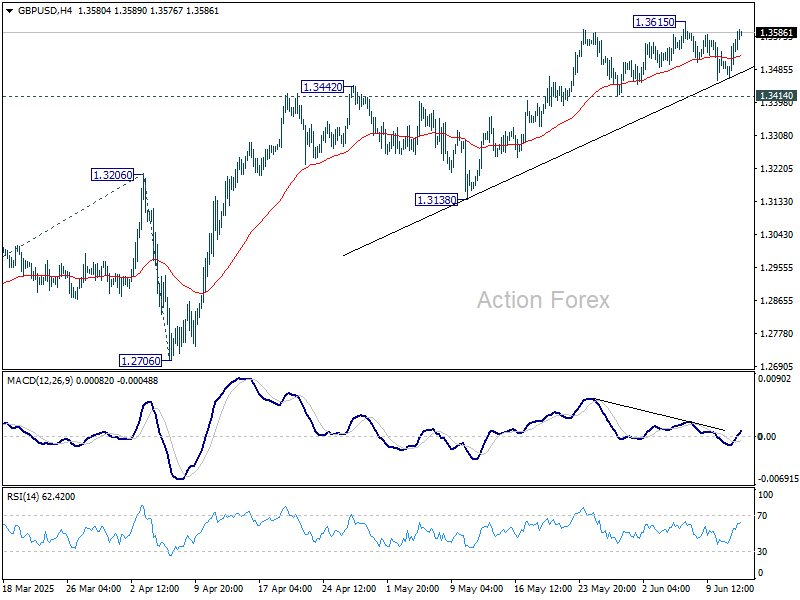
GBP/USD Daily Outlook
Daily Pivots: (S1) 1.3486; (P) 1.3526; (R1) 1.3589; More...
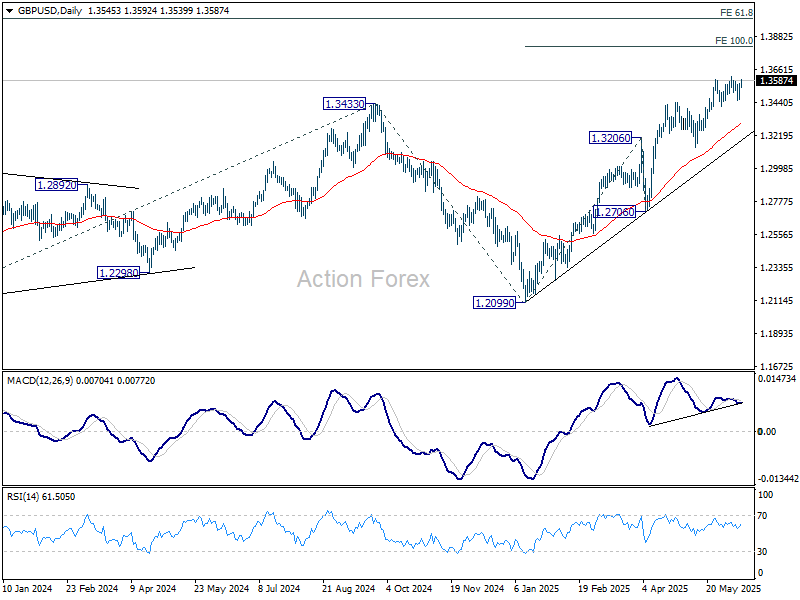
GBP/USD is still bounded in range below 1.3615 and intraday bias remains neutral. With 1.3414 support intact, further rally remains in favor. On the upside, break of 1.3615 will resume the rally from 1.2099 and target 100% projection of 1.2099 to 1.3206 from 1.3138 at 1.3813. On the downside, break of 1.3414 support should confirm short term topping, and bring deeper correction to 55 D EMA (now at 1.3300) instead.
In the bigger picture, up trend from 1.3051 (2022 low) is in progress. Next medium term target is 61.8% projection of 1.0351 to 1.3433 from 1.2099 at 1.4004. Outlook will now stay bullish as long as 55 W EMA (now at 1.2913) holds, even in case of deep pullback.
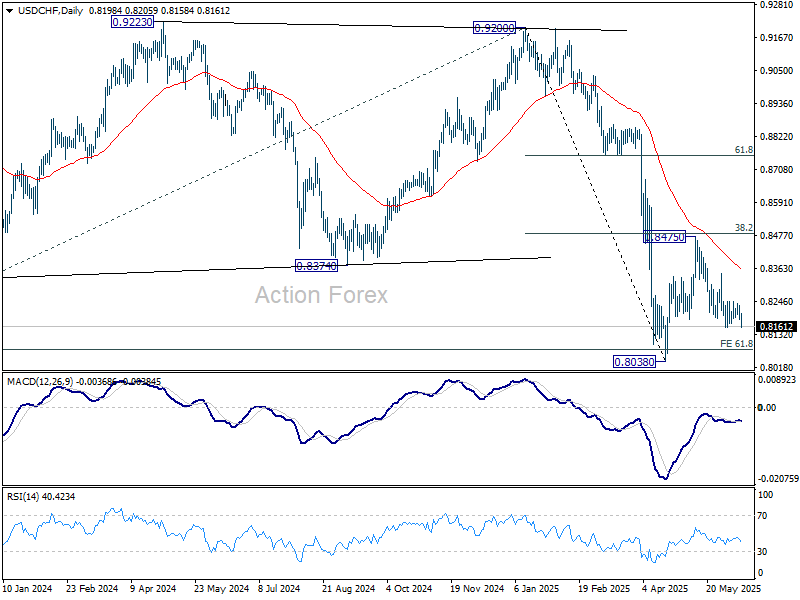
USD/CHF Daily Outlook
Daily Pivots: (S1) 0.8180; (P) 0.8209; (R1) 0.8234; More….
Immediate focus is now on 0.8156 support in USD/CHF with current fall. Firm break there would resume the decline from 0.8475 to retest 0.8038 low. Strong support could be seen there to bring rebound to extend the near term consolidation pattern. On the upside, above 0.8247 resistance will turn bias to the upside for 0.8346 resistance first.
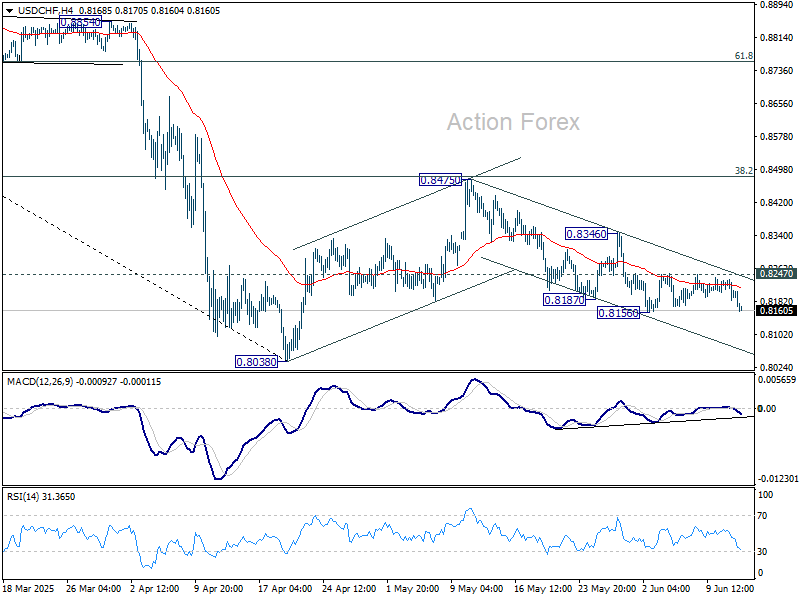
In the bigger picture, long term down trend from 1.0342 (2017 high) is still in progress and met 61.8% projection of 1.0146 (2022 high) to 0.8332 from 0.9200 at 0.8079 already. In any case, outlook will stay bearish as long as 55 W EMA (now at 0.8696) holds. Sustained break of 0.8079 will target 100% projection at 0.7382.
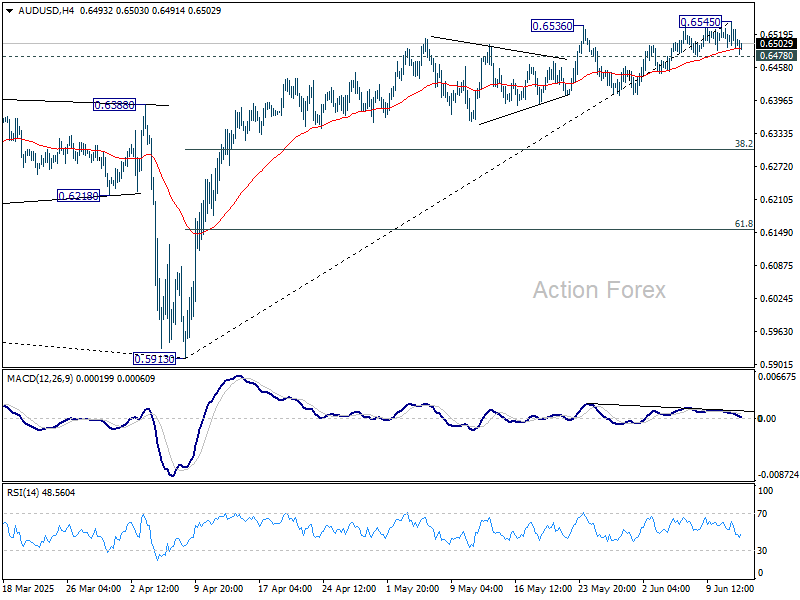
AUD/USD Daily Report
Daily Pivots: (S1) 0.6483; (P) 0.6514; (R1) 0.6533; More...
AUD/USD quickly lost momentum after edging higher to 0.6545 and intraday bias is turned neutral again. Considering bearish divergence condition in 4H MACD, break of 0.6478 support will turn bias back to the downside for 55 D EMA (now at 0.6413) and possibly below. On the upside, firm break of 0.6545 will resume larger rally from 0.5913 to 61.8% retracement of 0.6941 to 0.5913 at 0.6548.
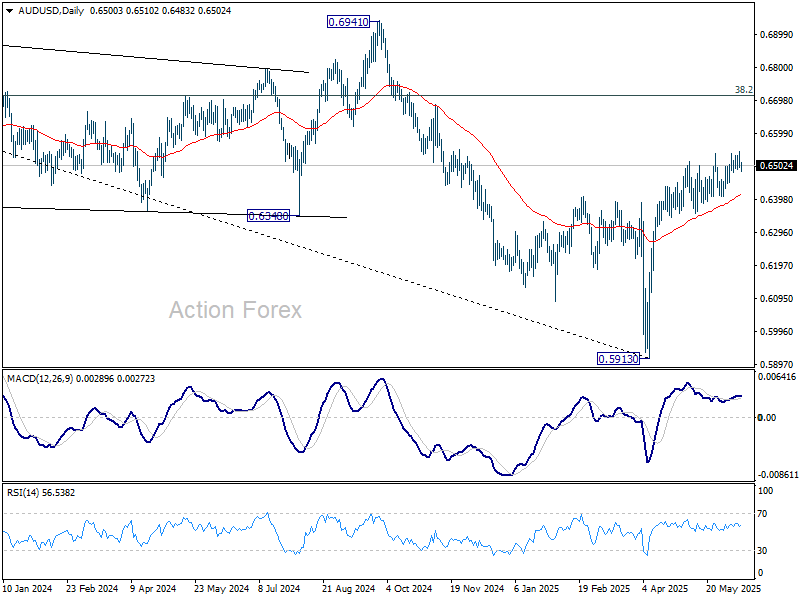
In the bigger picture, AUD/USD is still struggling to sustain above 55 W EMA (now at 0.6443) cleanly, and outlook is mixed. Sustained trading above 55 W EMA will indicate that rise from 0.5913 is at least correcting the down trend from 0.8006 (2021 high), with risk of trend reversal. Further rise should be seen to 38.2% retracement of 0.8006 to 0.5913 at 0.6713. However, rejection by 55 W EMA will revive medium term bearishness for another fall through 0.5913 at a later stage.
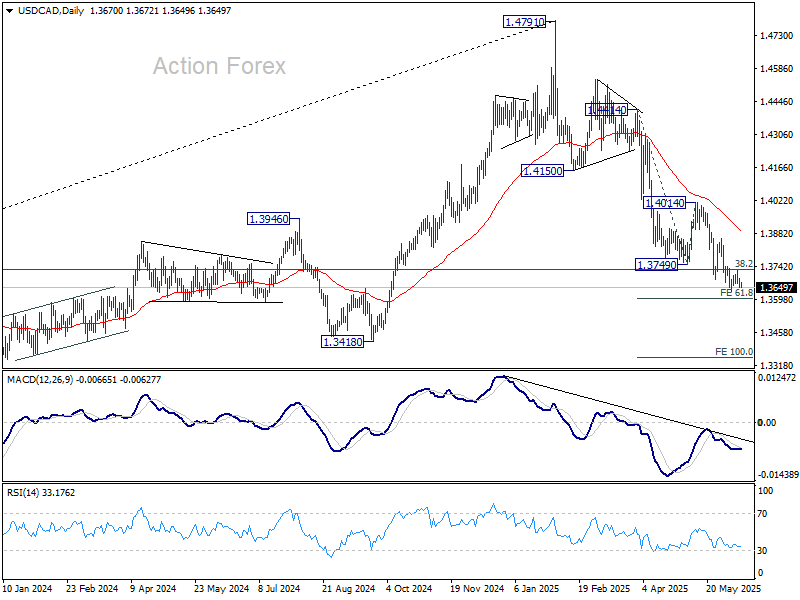
USD/CAD Daily Outlook
Daily Pivots: (S1) 1.3651; (P) 1.3671; (R1) 1.3691; More...
USD/CAD is still bounded in established range above 1.3633 and intraday bias stays neutral. Considering bullish convergence condition in 4H MACD, firm break of 1.3741 will indicate short term bottoming at 1.3633. Intraday bias will turn back to the upside for stronger rebound to 1.4014 resistance, as a correction to fall from 1.4791. Nevertheless, decisive break of 61.8% projection of 1.4414 to 1.3749 from 1.4014 at 1.3603 will pave the way to 100% projection at 1.3349.
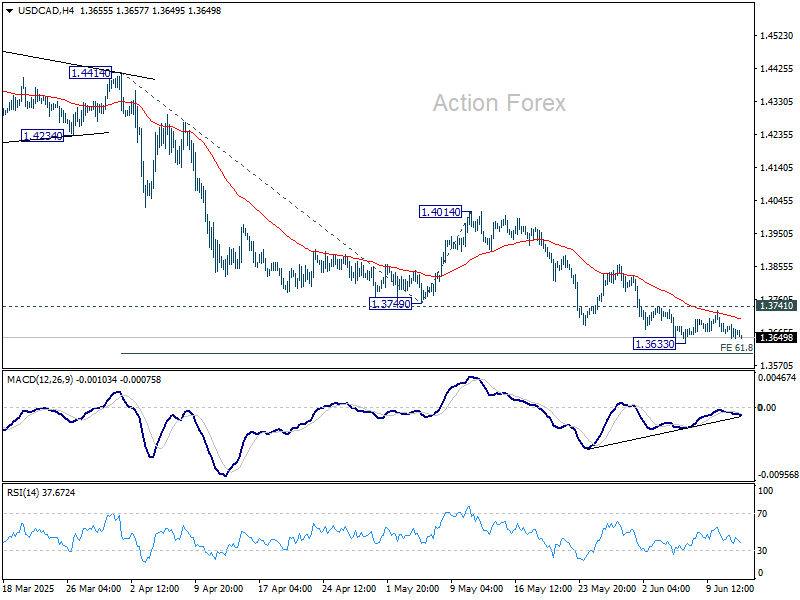
In the bigger picture, price actions from 1.4791 medium term top could either be a correction to rise from 1.2005 (2021 low), or trend reversal. In either case, further decline is expected as long as 1.4014 resistance holds. Firm break of 38.2% retracement of 1.2005 (2021 low) to 1.4791 at 1.3727 will pave the way back to 61.8% retracement at 1.3069.
Japanese business confidence sours amid tariff fears and profit warnings
Business sentiment in Japan deteriorated sharply in Q2, with the Ministry of Finance’s survey revealing a broad-based loss of confidence across industries.
The overall index for large firms slipped into negative territory at -1.09, down from Q1’s modest 2.0. Large manufacturers saw sentiment weaken further from -2.4 to -4.8, while large non-manufacturers experienced a steep drop from 5.2 to -5.7, suggesting that economic uncertainty is spreading beyond export-heavy sectors.
The survey also highlighted a growing sense of earnings pessimism. Large manufacturers now expect recurring profits to decline -1.2% in the fiscal year ending March 2026, a downgrade from the -0.6% fall seen in the previous survey. Particularly alarming is the auto sector's outlook, with automakers and parts suppliers projecting a severe -19.8% drop in profits.
This highlights the mounting concern over the impact of steep US tariffs, which threaten to hit Japan’s flagship export industry hard and weigh on broader economic momentum.