Sample Category Title
GBPAUD Slips Below Bearish Cross of Short-Term SMAs
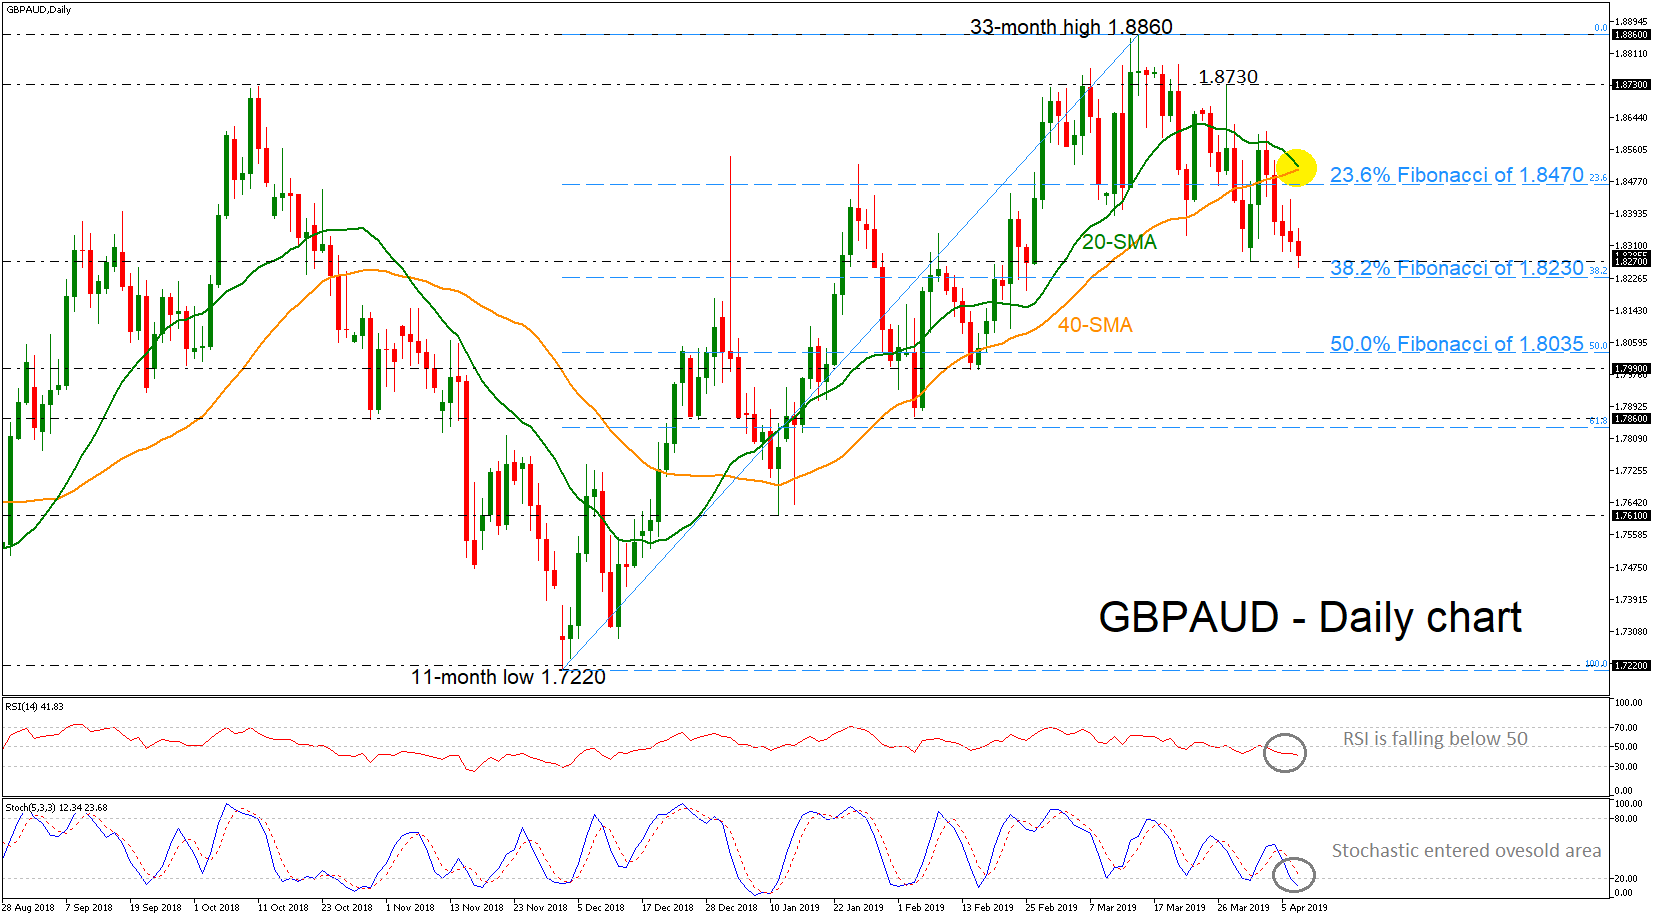
GBPAUD extended the last four days’ losses and is currently trading not far above a six-week low around the 38.2% Fibonacci retracement level of the upward movement from 1.7220 to 1.8860.
The RSI turned lower after entering the 50 level and it continues to head lower in support of a negative short-term picture. The bias in the very-short-term also looks bearish as indicated by the stochastics: the %K and %D lines are negatively aligned and are both moving further down.
Further declines may meet support near the 38.2% Fibonacci before edging lower towards the 50.0% Fibonacci region of 1.8035. Not far below, support could occur around the 1.7990 hurdle.
On the upside, resistance could come around the 23.6% Fibonacci of 1.8470, while next the price could flirt with the bearish cross within the 20- and 40-simple moving averages (SMAs) currently at 1.8500 in the daily chart. Higher still, the 1.8730 would increasingly come into scope.
The medium-term picture looks predominantly bullish, however, a slip until the 50.0% Fibonacci could change the outlook to a more neutral one.
EUR/USD Mid-Day Outlook
Daily Pivots: (S1) 1.1222; (P) 1.1249; (R1) 1.1287; More.....
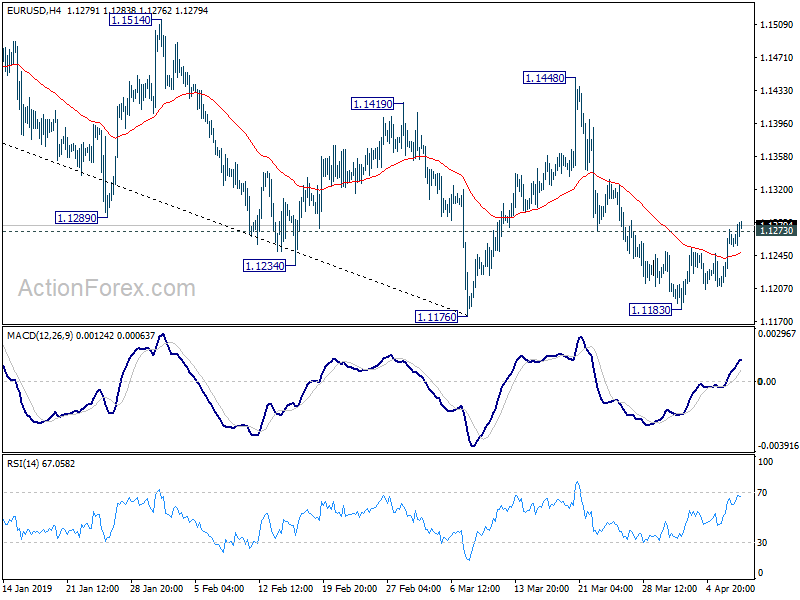
EUR/USD's rebound from 1.1183 extends today. Break of 1.1273 minor resistance suggests short term bottoming at 1.1183, just ahead of 1.1176 low. Intraday bias is now on the upside for 55 day EMA (now at 1.1311) first. Break will target 1.1448 resistance next. For now, we'd expect strong resistance between 1.1448/1569 to limit upside. On the downside, decisive break of 1.1176 will resume the down trend from 1.2555.
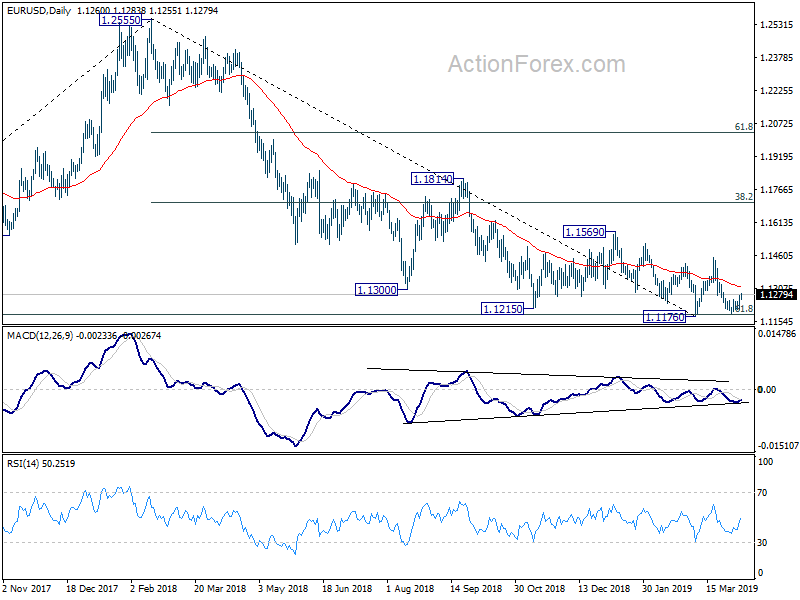
In the bigger picture, medium term weakness was revived as the weak rebound from 1.1176 was rejected well below 55 week EMA and failed to sustain above 55 day EMA. Focus is back on 1.1176 low, with 61.8% retracement of 1.0339 (2016 low) to 1.2555 (2018 high) at 1.1186. Decisive break there will resume whole down trend from 1.2555. Such decline target 1.0339 low next. On the upside, firm break of 1.1569 resistance is needed to be the first sign of medium term bottoming. Otherwise, downside breakout will be in favor.
Trump’s Threat of US-EU Trade War Sends Dollar, Yield and Stocks Lower
Dollar suffers new round of selling in early US session after Trump confirmed his intention to escalate trade war with the EU with his tweet. DOW opens sharply lower and is down -190pts at the time of writing. US 10-year yield also suffers as investors turn cautious again, breaking through 2.5 handle. Germany 10-year yield also turns negative again. Sterling is the second weakest but again staying in range as markets await more Brexit developments. Yen is the strongest one for now, followed by Australian Dollar.
Technically, EUR/USD finally breaks 1.1273 minor resistance to indicate short term bottoming. Further rise is now in favor back to 1.1448 resistance. USD/JPY also breaks 111.18 minor support, which suggests short term topping. Deeper fall could be seen to 109.71 support and possibly below. While AUD/USD is a strong one, it's limited well below 0.7168 resistance though. And upside could be capped if risk-off mode is turned on during the US session.
In Europe, currently, FTSE is down -0.21%. DAX is down -0.65%, CAC is down -0.34%. German 10-year yield is down -0.017 at -0.006. Earlier in Asia, Nikkei rose 0.19%. Hong Kong HSI rose 0.27%. China Shanghai SSE dropped -0.16%. Singapore Strait Times rose 0.3%. Japan 10-year JGB yield rose 0.0015 to -0.044.
EU may prefer long Brexit delay, but purpose is still required
UK Prime Minister Theresa May meets German Chancellor Angela Merkel in Berlin and will fly to Paris for French President Emmanuel Macron later in the day. May is expected to seek backing from the two leaders on her request for article 50 extension till June 30.
Meanwhile, it's reported that there is growing preference in EU for a longer extension till December 31, 2019 or even March 2020. But even so, UK will be required to give specific plan attached to the extension. And as EU chief Brexit negotiator Michel Barnier told reporters, "the duration of an extension has got to be in line with or linked to the purpose of such an extension, and that is something I can imagine Mrs May will be telling the leaders tomorrow as well".
Trump confirms intention to escalate trade war with EU
Trump confirmed his intention to escalate tariff war with EU. In a tweet, he echoed the US Trade Representative statement that WTO found EU subsidies to Airbus has "adversely impacted" the US. He also blamed that "EU has taken advantage of the U.S. on trade for many years." And the US will "now put tariffs on $11 billions of EU products".
In a statement published yesterday, US Trade Representative said WTO repeated found that EU subsidies to Airbus have "caused adverse effects" to the US, with harm in USD 11B in trade each year. USTR has begun Section 301 process to identify EU products to tariff, until EU removes Airbus subsidies. A preliminary list of products are identified for public comment. The list includes products ranging from large commercial aircraft and parts to dairy products and wine, from helicopters to some motorcycles.
USTR Robert Lighthizer said: "Our ultimate goal is to reach an agreement with the EU to end all WTO-inconsistent subsidies to large civil aircraft. When the EU ends these harmful subsidies, the additional U.S. duties imposed in response can be lifted."
Airbus: WTO to determine the amount, not by US exaggerations
Airbus spokesman Rainer Ohler criticized the US has "no legal basis" take action against EU on its subsidies. "Necessary measures" has been take to comply with "relatively minor elements" following the May 2018 WTO report. Additionally, Ohler said the USD 11B amount the US claimed was :"largely exaggerated" and should be "defined by the WTO", not the US.
French Finance Minister Bruno Le Maire said "When I see the situation global growth is in, I don't think we can afford to have a trade conflict even if only on the specific issues of the aircraft industry in the United States and Europe."
EU said to be preparing retaliation tariffs on Boeing subsidies
But Reuters reported, based on unnamed source, EU believed US measures was "greatly exaggerated" and the amount of retaliation could only be determined by a WTO arbitrator. Meanwhile, EU is preparing for possible retaliation over subsidies for Boeing. The source noted "in the parallel Boeing dispute, the determination of EU retaliation rights is also coming closer and the EU will request the WTO-appointed arbitrator to determine the EU's retaliation rights."
Moody's downgrades Australia house price forecasts, nationwide to fall -7.7% in 2019
Rating agency Moody's dramatically downgrades Australia house prices forecasts. Weak household consumption, compounded by low wages growth were among the factors. Even though house prices are expected to bottom in Q3, further credit tightening and changes to negative gearing could extend and deepen the decline.
For the whole nation through 2019, house prices are forecast to drop -7.7%, down from January projection of -3.0%. For Sydney, house prices could drop -9.3%, down from January projection of -3.3%. For Melbourne, how price could drop -11.4%, down from January forecast of -5.0%.
Separately, Australian number of of owner occupier housing finance approvals ex-refi rose 0.8% mom in February, above expectation of 0.5% mom.
EUR/USD Mid-Day Outlook
Daily Pivots: (S1) 1.1222; (P) 1.1249; (R1) 1.1287; More.....
EUR/USD's rebound from 1.1183 extends today. Break of 1.1273 minor resistance suggests short term bottoming at 1.1183, just ahead of 1.1176 low. Intraday bias is now on the upside for 55 day EMA (now at 1.1311) first. Break will target 1.1448 resistance next. For now, we'd expect strong resistance between 1.1448/1569 to limit upside. On the downside, decisive break of 1.1176 will resume the down trend from 1.2555.
In the bigger picture, medium term weakness was revived as the weak rebound from 1.1176 was rejected well below 55 week EMA and failed to sustain above 55 day EMA. Focus is back on 1.1176 low, with 61.8% retracement of 1.0339 (2016 low) to 1.2555 (2018 high) at 1.1186. Decisive break there will resume whole down trend from 1.2555. Such decline target 1.0339 low next. On the upside, firm break of 1.1569 resistance is needed to be the first sign of medium term bottoming. Otherwise, downside breakout will be in favor.
Economic Indicators Update
| GMT | Ccy | Events | Actual | Forecast | Previous | Revised |
|---|---|---|---|---|---|---|
| 23:01 | GBP | BRC Sales Monitor Y/Y Mar | -1.10% | -0.90% | -0.10% | |
| 1:30 | AUD | Home Loans M/M Feb | 0.80% | 0.50% | -1.20% | |
| 5:45 | CHF | Unemployment Rate Mar | 2.40% | 2.40% | 2.40% |
EUR/GBP – Three Days Until Brexit, Again
Biggest week yet for Brexit, until the next one
Brexit drama may be ramping up and desperation kicking in, but traders remain in quite a relaxed mood as we navigate through another hugely important week in the process.
May has gone on the charm offensive to Germany and France today as she attempts to win around the EU’s two most important leaders to her extension plan, leaving her willing deputies at home to continue negotiations with the Labour Party which forms the basis of the PMs justification.
The cynic in me continues to think that the talks between May’s team and Labour is just for the cameras, with both sides keen to be seen doing everything to avoid no deal Brexit and deliver on the referendum result, while convincing the EU to agree to only a short extension.
Scaring hard-line Brexiteers that are yet to back the PM into falling into line could be the cherry on top of the cake, although this could still not be enough. An extension is inevitable though, it’s just a question of how long the EU will give May to get Parliament’s backing.
As mentioned earlier, traders seem very chilled about the whole situation, despite being only three days from no-deal. Of course, this is highly likely to be avoided but it remains the default until an extension is agreed.
EURGBP Daily Chart
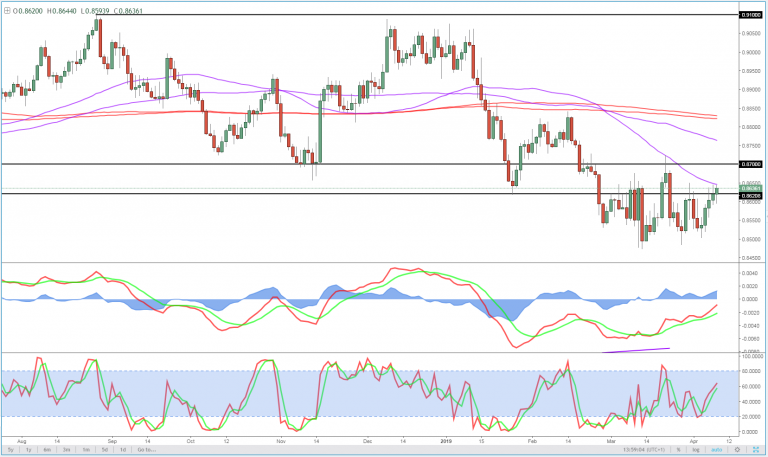
EURGBP remains at the upper end of the range it’s traded within for the last month or so, a sign that nerves aren’t entirely absent from the process. There’s no evidence that no deal is in any way priced in though – which is understandable given the UK Parliament’s strong opposition to it – but that means there is potential for a severe shock to the upside.
It’s interesting that on the last couple of occasions when sterling has rallied, we’ve failed to make new lows in the pair which could suggest it’s a little oversold. Perhaps even an extension won’t be enough to get a positive response in sterling, given that this looks quite priced in. Profit taking on an extension wouldn’t be a huge surprised given the confidence sterling bulls have displayed recently, although the terms of it may determine the response.
EURGBP 4-Hour Chart
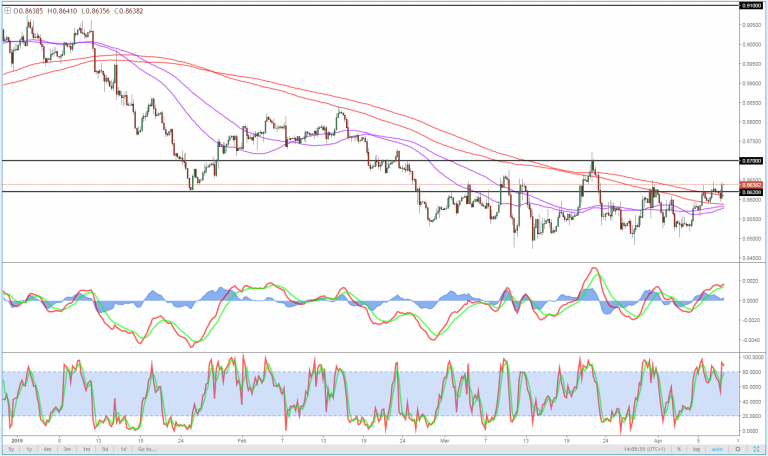
A break above the 200/233 simple moving moving average on the 4-hour chart below may be indicative of traders becoming more bullish ahead of the deadline. We did break above here a few weeks ago, which turned out to be a false breakout, but for most of the year so far – since breaking below early January – it’s been reliable resistance. A clean break this time with some confirmation could therefore be a good bullish signal. A break and close above 0.87 would provide a further strong bullish signal.
Trump confirms intention to escalate trade war with EU
Trump confirmed his intention to escalate tariff war with EU. In a tweet, he echoed the USTR statement that WTO found EU subsidies to Airbus has "adversely impacted" the US.
He also blamed that "EU has taken advantage of the U.S. on trade for many years." And the US will "now put tariffs on $11 billions of EU products".
https://twitter.com/realDonaldTrump/status/1115578769518018560
Into US session: Swiss Franc weakest on oil and gold strength, Aussie strongest
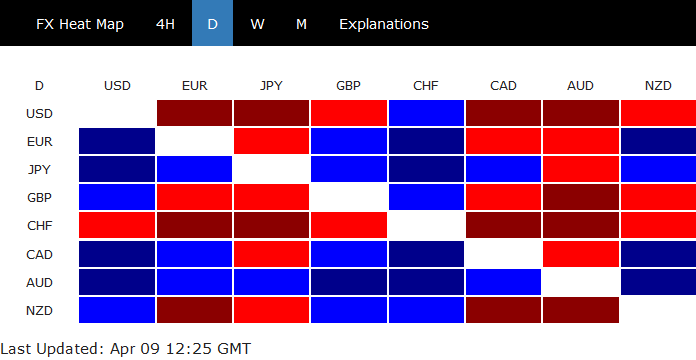
Entering into US session, Swiss Franc is trading as the weakest one for today despite mixed risk sentiments as seen in the stock markets. Rebound in gold and persistent rally in oil could be the factors that reduce safe haven demand for the Franc. Dollar is following as the second weakest, reacting negatively to news that Trump is going to escalate global trade war again by considering to impose new tariffs on EU products.
On the other hand, Australian Dollar is the strongest one, followed by Yen and Canadian. Rally in iron oil price is a factor lifting the Aussie. Meanwhile, there remains optimism that the worst in China slowdown is over, even though more data is needed to secure this view.
Sterling is mixed in range as UK Prime Minister Theresa May is in Berlin visiting German Chancellor Angela Merkel. There are speculations that EU prefers to give a relatively longer Brexit delay till end of 2019 or even March 2020. It's perceived that UK will need more time to sort out what it really wants. In any case, for a short extension till June 30, May will be required to convince EU leaders that she has a plan to get the withdrawal agreement through the Parliament. And so it remains unlikely.
In Europe, currently:
- FTSE is up 0.01%.
- DAX is down -0.27%.
- CAC is up 0.01%.
- German 10-year yield is down -0.0078 at 0.003, staying positive.
Earlier in Asia:
- Nikkei rose 0.19%.
- Hong Kong HSI rose 0.27%.
- China Shanghai SSE dropped -0.16%.
- Singapore Strait Times rose 0.3%.
- Japan 10-year JGB yield rose 0.0015 to -0.044.
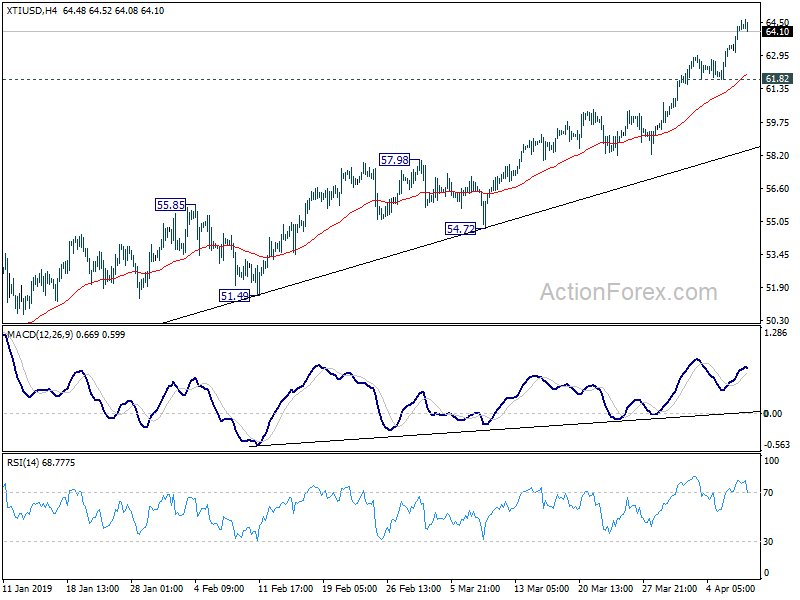
WTI crude oil hits as high as 64.64 and outlook remains bullish as long as 61.82 support holds.
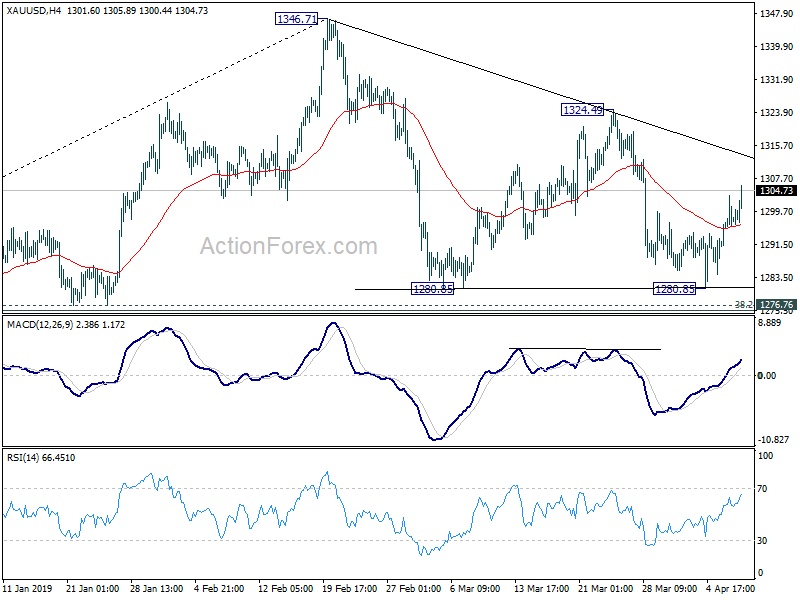
Gold's rebound from 1280.85 is in progress fro 1324.49 resistance.
Higher Oil Prices Boosts CAD to 3-Week High
The Canadian dollar has posted slight losses on Tuesday, after starting the week with considerable gains. Currently, USD/CAD is trading at 1.3295, down 0.15% on the day. On the release front, there are no Canadian releases on the schedule. In the U.S., the highlight is JOLTS Jobs Openings, which is expected to drop to 7.54 million. On Wednesday, the U.S. releases consumer inflation data. CPI is expected to improve to 0.3% and Core CPI is projected to climb to 0.2%. As well, the FOMC releases the minutes of the March policy meeting.
On Wednesday, the spotlight will be on the Federal Reserve, which releases the minutes of the March meeting. At the meeting, the Fed said it would start tapering the reduction of its balance sheet in May. This marks a loosening of policy, and comes in response to weaker economic data out of the U.S. in recent months. The minutes should be treated as a market-mover, and if investors don’t like what they hear, risk apprehension could jump and send the Canadian dollar lower.
The Canadian economy has been affected by the trade war between the U.S. and China, especially the manufacturing and export sectors. With talks between the two super-economies continuing, there is optimism that China and the U.S. will reach a deal, and that could boost the Canadian dollar. There were reports last week that an agreement is 90% complete, with the remaining issues including enforcement mechanisms and the removal of trade tariffs.
USDJPY Triple Top Pattern Forming
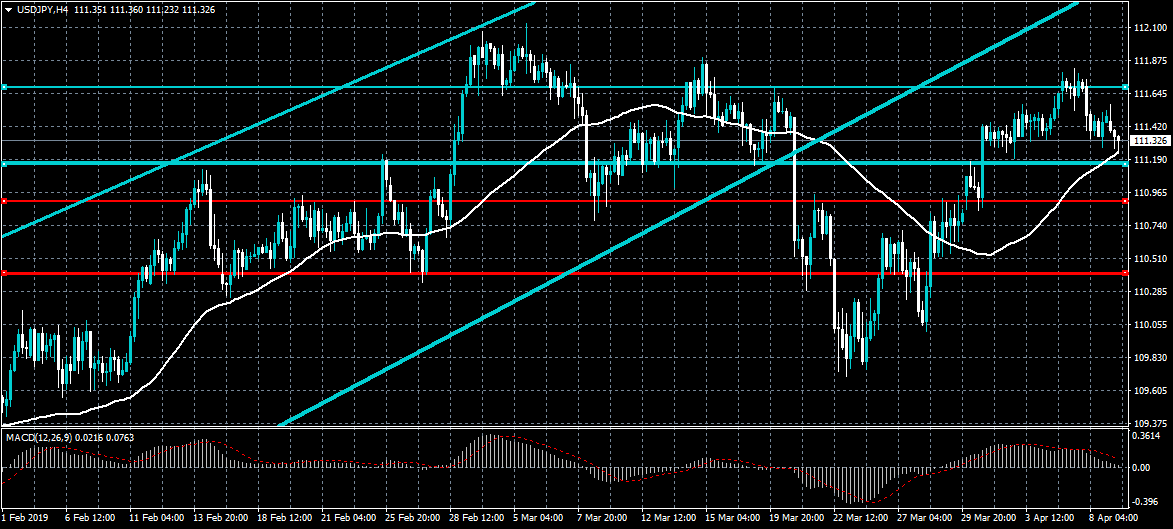
The US dollar is starting to come under technical selling pressure against the Japanese yen currency, with the risk-sensitive pair declining towards the 111.25 level. The four-hour time frame shows that a bearish triple-top price pattern is starting to form. If sellers can move price under the current weekly trading low, further losses towards the 110.90 support level appear likely.
If the USDJPY pair falls below the 111.25 level, key technical support is located at the 110.90 and 110.40 level.
If the USDJPY pair trades above the 111.60 level, buyers may test towards the 112.00 and 112.20 levels.
GBPUSD Testing 1.3100 Resistance
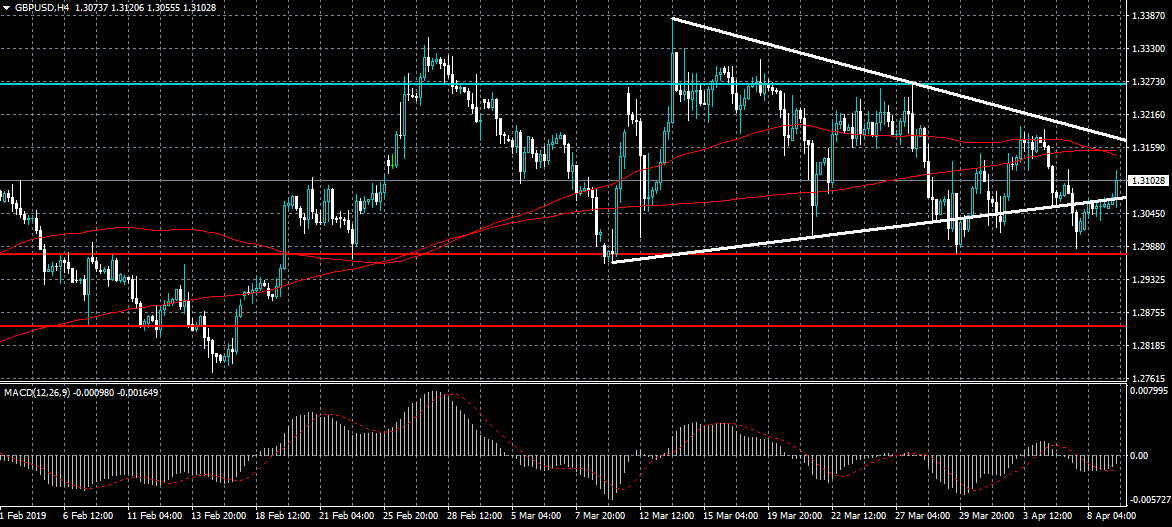
The British pound is testing the key 1.3100 resistance level against the US dollar as the greenback comes under selling pressure across the board. If GBPUSD bulls can hold price above the 1.3100 level, further upside towards the 1.3160 level appears likely. The MACD indicator is also starting to trend higher, which could signal more near-term gains for the GBPUSD pair.
If the GBPUSD pair trades above the 1.3100 level, key intraday resistance is found at the 1.3160 and 1.3200 levels.
If the GBPUSD pair trades under the 1.3060 level, key intraday support is found at the 1.3000 and 1.2980 levels.
GBP/AUD 4H Chart: Breaches Medium-Term Channel
The Pound Sterling has been depreciating against the Australian Dollar since the currency pair reversed from the upper boundary of a descending channel pattern at 1.8850 on March 14.
The exchange rate breached the lower boundary of a medium-term ascending channel pattern at 1.8344 during yesterday's trading session.
From a theoretical point of view, it is likely that the currency exchange rate continues its downward journey within this session.
The potential downside targets for bearish traders will be near a support cluster formed by the combination of the weekly and the monthly PPs at 1.8214 in the shorter term.