Sample Category Title
USD/JPY Trades Sideways At 111.50
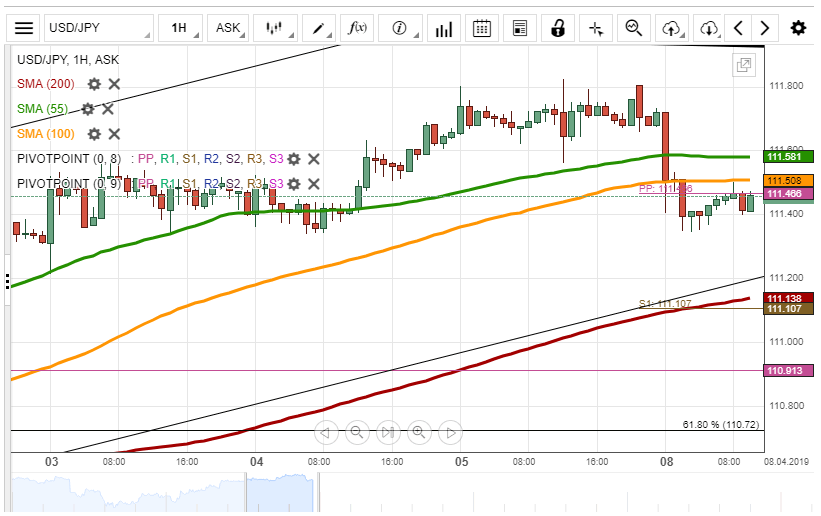
During Friday's trading session, the currency exchange rate was supported by the 55-hour simple moving average after which, the rate slumped to the 111.40 level. On Monday morning, the rate resisted by the 100-hour SMA to be located at the 111.50 mark.
In regards to the near-term future, the rate will break the weekly pivot point at 111.46 mark to trade sideways at the 111.50 level.
However, the resistance levels of the 55-hour and the 100-hour simple moving averages could retrace the rate to push it to depreciate to the bottom boundary of the trend line at the 111.20 level.
XAU/USD Breaks 200-Hour SMA
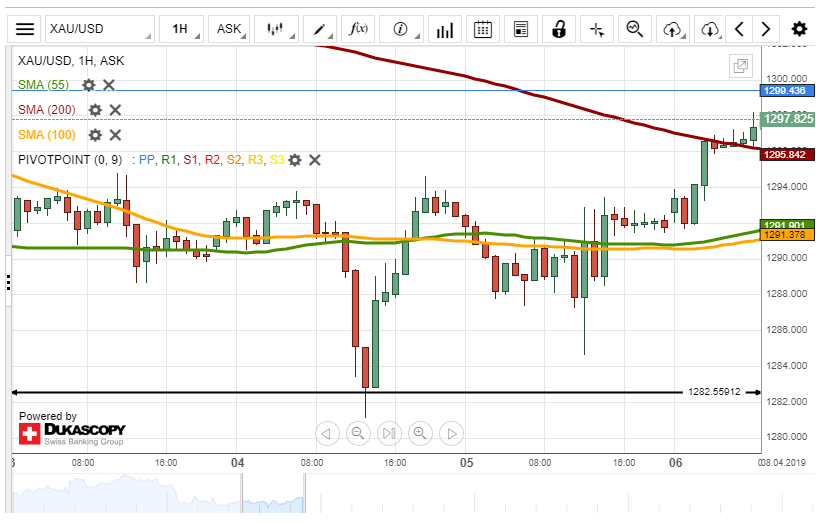
During Friday's trading session, the yellow metal was testing the 55-hour and the 100-hour simple moving averages to end the day at 1,292.00. On Monday morning, gold broke the resistance level of the 200-hour SMA to be located at the 1,296.93 mark.
It is expected that the yellow metal will trade sideways between the 200-hour simple moving average and the monthly pivot point to stay at the 1,295.00 level.
On the other hand, gold might bounce off the monthly pivot point at the 1,299.43 to depreciate to the 1,290.00 level.
TMT (Trend-Momentum-Trendline) Scalping System
TMT (Trend-Momentum-Trendline) is a trend scalping trading system based on a set of trend indicators and oscillators. It is developed for MetaTrader 4 for working on short timeframes. The system is founded on a trendline breakthrough in the direction of trend and market momentum. That increases the possibility to enter the market in favour of successful trend breaks.
TMT is created for active day traders or scalpers. It is recommended to work during the European and American sessions, as the high volatility is observed in the market. Transactions are better to open in the direction of the D1 daily candle.
The authors recommend using the strategy for short-term trading on M5-M15 timeframes within one trading day. You can use any currency pairs, but it is better to focus on majors.
As always, you should practice this trading system on a demo account before using it on real ones. You can open a demo account at JustForex and try out this trading strategy.
TMT system indicators
Below you can see how all the tools necessary for work on the TMT system are visually presented. When the TMT trading system is correctly installed, your price chart will look like:
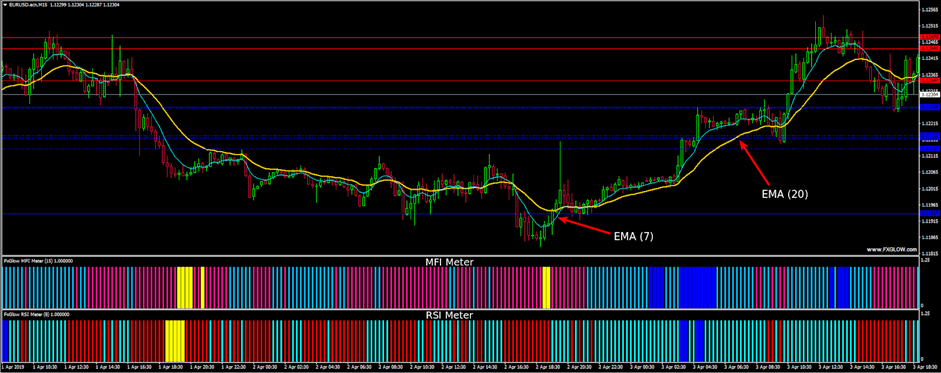
The strategy uses a series of modified technical indicators, including:
- Two EMA moving averages with periods of 20 and 7. They determine the direction of the local trend within a day;
- Two oscillators: MFI (Money Flow Index), which takes into account tick volume and RSI.
EMA moving averages are located on the price chart, while MFI and RSI are displayed in the window under the chart.
Also on the chart, the daily candle is displayed, which shows the current direction of the trend at D1 timeframe, as well as the support and resistance levels of higher timeframes. They allow the trader to more accurately set stop losses and take profits. The indicators and templates in the strategy are custom, so you need to download and install them in the MT4 terminal.
The principle of working with "TMT System"
Like any other trading system, this scalping strategy is also subject to a specific algorithm. According to the results of this algorithm, traders search for signals to enter positions.
Trading signals are determined by indicators and the trend line of the price channel used as an additional signal filter.
Conditions for entering short:
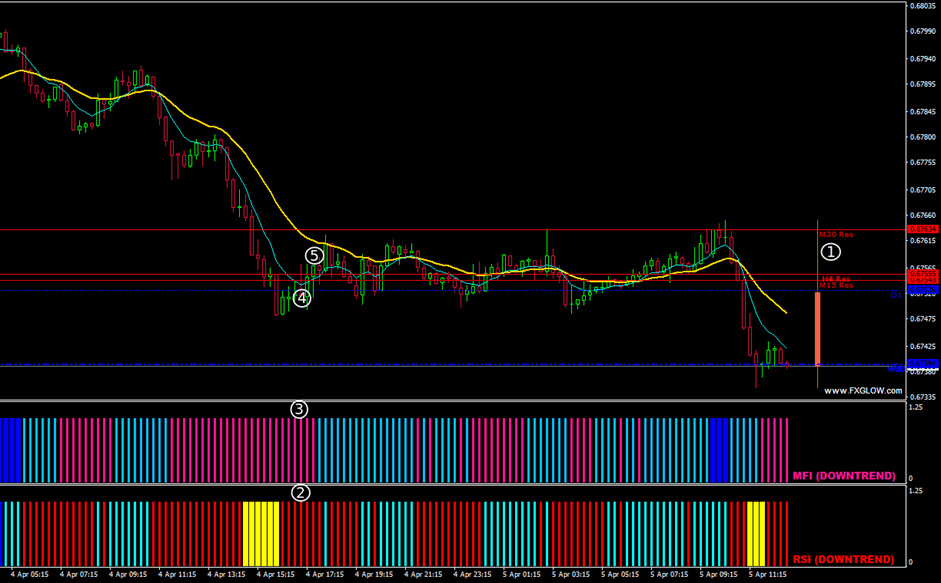
- The daily candle is red;
- A red bar has been formed on the RSI;
- A pink bar has been formed on the MFI Meter;
- 7 EMA is below 20 EMA - downtrend;
- The price pullback inside 7 and 20 EMA.
If all these conditions are met, then you can search for an entry point to sell. It is also necessary to draw a trend line. When the price breaks the line from top to bottom and fixes under it, it will be the entry point to the market.
Conditions for entering long:
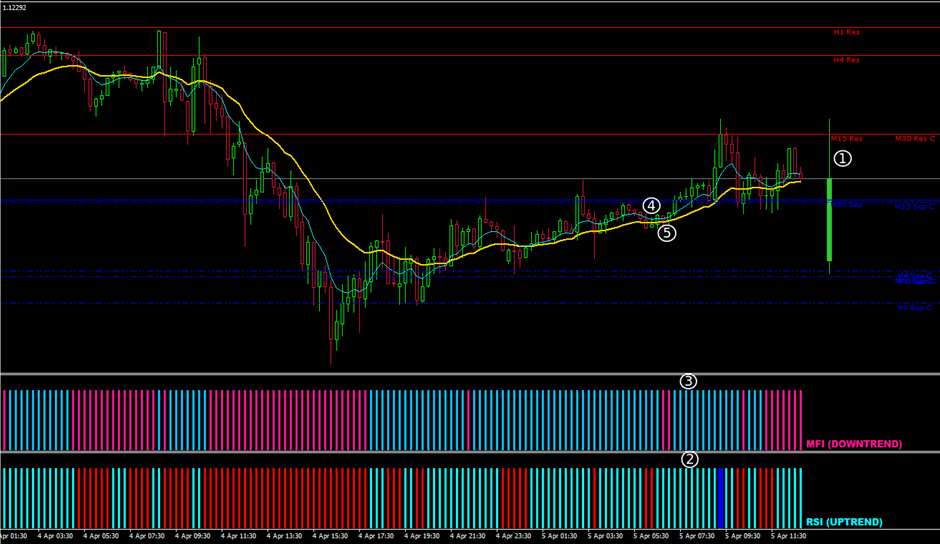
- The daily candle is green;
- A blue bar has been formed on the RSI;
- A blue bar has been formed on the MFI Meter;
- 7 EMA is above 20 EMA - uptrend;
- The price pullback inside 7 and 20 EMA.
When these conditions are met, draw a trend line from the highest maximum and wait for its breakdown.
Do not forget about the risk/reward ratio. According to the recommendations of this strategy, the ratio of Stop Loss and Take Profit is 1:1. This means that if you set the Stop Loss of 10 points, then Take Profit should correspond to the same value. The recommended stop-loss is 10-20 pips.
Scalping strategies are becoming more trendy day by day. Knowing different approaches to scalping, traders can choose the most appropriate one for successful trading activity. But it’s highly important your Forex Broker includes it. There are number of companies that has no restrictions to trading strategies. A good example of such Forex Broker is JustForex.
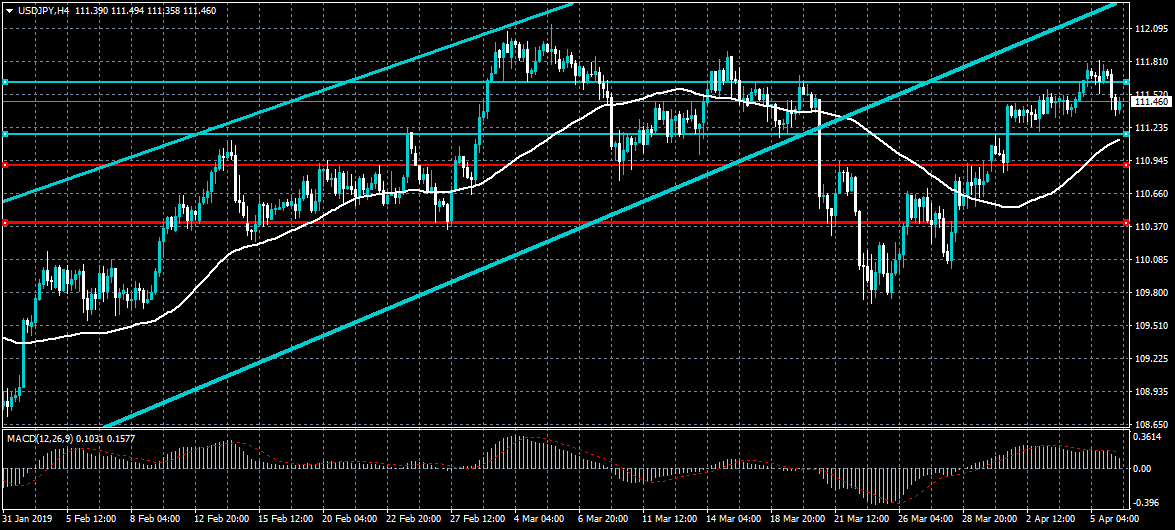
USDJPY Still Bullish Above 110.90
The US dollar is starting to correct lower against the Japanese yen currency on Monday after buyers failed to move price above the 112.00 resistance level. Technical indicators across the four-hour time frame are also starting to correct from overbought conditions. The overall weekly bullish bias towards the USDJPY pair will remain in place while price trades above the 110.90 level.
If the USDJPY pair falls below the 110.90 level, key technical support is located at the 110.66 and 110.40 level.
If the USDJPY pair trades above the 111.60 level, buyers may test towards the 112.00 and 112.20 levels.
GBPUSD Testing Trendline Resistance Hit Pause As Central Banks And Brexit Risks Loom
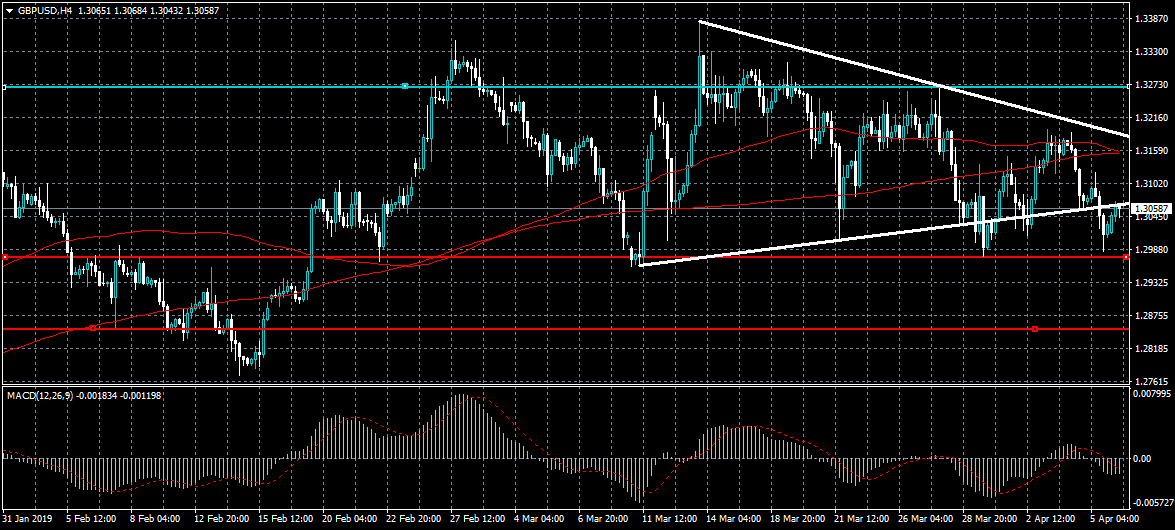
The British pound is testing towards key intraday resistance against the US dollar as the pair continued to rebound from the 1.3000 level. If the GBPUSD pair trades moves back inside symmetrical triangle pattern on the four-hour time frame, bulls are likely to test the 1.3100 resistance area. If bulls fail to move price above triangle resistance, sellers are likely to once again test below the 1.3000 level.
If the GBPUSD pair trades above the 1.3060 level, key resistance is found at the 1.3100 and 1.3180 levels.
If the GBPUSD pair trades below the 1.3160 level, key intraday support is found at the 1.3000 and 1.2980 level.
The Analytical Overview Of The Main Currency Pairs
The EUR/USD currency pair
Technical indicators of the currency pair:
Prev Open: 1.12189
Open: 1.12141
% chg. over the last day: -0.04
Day's range: 1.12103 – 1.12323
52 wk range: 1.1214 – 1.2557
EUR\USD shows an ambiguous technical picture. The trading instrument is consolidating. EUR\USD are testing the local support and resistance levels at 1.12100 and 1.12350 respectively. The financial market participants are evaluating the US March Labour Market report. USD is under pressure due to the descend of the US Treasury Bonds' yield. You should open positions from the key levels.
The Economic News Feed for 08.04.2019 is calm.
Industrial Orders Volume (US) – 17:30 (GMT+3:00);
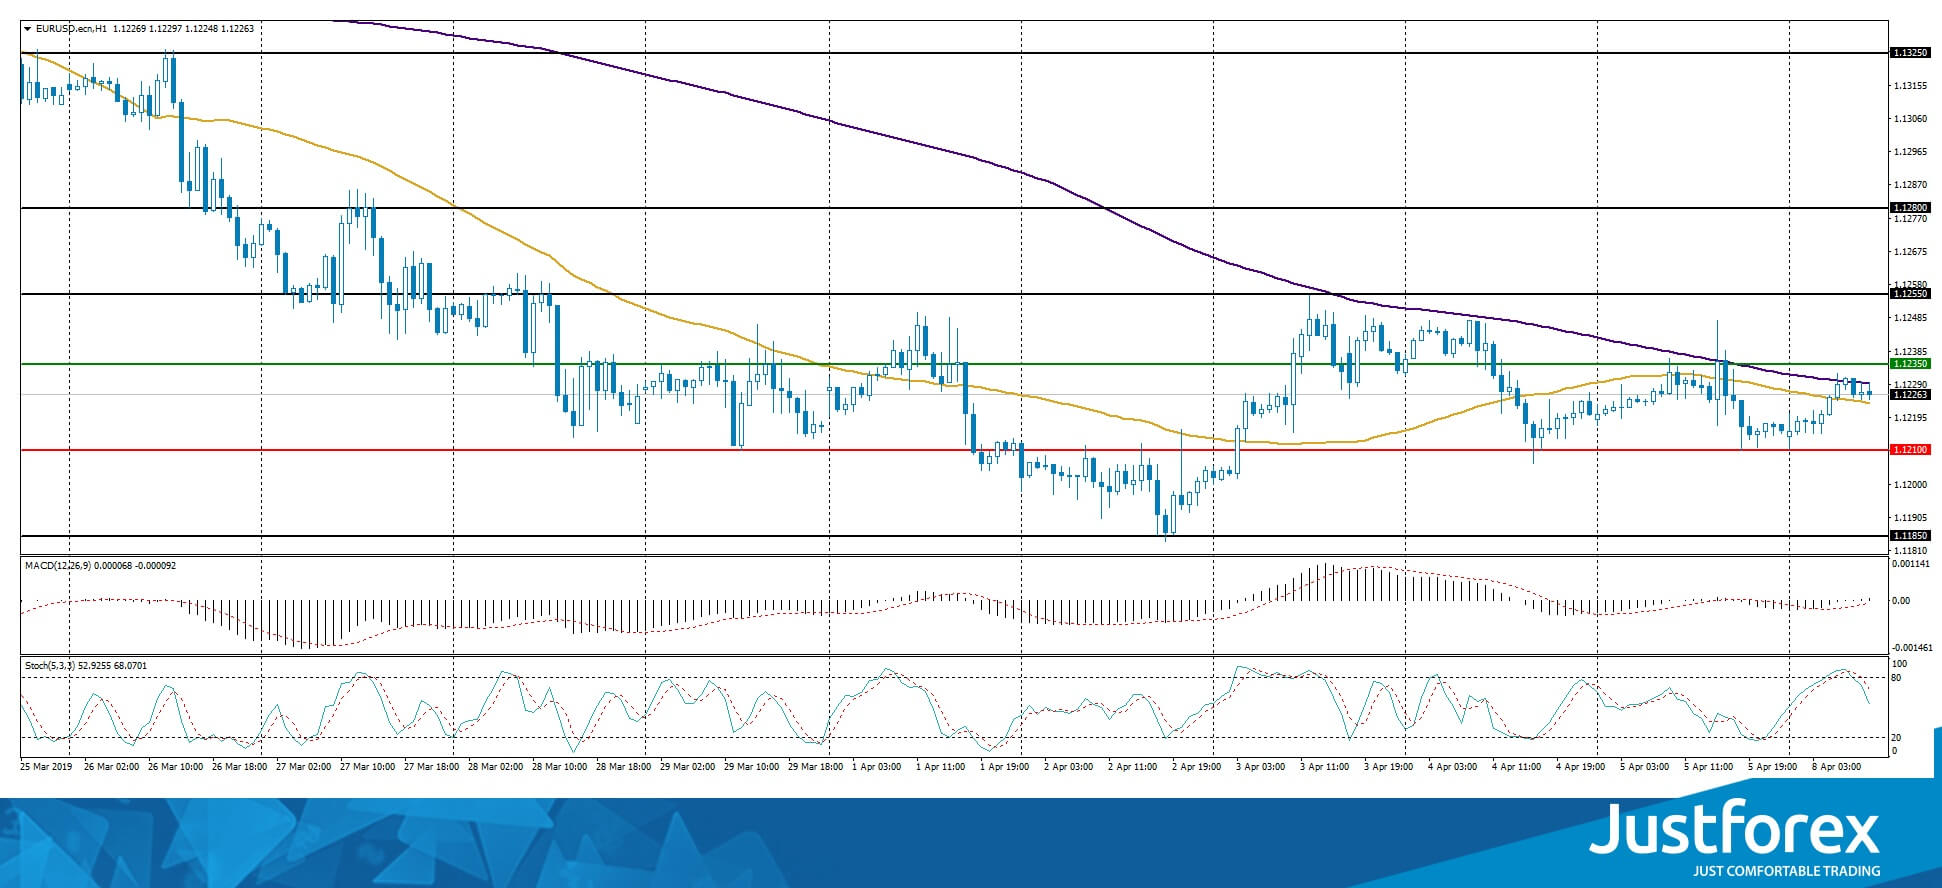
The indicators do not provide precise data, the price has crossed 50 MA and 200 MA.
The MACD histogram is close to 0.
The Stochastic Oscillator is in the neutral zone, the %K line is crossing the %D line. There are no signals at the moment.
Trading recommendations
Support levels: 1.12100, 1.11850, 1.11500
Resistance levels: 1.12350, 1.12550, 1.12800
If the price fixes at 1.12100, expect the quotes to fall toward 1.11800-1.11500.
Alternatively, the quotes can recover toward 1.12500-1.12700.
The GBP/USD currency pair
Technical indicators of the currency pair:
Prev Open: 1.30733
Open: 1.30350
% chg. over the last day: -0.31
Day's range: 1.30220 – 1.30721
52 wk range: 1.2438 – 1.4378
GBP\USD is consolidating. The technical picture is ambiguous. GBP is testing the local support and resistance levels at 1.30300 and 1.30700. The trading instrument has a tendency to descned. The financial market participants are keeping a close eye on Brexit. Theresa May recently sent a letter to Brussel with a request to postpone Brexit until June 30. Keep an eye on this issue and open positions from the key levels.
The Economic News Feed for 08.04.2019 is calm.
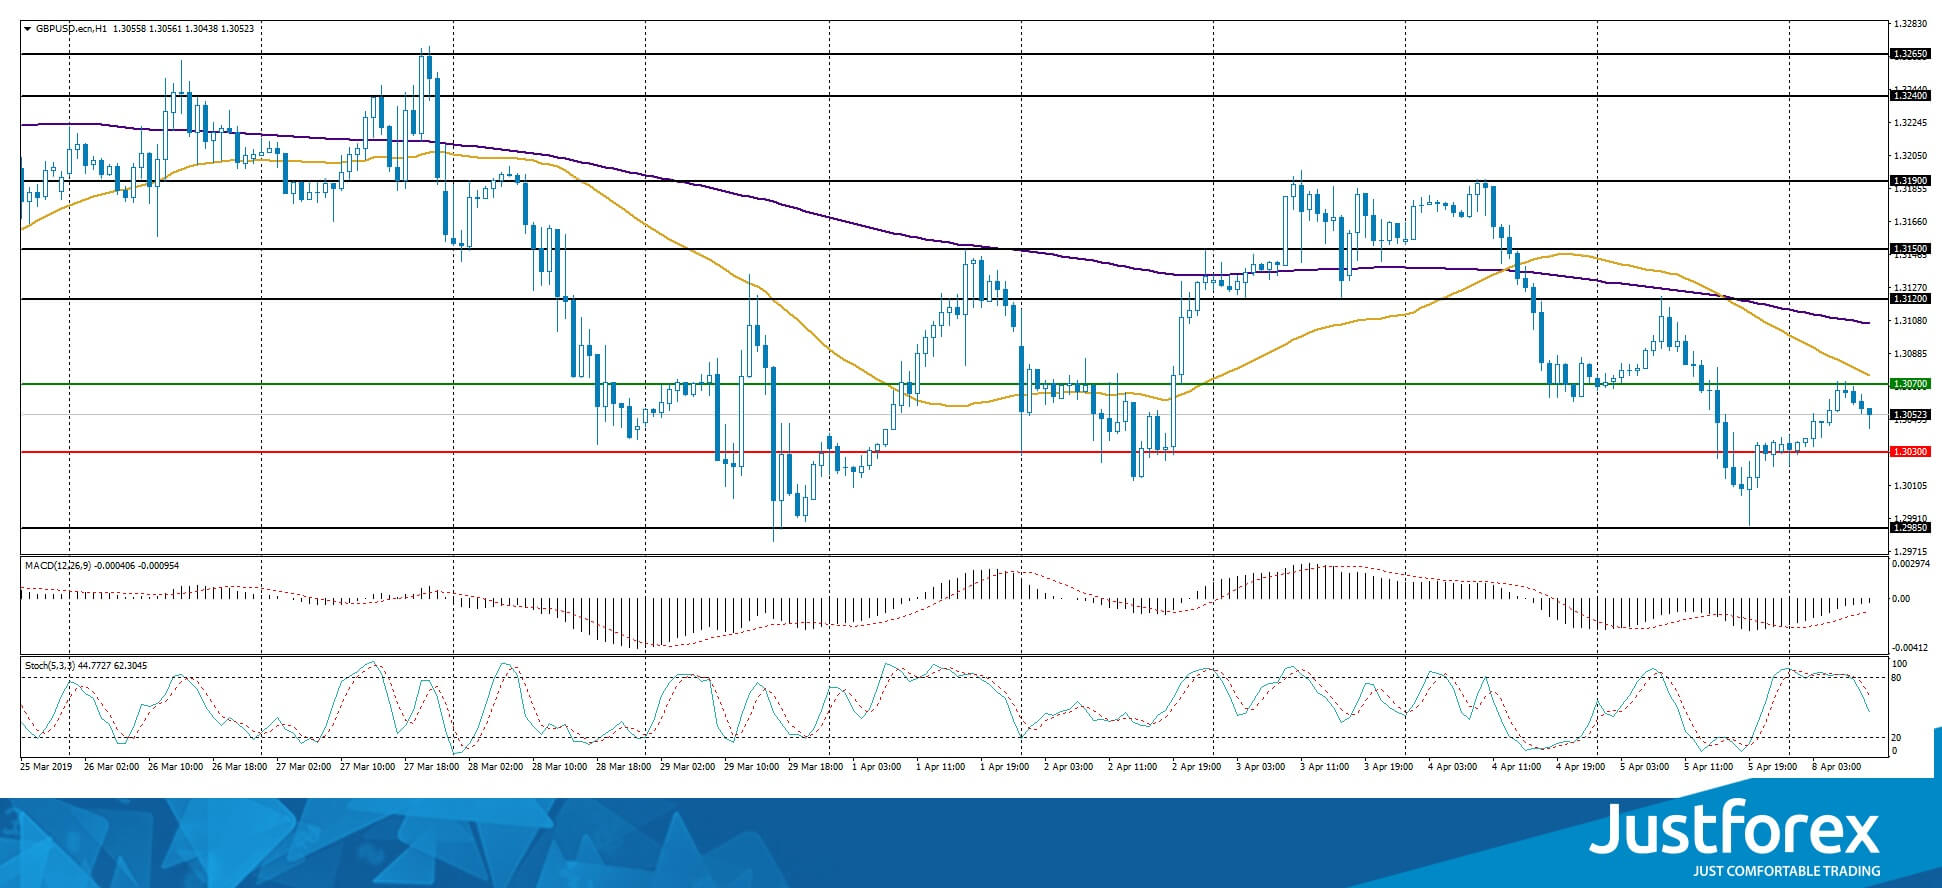
The indicators point to the power of the sellers, 50 MA fixed below 200 MA.
The MACD histogram is in the negative zone but above the signal line, which gives a weak signal to sell GBP/USD.
The Stochastic Oscillator is in the neutral zone, the %K line is below the %D line which points to the bearish mood.
Trading recommendations
Support levels: 1.30300, 1.29850, 1.29500
Resistance levels: 1.30700, 1.31200, 1.31500
If the quotes fix below 1.30300, expect further fall toward 1.29900-1.29700.
Alternatively, the quotes can grow toward 1.31000-1.31200.
The USD/CAD currency pair
Technical indicators of the currency pair:
Prev Open: 1.33581
Open: 1.33819
% chg. over the last day: +0.18
Day's range: 1.33691 – 1.33871
52 wk range: 1.2248 – 1.3664
USD/CAD was in a bullish mood on Friday and updated the local maximum. Currently it is stabilizing around 1.33650 and 1.34000. The pressure on the USD is caused by the lowering US Treasury bonds' yield. The bullish mood on the oil market supports CAD. The currency pair has a tendency to descend, you should open positions from the key levels.
At 15:30 (GMT+3:00) we expect the Canadian real estate market report.
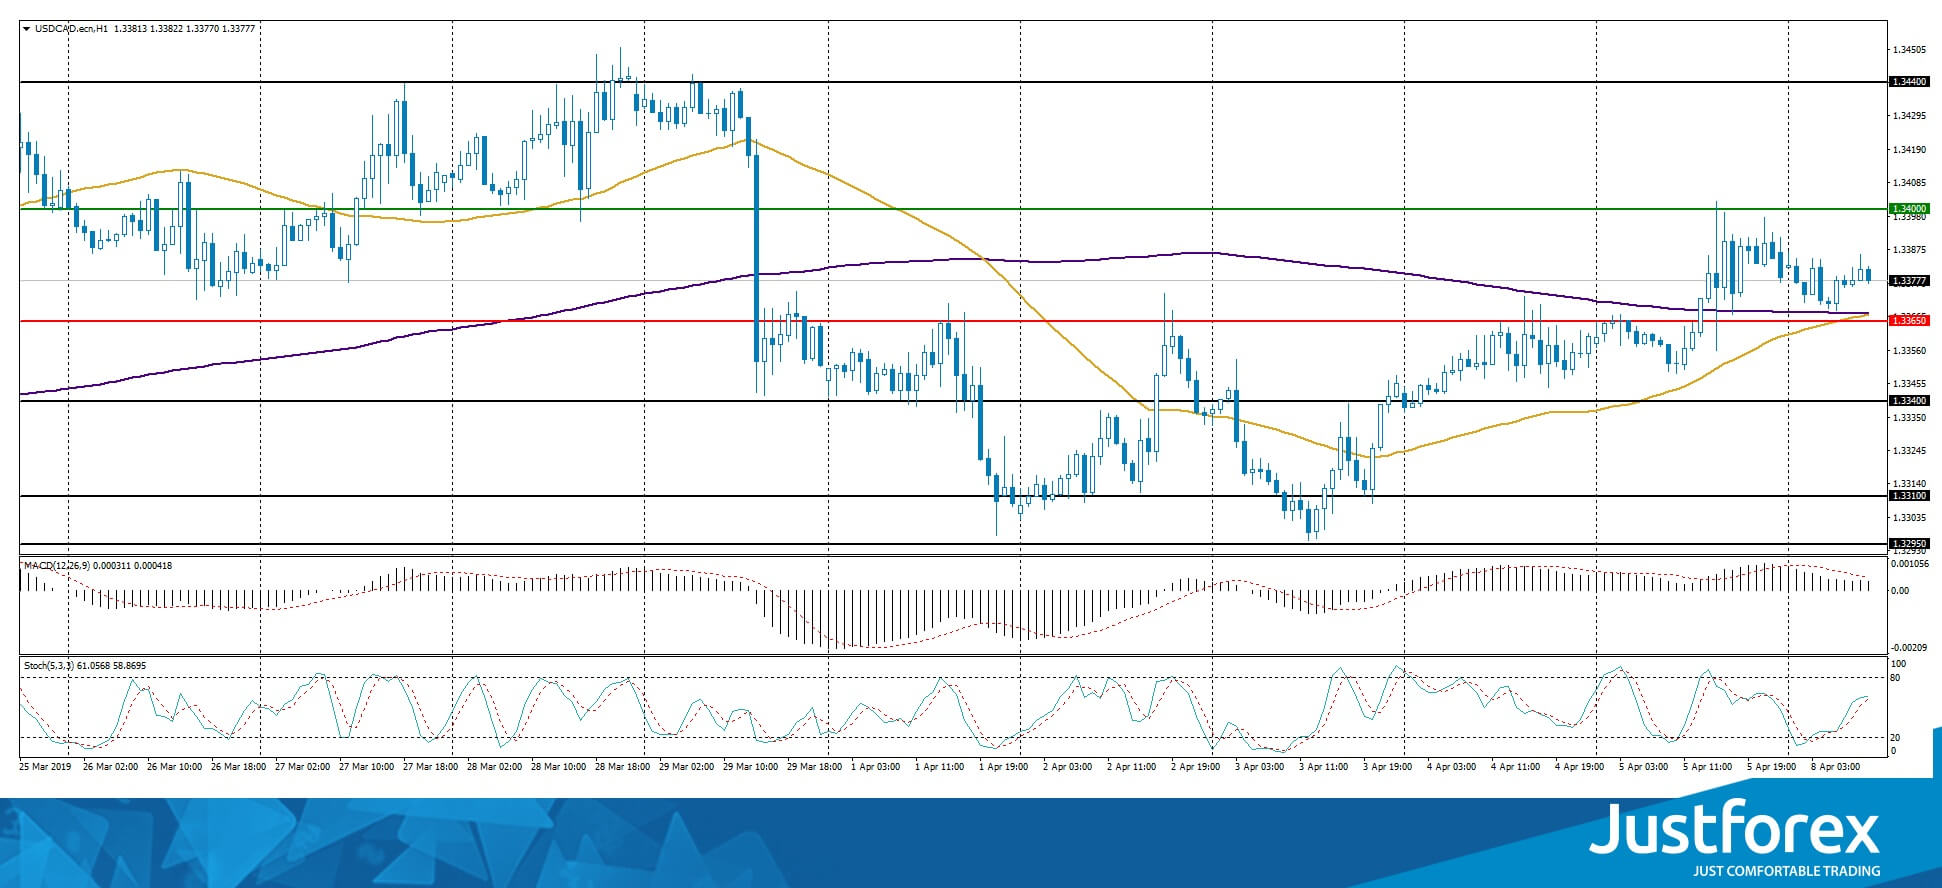
The indicators do not provide precise signals, 50 MA has crossed 200 MA.
The MACD histogram is in the positive zone but below the signal line which gives a weak signal to buy USD\CAD
The Stochastic Oscillator is close to the neutral zone, the %K line is above the %D line which points to the bullish mood.
Trading recommendations
Support levels: 1.33650, 1.33400, 1.33100
Resistance levels: 1.34000, 1.34400
If the price fixes below 1.33650, consider selling USD/CAD, the price is expected to fall toward 1.33400-1.33100.
Alternatively, the quotes can grow toward 1.34200-1.34400.
The USD/JPY currency pair
Technical indicators of the currency pair:
Prev Open: 111.643
Open: 111.666
% chg. over the last day: +0.05
Day's range: 111.343 – 111.740
52 wk range: 104.56 – 114.56
USD/JPY started to descend. A technical correction is possible soon, due to the afthermath of a long rally. The key levels are 111.350 and 111.750. Keep an eye on the US Treasury bonds' yield and open positions from the key levels.
The Economic News Feed for 08.04.2019 is calm.
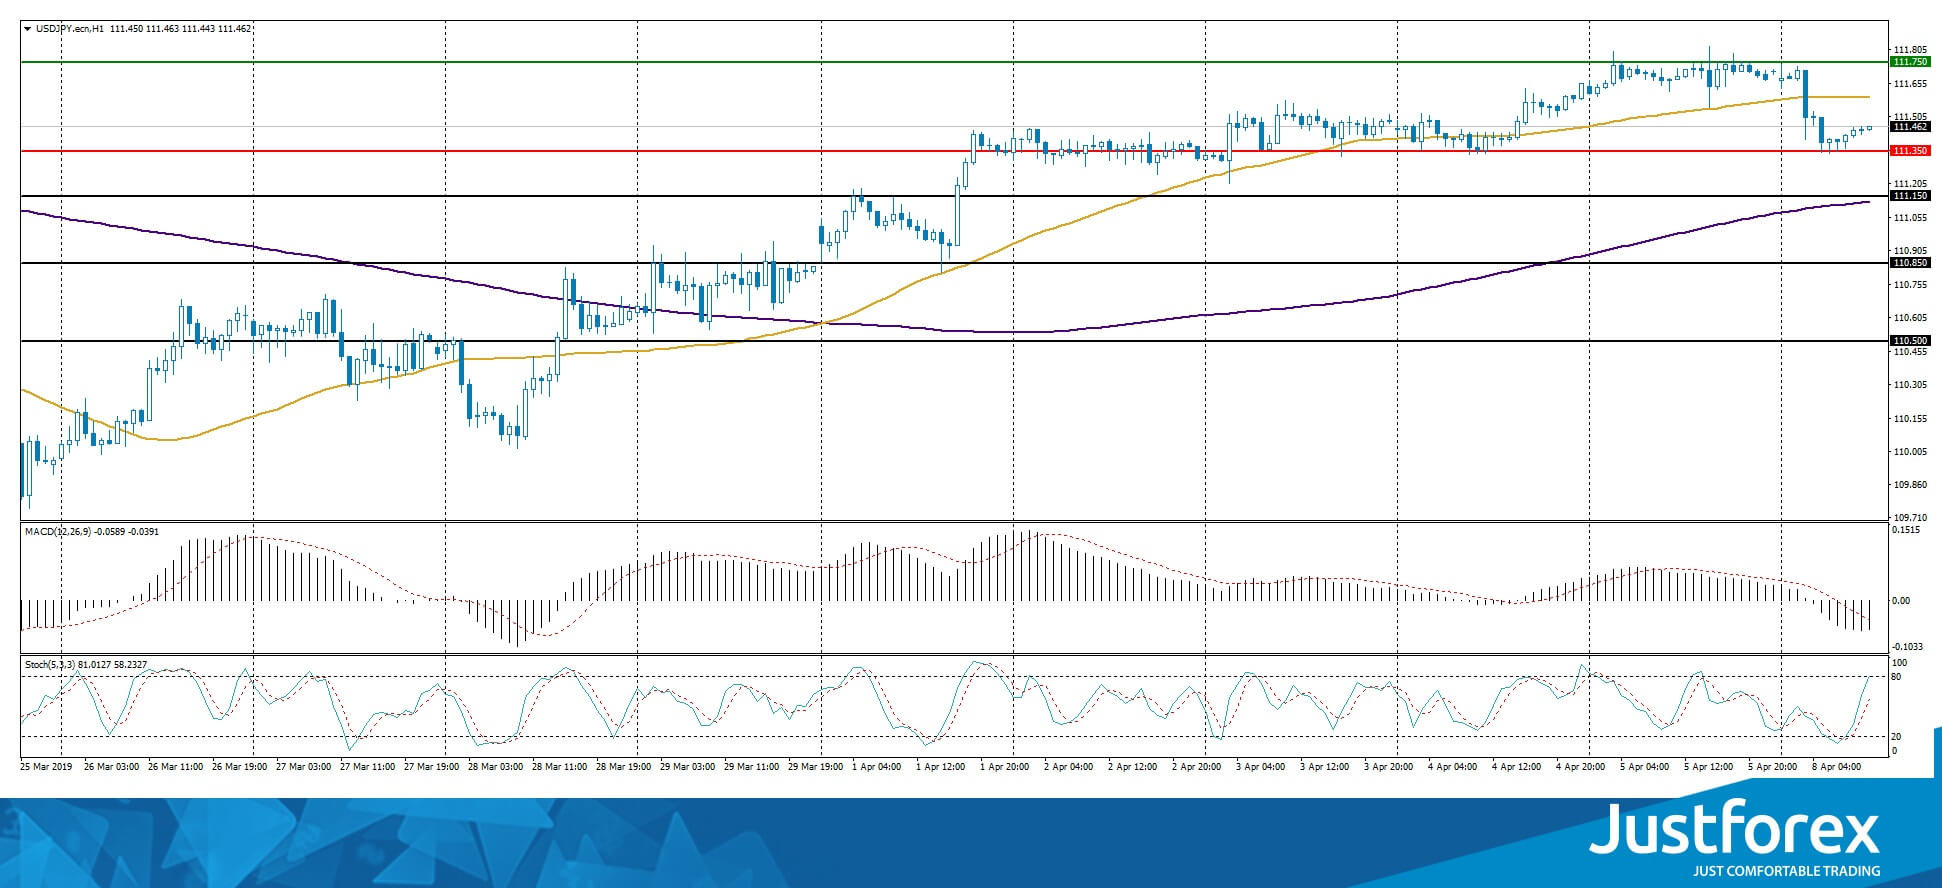
The indicators do not provide precise signals, the price fixed between 50 MA and 200 MA.
The MACD histogram is in the negative zone and below the signal line which gives a strong signal to buy USD/JPY.
The Stochastic Oscillator is in the neutral zone, the %K line is above the %D line which points to the bullish mood.
Trading recommendations
Support levels: 111.450, 111.150, 110.850
Resistance levels: 111.750, 112.000
If the price fixes above 111.350, expect further growth toward 111.000-110.800.
Alternatively, the quotes can fall toward 112.000.
Markets Hit Pause As Central Banks And Brexit Risks Loom
Monday April 8: Five things the markets are talking about
Global equities have opened slightly lower overnight as the market takes stock of last week’s rally, following progress in U.S-China trade talks and a strong U.S employment figure Friday, while conflict in Libya is sending oil prices higher.
Markets rallied last week as President Trump met Chinese officials in Washington, claiming progress in the continuing trade negotiations, while NFP data showed that U.S job growth rebounded last month.
Oil prices have jumped as fighting intensified near Tripoli this weekend, while in the U.K, investors are waiting on Brussels to decide on an extension to the Brexit deadline – at the end of the year or even in 2020 – while PM May seeks to cooperate with the Labor Party.
In the week ahead, the U.S. economy will see fresh data on inflation and consumer sentiment, while the Fed will release its March meeting minutes. The minutes should offer more detail on how officials judged the U.S economy and the prospect of either rate increases or cuts later this year.
Both U.S Treasuries and the dollar are trading steady after President Trump increased his rhetoric on the Fed to sustain growth.
Across the pond, there is the ECB decision mid-week. Last month policy makers made a clear dovish move, pushing back on its guidance regarding raising interest rates, announcing an upcoming new lending program for banks (TLTRO), and cutting forecasts. Nevertheless, Draghi is expected to provide an update about their economic situation.
Also, mid-week, all EU leaders, including U.K PM Theresa May, will convene at a special summit to discuss what to do with Brexit, just two days before the updated official exit date of April 12.
On tap: GBP GDP & manufacturing product, ECB monetary policy statement, USD CPI & FOMC meeting minutes (Apr 10).
1. Stocks mixed results
In Japan, the Nikkei ended lower overnight as the market remains cautious ahead of the corporate earnings season, although better than expected NFP data is limiting the downside for now. The index finished -0.21% lower, while the broader Topix dropped -0.4%.
Down-under, Aussie stocks found support by gains in mining and healthcare firms. The S&P/ASX 200 index closed up +0.65%, recouping some of -0.8% losses on Friday. In S. Korea, the Kospi index closed out virtually unchanged, up +0.04% from the previous session.
In China, stocks ended lower overnight amid profit-taking following last week’s strong gains, and as the market remained concerned over progress in China-U.S trade talks. The Shanghai Composite index was down -0.05%, while China’s blue-chip CSI300 index was down -0.12%.
In Hong Kong, stocks ended firmer overnight, closing at a nine-month high as a jump in U.S payrolls and hints of more stimulus in China supported investor sentiment, while high oil prices lifted energy stocks. At the close of trade, the Hang Seng index was up +0.47%, while the Hang Seng China Enterprises index rose +0.87%.
In Europe, regional bourses trade lower following recent strength, in line with mixed Asian Indices and lower U.S Index futures.
U.S stocks are set to open in the ‘red’ (-0.15%).
Indices: Stoxx600 -0.24% at 387.30, FTSE % at #, DAX -0.41% at 11,960.99, CAC-40 -0.14% at 5,468.38, IBEX-35 -0.72% at 9,442.20, FTSE MIB -0.20% at 21,715.50, SMI -0.19% at 9,523.00, S&P 500 Futures -0.15%
2. Oil jumps to new highs on U.S sanctions, OPEC cuts and Libya fighting
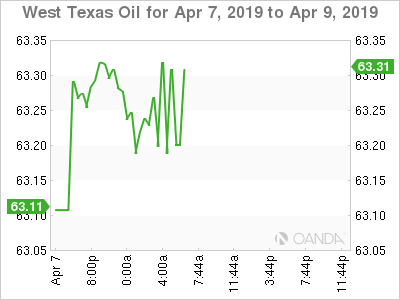
Oil prices have rallied to a new five-month high overnight, driven by OPEC+ supply cuts, U.S sanctions against Iran and Venezuela, fighting in Libya as well as strong U.S jobs data.
Brent futures are at +$70.62 per barrel, up +28c, or +0.4% from Friday’s close, while U.S West Texas Intermediate (WTI) crude are up +30c, or +0.5%, at +$63.39 per barrel.
Note: Brent and WTI both hit their highest since November at +$70.76 and +$63.48 a barrel overnight.
Oil ‘bulls’ are finding support from Friday’s better than expected U.S payrolls report and OPEC+ commitment to withhold around +1.2M bpd of supply this year. However, this morning’s kick higher has come mostly from an escalation of fighting in Libya which is threatening further supply disruption.
Nevertheless, oil bears are taking solace from the possibility that Russia maybe a reluctant participant in its agreement with OPEC to withhold output, and it may increase production if the deal is not extended before it expires on July 1 and from the fact that in the U.S, crude production reached a global record +12.2M bpd last month.
Note: Russian oil output reached a national record high of +11.16M bpd last year.
Ahead of the U.S open, gold prices have rallied to a one-week high overnight as the ‘big’ dollar slipped a tad after data Friday showed that U.S wage growth slowed last month, while the markets waits for the Fed’s minutes mid-week. Spot gold has gained +0.4% to +$1,296.87 per ounce, while U.S gold futures are also up +0.4% at +$1,301 an ounce.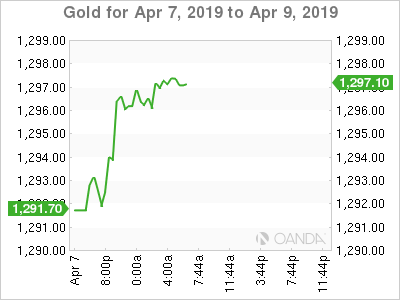
3. JGB’s gain on risk aversion
Japanese government bond prices have rallied broadly overnight as risk aversion amid a decline in equities supported debt, while a regular debt-purchasing operation conducted by the Bank of Japan (BoJ) gave further support to the market.
The five-year JGB yield fell -1 bps point to -0.170%, while the 10-year yield dropped -1.5% to -0.050%. The 30-year yield declined -1 bps to +0.535%.
Note: Longer-dated JGB’s benefited as the BoJ offered to buy +$2B worth of 10- to 40-year bonds.
Stateside, President Trump has called again for the Fed to loosen monetary policy, this time going so far as to say the central bank “should return to the aggressive measures it undertook during the financial crisis.” He also indicated that the Fed should also start expanding the central bank’s balance sheet.
Elsewhere, the yield on 10-year Treasuries dipped less than -1 bps to +2.49%, while in Germany, the 10-year Bund yield declined -1 bps to +0.00%. In the U.K, the 10-year Gilt yield has decreased less than -1 bps to +1.114%.
4. Dollar looking for directional help
It’s a quiet start to a key week for Europe as EU leaders meet mid-week to discuss the Brexit situation. Also, there is the ECB rate announcement and FOMC minutes due this Wednesday.
EUR/USD (€1.1237) is steady with the focus on the ECB decision. The market is not expecting the central bank to reveal any more details regarding the third round of targeted longer-term refinancing operations (TLTRO-3).
Sterling (£1.3055) will be looking to whether PM Theresa May can reach an agreement with Labor opposition leader Jeremy Corbyn, for now the currency remains stable. If she could secure an agreement, she would then be expected to head to Brussels to obtain a Brexit deal which may get her a majority in the House of Commons. Until this happens, the danger of a ‘no deal’ happening remains valid.
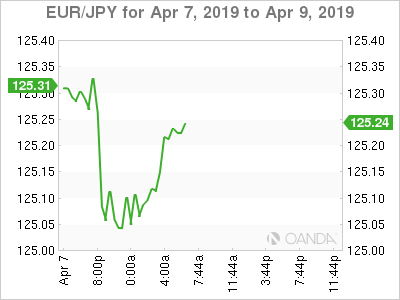
Elsewhere, the yen has climbed +0.3% to ¥111.45, the biggest increase in more than a fortnight.
5. Eurozone investor morale rises on China hopes
Data this morning showed that Investor morale in the eurozone improved this month to hit its highest level in five-months, supported by signs of an upswing in China.
The Sentix research group said its investor sentiment index for the eurozone rallied to -0.3 from -2.2 in March. The market was expecting a reading of -2.1.
Digging deeper, a sub-index of expectations improved for the third consecutive month, reaching -4.3. However, the current situation weakened for the eighth month in a row, slumping to 3.8, its weakest level since February 2015.
“The economic situation in the eurozone remains fragile,” said Sentix, but “with expectations rising, the momentum of the decline is slowing.”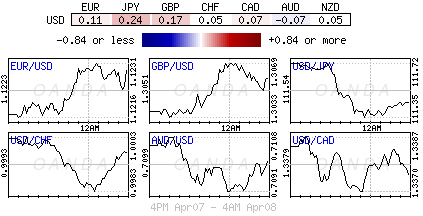
USDJPY Eyes 111.57 To Return To Bullish Action In Short Term
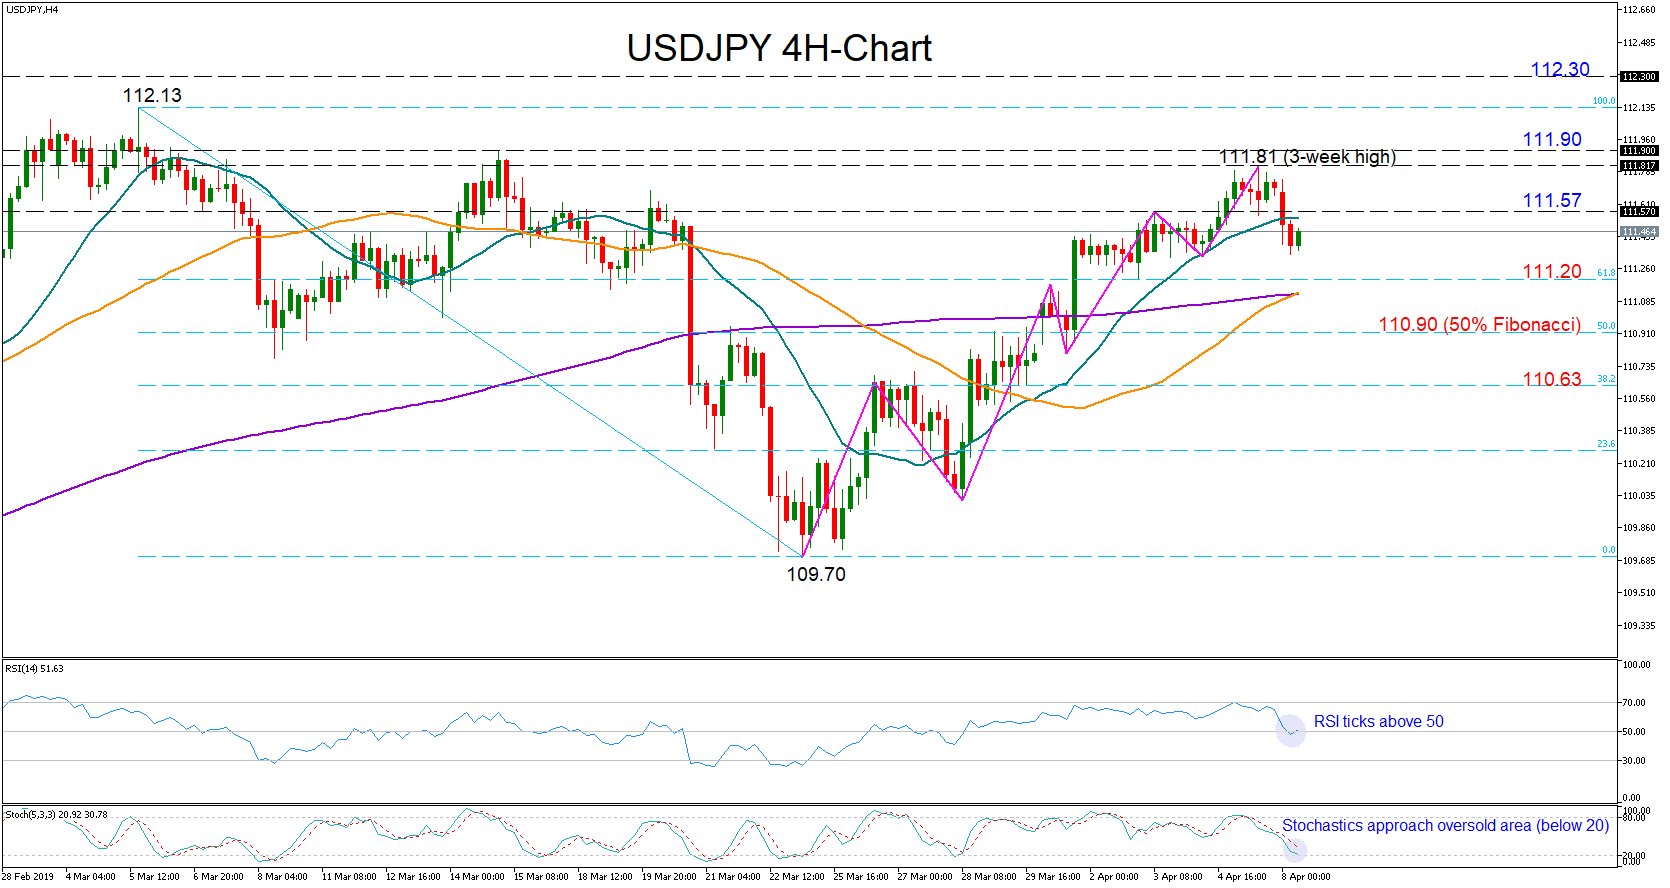
USDJPY failed to close above the 112 level on Friday once again, with the price retreating below the 20-period moving average in the four-hour chart.
The fast stochastics, however, provide optimism that the pair could recoup some losses as the red %K line and the blue %D line approach oversold territory (below 20). The RSI looks to be improving at the current time, though, as long as it holds close to its 50 neutral mark, any gains could appear limited in the short term.
Should the pair climb back above 111.57, the previous high of the recent uptrend, positive momentum could meaningfully extend towards the 111.80-111.90 area. Breaking significantly above this zone, the bulls would push card to clear the 112 mark and more importantly the 112.30 number which had acted as a strong support at the end of 2018.
Otherwise, a drop below 111.20, the 61.8% Fibonacci of the downleg from 112.13 to 109.70, may further weaken sentiment in the market, whilst a fall under the 50% Fibonacci of 110.90 would put the recent upward pattern into question. The 38.2% Fibonacci of 110.63 could be the next level to watch if the sell-off continues.
Investors Assess The Report On The US Labor Market. Geopolitical Events Are In The Foreground
On Friday, the US dollar strengthened against a basket of major currencies despite the publication of mixed economic statistics. Thus, nonfarm payrolls increased by 196K in March, while experts expected growth by 175K. The unemployment rate counted to 3.8% in March, which matched the investors' expectations. However, growth in average hourly earnings slowed down from 0.4% to 0.1% in March. Experts expected the figure at 0.2%. The dollar index (#DX) closed the trading session with a slight increase (+0.08%).
The US government bonds yield has been decreasing again, which puts additional pressure on the greenback. Financial market participants are still focused on political events. British Prime Minister Theresa May asked Brussels for Brexit delay until June 30 in order British parliamentarians could agree on a deal of exiting the country from the block. Last week, US President Donald Trump said that Washington and Beijing were very close to reaching an agreement in trade disputes. Partners can sign a trade deal in the next four weeks. We recommend following current information on these issues.
The "black gold" prices are showing positive dynamics. At the moment, futures for the WTI crude oil are consolidating near $63.25 per barrel.
Market Indicators
- On Friday, the bullish sentiment was observed in the US stock market: #SPY (+0.48%), #DIA (+0.14%), #QQQ (+0.52%).
- The 10-year US government bonds yield has updated local lows. Currently, the indicator is at the level of 2.49-2.50%.
Today, the news feed is rather calm:
- Housing starts in Canada at 15:15 (GMT+3:00);
- Factory orders in the US at 17:00 (GMT+3:00).
USD Makes Gains After Release Of US Employment Report, But Remains In Check
The USD weakened initially, yet made some gains as the US employment report for March was released on Friday. The report showed a slower growth in average wages than expected, yet the overall picture of the US employment market remains tight as the NFP figure rose by a solid 196k. Analysts point out that the data released may not point towards a rate cut nor a rate hike for the Fed as they fail to provide any decisive incentives for either. Other headlines, seem to suggest that the US-Sino negotiations show some progress as the two sides wrapped up the latest round, yet a solution may require more time. AUD/USD dropped on Friday and during today’s Asian session, as it wasn’t able to clearly break above the 0.7121 (R1) resistance line and corrected lower. The pair may continue the sideways movement it has been maintaining for the past two weeks between the 0.7065 (S1) support line and the 0.7120 (R1) resistance line. Should the bulls take over, we could see the pair breaking the 0.7120 (R1) resistance line and aim for the 0.7190 (R2) resistance level. Should on the other hand the pair’s direction be dictated by the bears, we could see it breaking the 0.7065 (S1) support line and aim for the 0.7005 (S2) support barrier.
WTI prices hit a five month high.
WTI prices continued to rise in a bulls market, reaching a 5 month during today’s Asian session. Analysts cite OPEC’s continuous supply cuts along with US sanctions on Venezuela and the Iran, as the main drivers behind the surge. On the demand side, optimism about the US-Sino negotiations seems to be also boosting prices. Energy consultants seem to be viewing prices as poised for further rises as excess inventories should start fading away and the market looks healthy. On the other hand a possible rise of Russian and US production levels could undermine oil prices. WTI prices rose and reached the level of 63.40 during today’s Asian session. As the upward trendline seems to be continuing to feed black gold’s price action, we could see them rising even higher. Should the commodity’s price action find fresh buying orders along its path, we could see it breaking the 63.80 (R1) resistance line and aim for the 65.3 (R2) resistance hurdle. Should the commodity come under the selling interest of the market, we could see its prices breaking the 62.00 (S1) support line and aim for the 60.85 (S2) support level.
Other economic highlights, today and early tomorrow
In today’s European session we get from Germany the trade balance figure for February, while in the American session, we get Canada’s housing starts figure for March and the US factory orders growth rate for February.
As for the week ahead:
On Tuesday no major releases are expected, but Wednesday is expected to bear a heavy load as in the European session we get the UK GDP for March, as well as UK’s manufacturing output for February. The main release of Wednesday though could be the ECB’s interest rate decision and also the EU’s Brexit summit is expected to keep the markets on the edge of their seats. In the American session, we get the US CPI rates for March and the FOMC’s meeting minutes are to be released. On Thursday, we get China’s CPI rates for March, Germany’s and Eurozone’s final HICP for March and the US PPI rate for March. On Friday, we get China’s trade balance figure for March, Eurozone’s industrial production for February and from the US the preliminary U. Michigan Consumer Sentiment for April.
AUD/USD H4
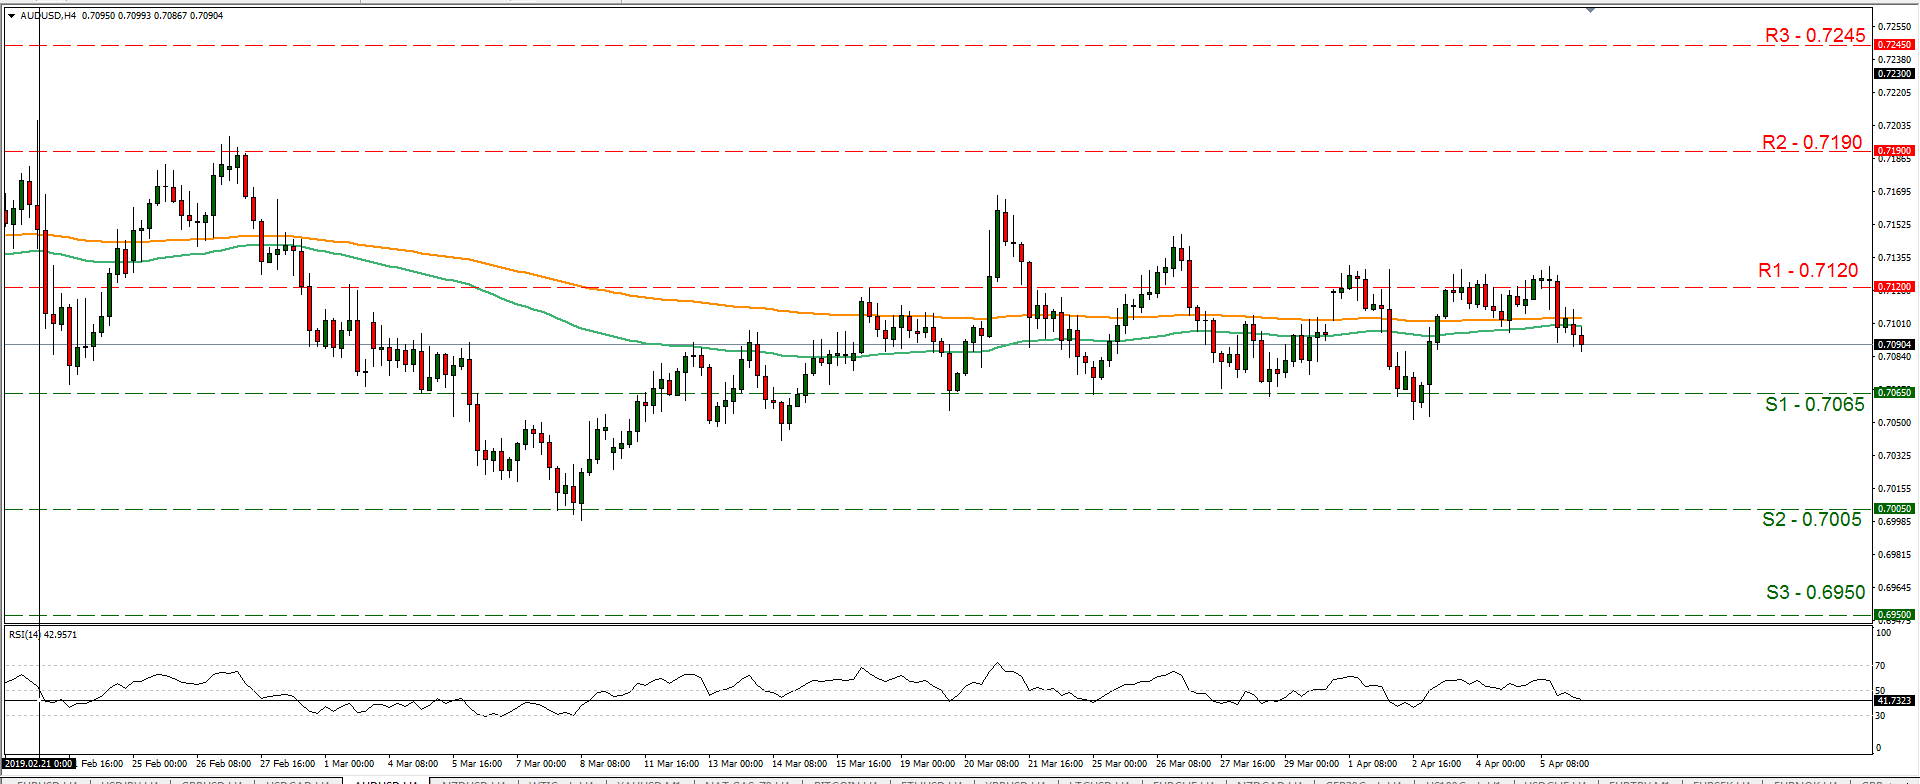
Support: 0.7065 (S1), 0.7005 (S2), 0.6950 (S3)
Resistance: 0.7120 (R1), 0.7190 (R2), 0.7245 (R3)
WTI H4
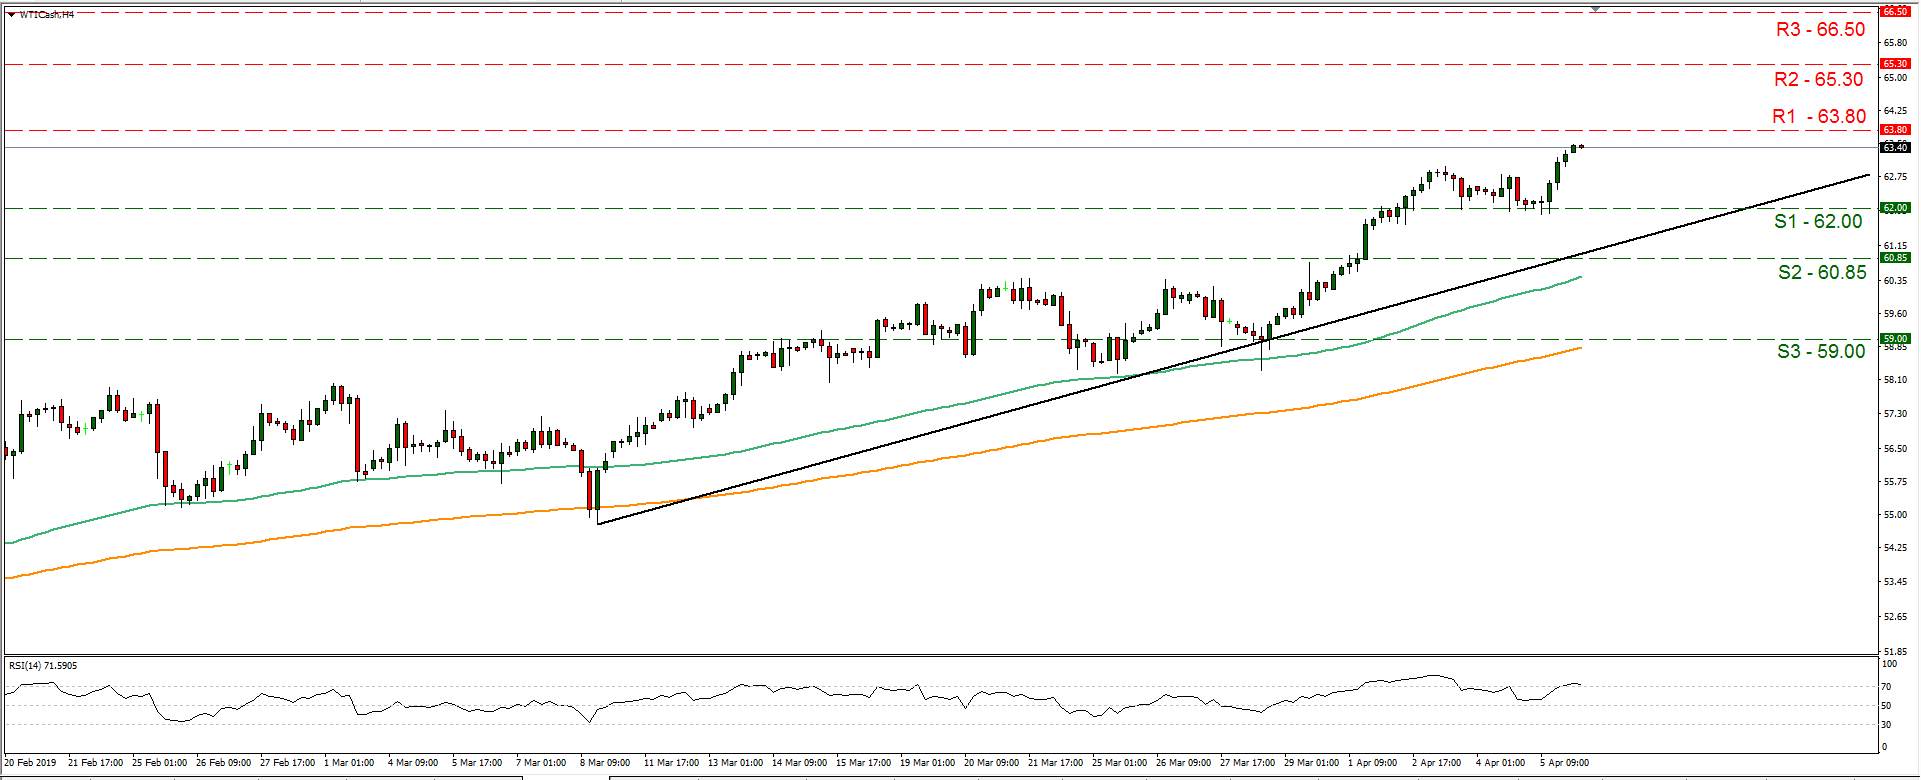
Support: 62.00 (S1), 60.85 (S2), 59.00 (S3)
Resistance: 63.80 (R1), 65.30 (R2), 66.50 (R3)