Sample Category Title
GBPUSD Moving Lower
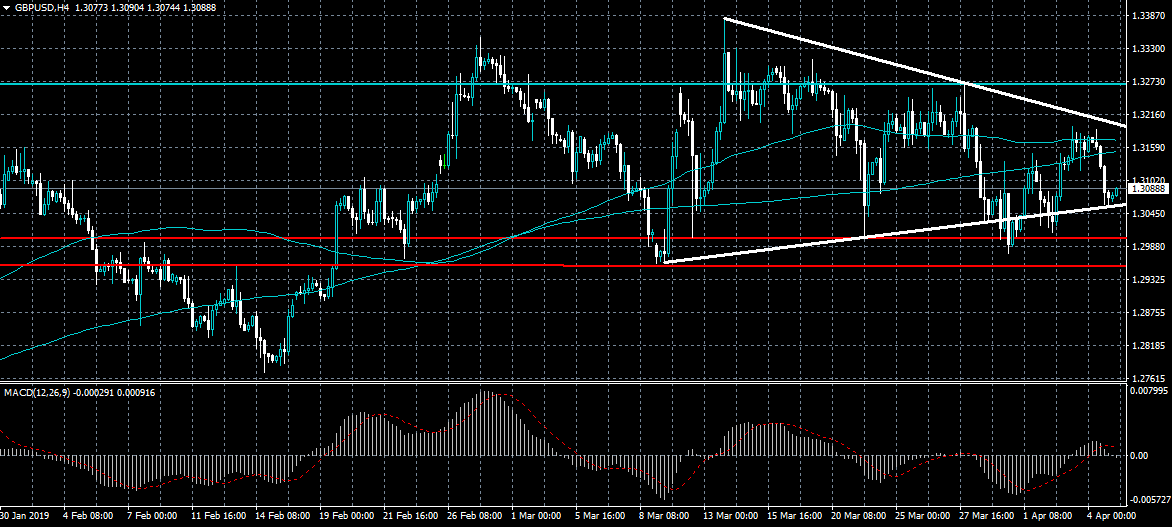
The British pound is coming under selling pressure towards the 1.3050 support level against the US dollar after buyers failed to break key trendline resistance on the four-hour time frame. The GBPUSD pair may weaken towards the 1.3000 level if sellers can move price below key trendline support. The 1.3180 level is now acting as the strongest form of daily resistance for the GBPUSD pair.
If the GBPUSD pair trades below the 1.3050 level, key support is found at the 1.3000 and 1.2970 levels.
If buyers move price above the 1.3100 level, key resistance is found at the 1.3155 and 1.3180 levels.
USDJPY Testing Rising Wedge
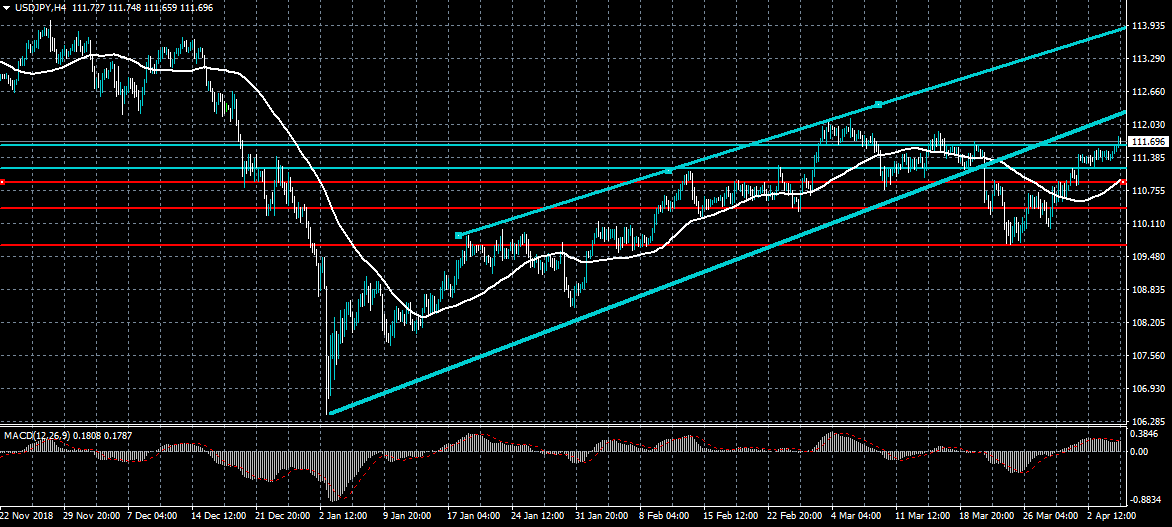
The US dollar has moved to a new monthly trading high against the Japanese yen currency following more bullish news coming from Sino-US trade talks. The USDJPY pair has now moved above the 111.60 level and may attempt to move back inside the rising wedge pattern. Overall, the USDJPY pair will retain its strong weekly bullish bias while trade above the 110.90 support level.
The USDJPY pair is strongly bullish while trading above the 111.60 level, key resistance is found at the 111.90 an 112.25 levels.
If the USDJPY pair falls below the 111.30 level, key technical support is located at the 110.90 and 110.60 level.
US Dollar Index Pauses Ahead Of March NFP Data
Asia-Pacific equities were mixed after the timing of the US-China trade deal was postponed. In an interview, Donald Trump said that there were still some pending issues, which could push the announcement of the deal to the next four weeks. Traders were expecting a deal to be announced shortly, after the current round of negotiations ends. In Tokyo, the Kospi index rose by 0.4% and in Australia, the ASX 200 dropped by almost a percentage point. Chinese stocks are closed for the Ching Ming Festival.
In Japan, the yen was little moved against the US dollar after the release of weak economic data. The average cash earnings declined by minus 0.8%, which was below the expected gain of 0.9%. In February, the household spending rose by an annualized rate of 1.7%, which was lower than the expected 1.9%. On a MoM basis, spending slumped by -2.0%, which was lower than the expected decline of -0.5%. These numbers come at a time when the unemployment rate is at just 2.5% and inflation rate is below the BOJ target of 2.0%. Therefore, it will be unlikely for the BOJ to hike rates this year.
Today, traders will focus on the German industrial production data for March. They expect the numbers to show an increase of 0.6%, which will be better than the previous month’s decline of 0.8%. In Spain, the industrial production for February is expected to have increased by 0.2%.
In the United States, the Labor Department is expected to release the employment numbers. The non-farm payrolls numbers for March are expected to rise to 170K, which is higher than the 20K released in March. The private nonfarm payrolls are expected to increase to 170K. The unemployment rate is expected to remain at 3.8% while the average weekly hours is expected to remain at 34.5. The average hourly earnings are expected to remain unchanged at 3.4% while the U6 unemployment rate is expected to remain at 7.6%. Today’s jobs numbers will be very important to the markets, because of how unexpected the previous release was.
In Canada, the unemployment rate is expected to remain at 5.8% while the participation rate is expected to decline to 65.7%.
EUR/USD
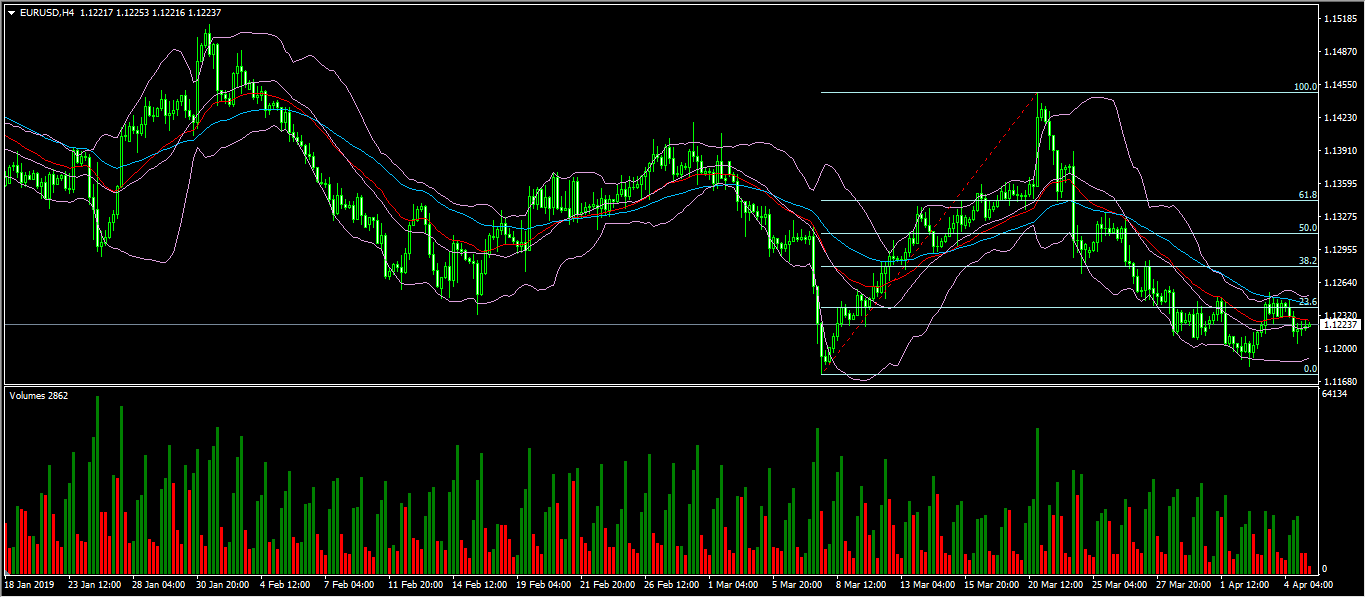
The EUR/USD pair moved up slightly in overnight trading as traders wait for data from the EU and America. It is trading at 1.1223, which is slightly higher than yesterday’s low of 1.1204. On the four-hour chart, the pair’s price is slightly above the 25-day and 50-day moving averages while the volumes have decreased. The price is along the middle line of the Bollinger Bands and below the 23.6% Fibonacci Retracement level. Today, the pair could make huge swings especially after the release of US jobs numbers.
USD/CHF
The USD/CHF pair started an upward rally on March 20, when it reached a low of 0.9893. Today, the pair moved higher ahead of the US jobs numbers. It is trading at 1.0003, which is known as the parity level. On the hourly chart, this price is slightly below the upper band of the Bollinger Bands, while the RSI has moved to the overbought level and the Average True Range indicator has moved to the lowest level since March. While the pair could continue the upward climb, it could also test the previous support of 0.9950, which provides an important support.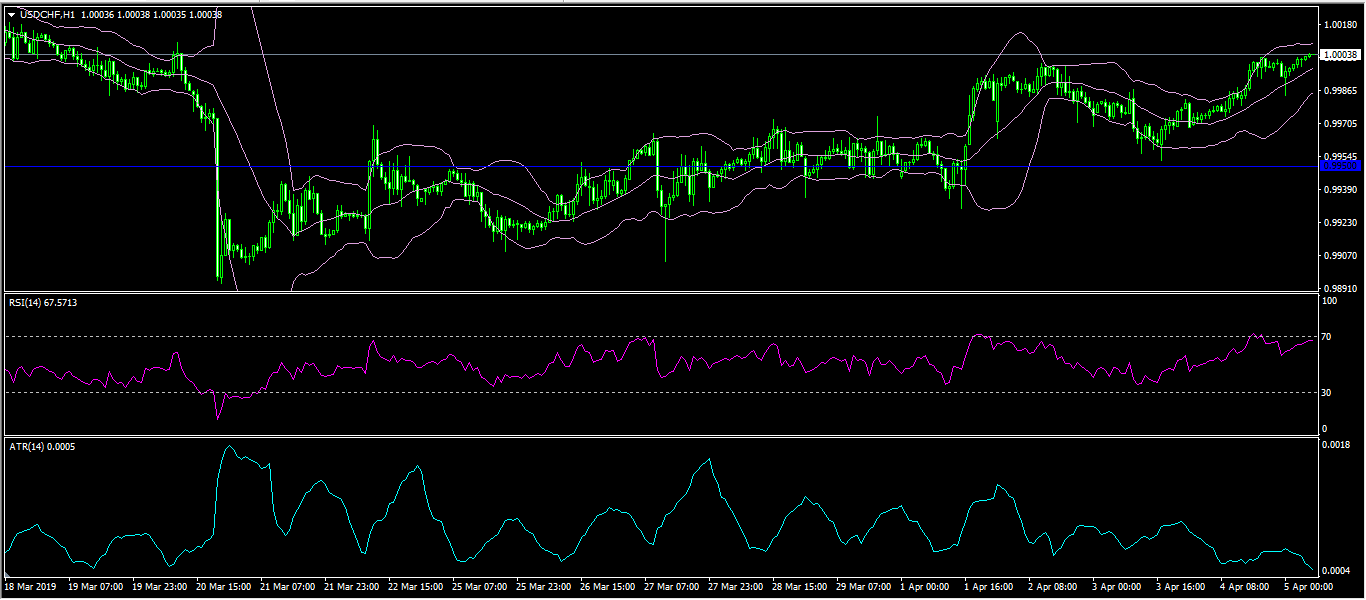
USD/CAD
The USD/CAD pair was little moved in overnight trading and is currently trading at the 1.3360 level, which is higher than the previous low of 1.3295. On the hourly chart, the pair is slightly above the middle line of the Bollinger Bands and closer to the upper line of the Envelopes indicator. The RSI has moved slightly lower from the overbought level of 70. The pair will likely consolidate before the jobs numbers are released.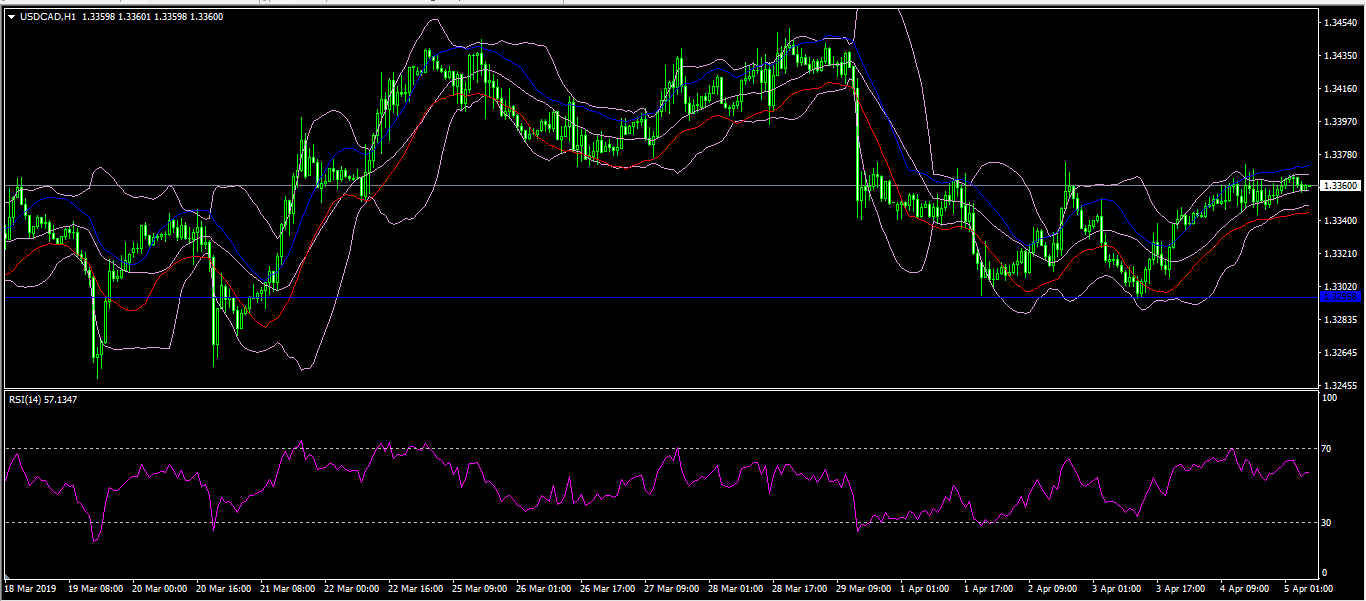
EUR/GBP Daily Outlook
Daily Pivots: (S1) 0.8536; (P) 0.8565; (R1) 0.8612; More...
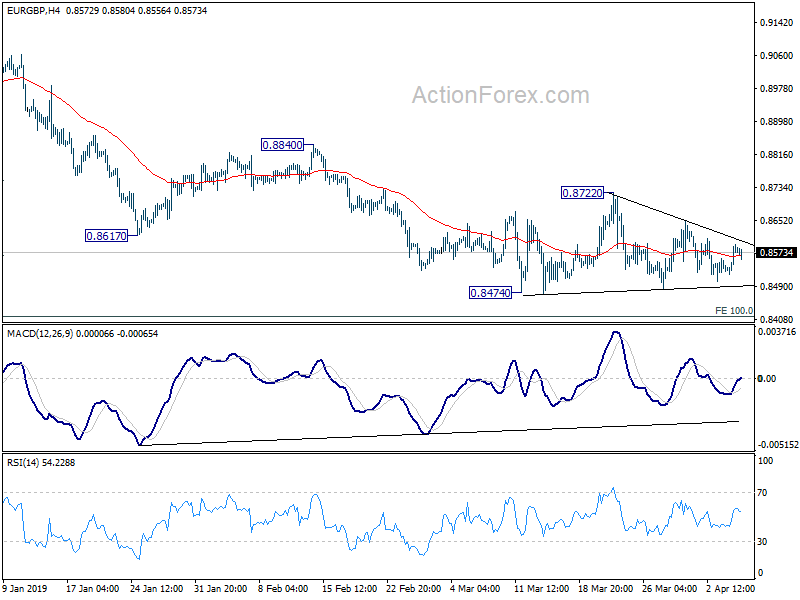
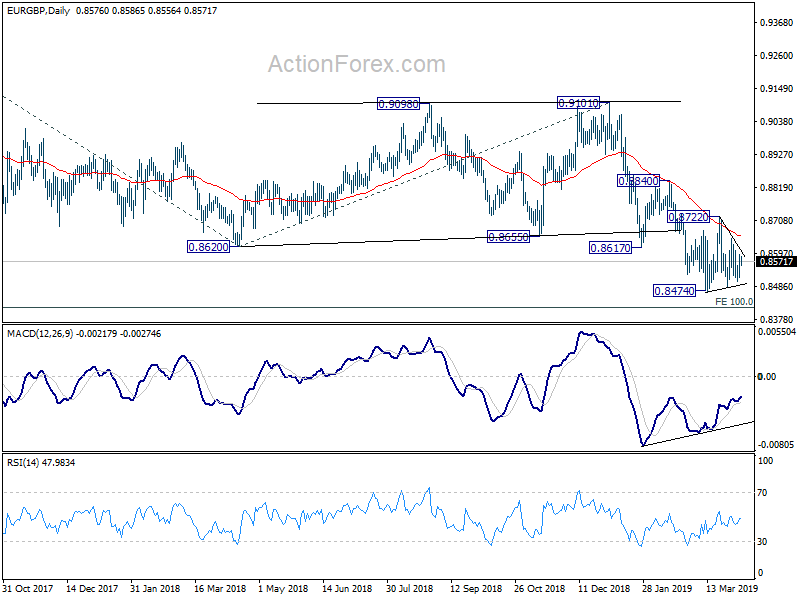
Intraday bias in EUR/GBP remains neutral as consolidation from 0.8474 is extending. Near term outlook remains bearish as long as 0.8722 resistance holds. On the downside, break of 0.8474 will resume larger down trend for 0.8416 long term projection next. On the upside, though, break of 0.8722 will resume the rebound from 0.8474 to 0.8840 resistance first.
In the bigger picture, EUR/GBP is seen as staying in long term range pattern started at 0.9304 (2016 high). Current fall from 0.9305 (2017 high), is a falling leg inside the pattern. Such decline could extend to 100% projection of 0.9305 to 0.8620 from 0.9101 at 0.8416 and possibly below. But for now, we'd expect strong support around 0.8312 support to contain downside and bring rebound.
EUR/AUD Daily Outlook
Daily Pivots: (S1) 1.5747; (P) 1.5780; (R1) 1.5806; More...
Intraday bias in EUR/AUD remains neutral for the moment. Consolidation from 1.5721 might extend further with another rise. But upside should be limited by 1.6122 resistance to bring fall resumption eventually. On the downside, decisive break of 1.5271 will resume the fall from 1.6765 and target 1.5346 support next.
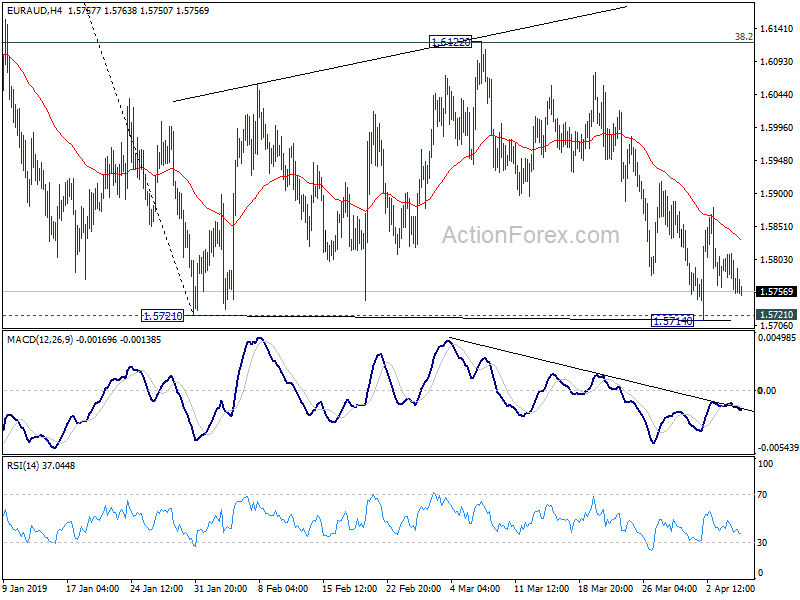
In the bigger picture, as long as 1.5346 support holds, outlook will remain bullish. Uptrend from 1.1602 (2012 low) is expected to resume sooner or later. Break of 1.6765 will target 61.8% retracement of 2.1127 (2008 high) to 1.1602 at 1.7488 next. However, firm break of 1.5346 key support will indicate trend reversal, with bearish divergence condition in weekly MACD, and turn outlook bearish.
USDCAD Hovers Into Ichimoku Cloud, Neutral In Short Term
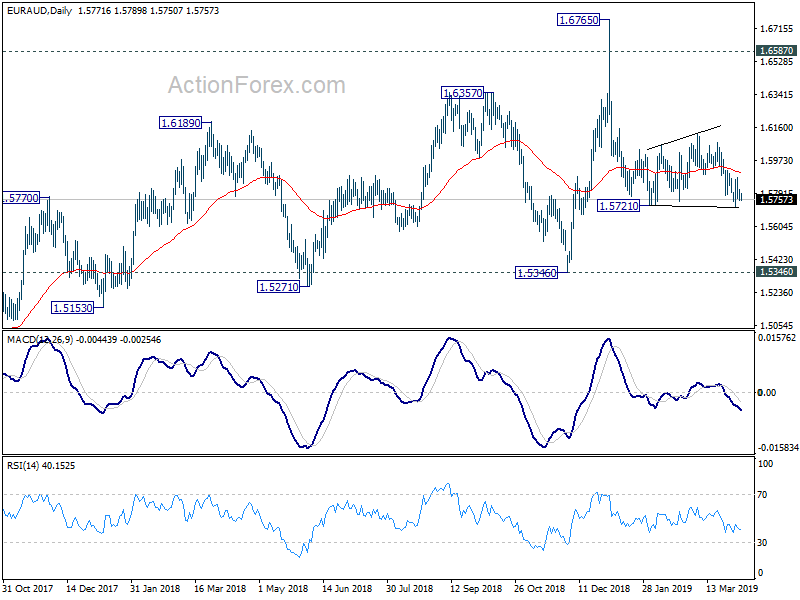
USDCAD, has gained some momentum this week and rebounded around the 1.3295 support for the third time since the start of March and is trying set to exit the Ichimoku cloud. Moreover, the price found strong obstacle around the 20-day simple moving average (SMA), while it is holding above the 23.6% Fibonacci retracement level of the upleg from 1.2250 to 1.3663, around 1.3230. However, in the short-term, the pair hovers within a narrow range of 1.3295 – 1.3465.
The technical indicators are feeding prospects for a marginally positive short-term. The RSI holds near the threshold of 50, however the stochastic completed a bullish cross within the %K and %D lines, suggesting upside tendency. Also, in Ichimoku indicators, the price found strong resistance near the red Tenkan-sen line.
Further improvement may lead the price towards the two-month high of 1.3465 and a successful penetration of this level could drive the market until the 19-month high of 1.3663. In addition, the bulls would need to clear this level to push the rally until the 1.3790 peak, the highest level registered since April 2017, confirming the recent long-term view.
Alternatively, a failure to overcome the upper surface of the Ichimoku cloud, would send the price back down to the 23.6% Fibonacci of 1.3230 before touching 1.3295. Lower, the 1.3250 and the ascending trend line could halt downside movements, but if not, then more losses could follow, probably towards the 38.2% Fibonacci of 1.3120, shifting the bullish structure to neutral.
To sum up, in the long-term timeframe, the market has been developing in an upside movement since February 2018, completing higher highs and higher lows.
EUR/CHF Daily Outlook
Daily Pivots: (S1) 1.1206; (P) 1.1217; (R1) 1.1232; More...
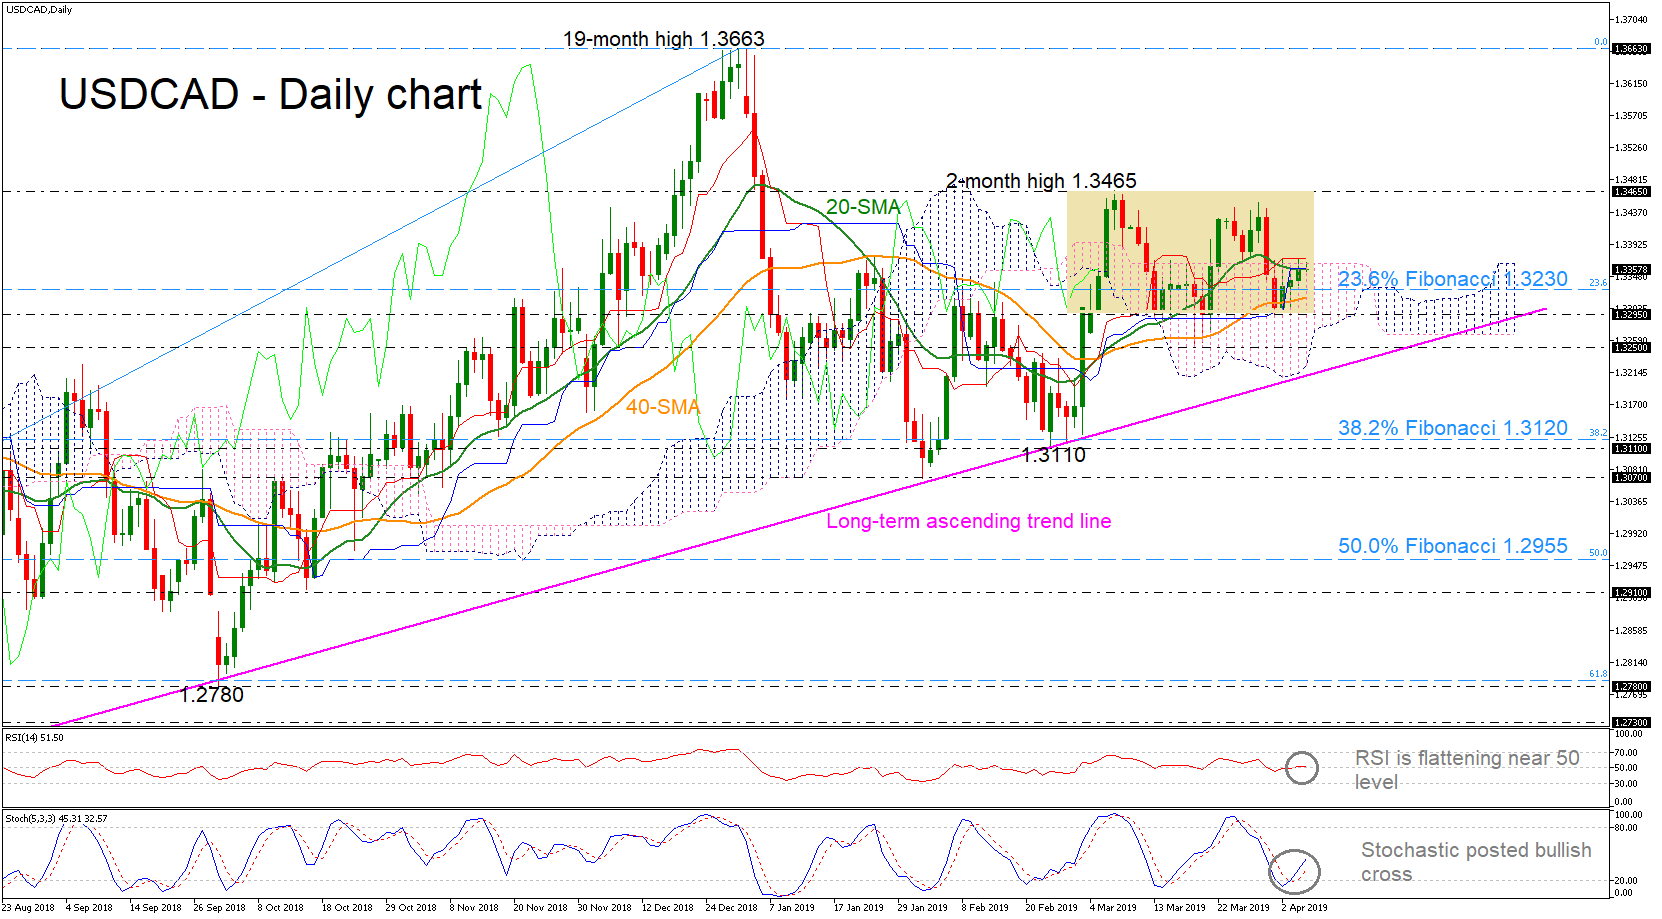
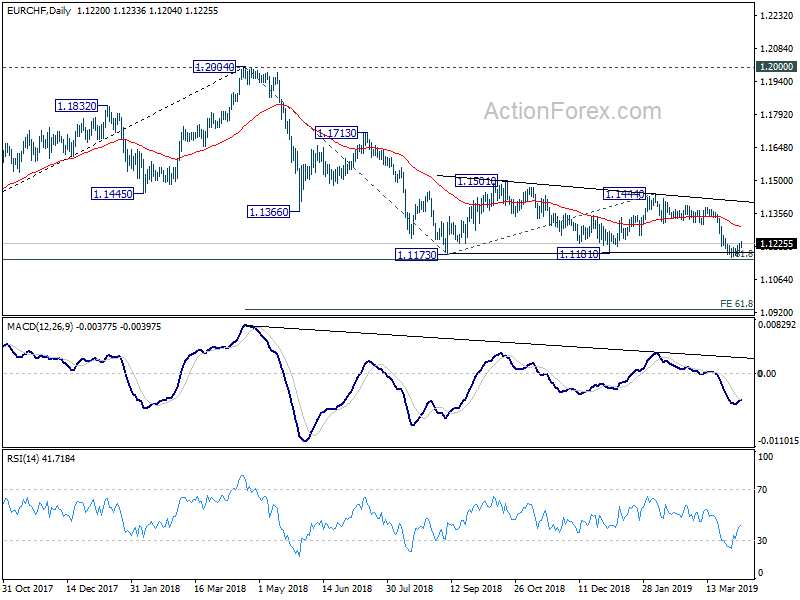
Intraday bias in EUR/CHF remains neutral for the moment and consolidation from 1.1620 might extend. Further decline is still expected as long as 1.1256 minor resistance holds. On the downside, decisive break of 1.1154 key fibonacci level will confirm resumption of whole downtrend from 1.2004. That should then pave the way to 61.8% projection of 1.2004 to 1.1173 from 1.1444 at 1.0930. However, break of 1.1256 will indicate short term bottoming and turn back to the upside for 1.1310 support turned resistance first.
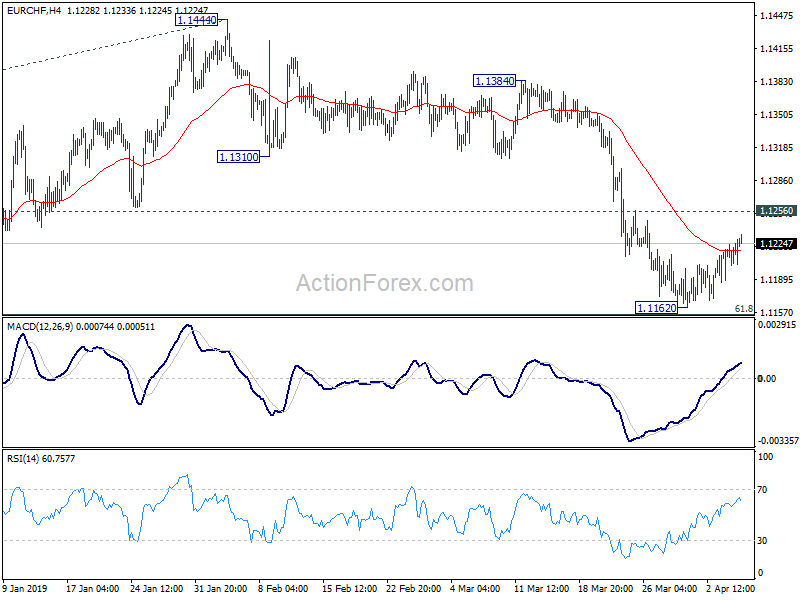
In the bigger picture, multiple rejection by 55 week EMA indicates medium term bearishness. Focus remains on 1.1154/98 support zone (2016 high and 61.8% retracement of 1.0629 to 1.2004 at 1.1154). Decisive break there will confirm resumption of whole down trend from 1.2004 and long term bearish reversal. EUR/CHF should then target 1.0629 support and below. This will now remain the favored case as long as 1.1444 resistance holds.
USD/CAD Daily Outlook
Daily Pivots: (S1) 1.3341; (P) 1.3357; (R1) 1.3378; More...
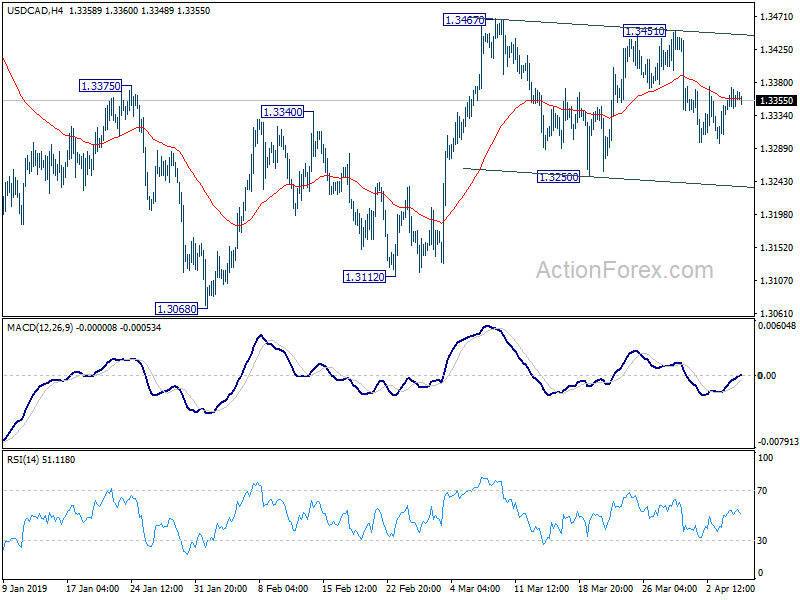
Intraday bias in USD/CAD remains neutral for the moment. On the downside, firm break of 1.3250 support will indicate completion of whole rebound from 1.3068. In that case, deeper fall would be seen back to 1.3068/3112 support zone. On the upside, break of 1.3467 will resume the rebound from 1.3068 and target a test on 1.3664 high.
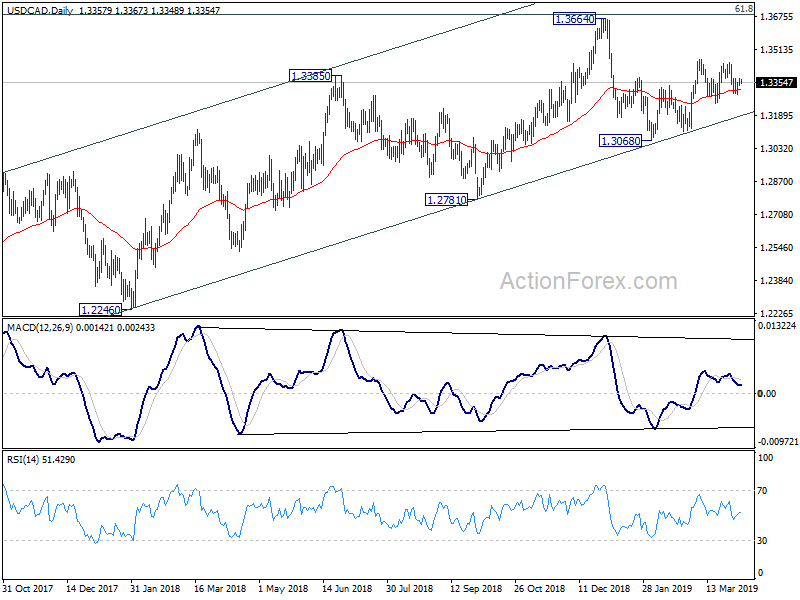
In the bigger picture, structure of the medium term rise from 1.2061 (2017 low) to 1.3664 is not clearly impulsive. Hence, we'd stay cautious on strong resistance from 61.8% retracement of 1.4689 (2016 high) to 1.2061 at 1.3685 and 1.3793 resistance to limit upside, and bring medium term topping. But in any case, medium term outlook will stay bullish as long as channel support (now at 1.3210) holds. Sustained break of 1.3793 will pave the way to retest 1.4689 (2015 high). However, firm break of the channel support should confirm reversal and target 1.2061 low again.
AUD/USD Daily Outlook
Daily Pivots: (S1) 0.7098; (P) 0.7113; (R1) 0.7129; More...
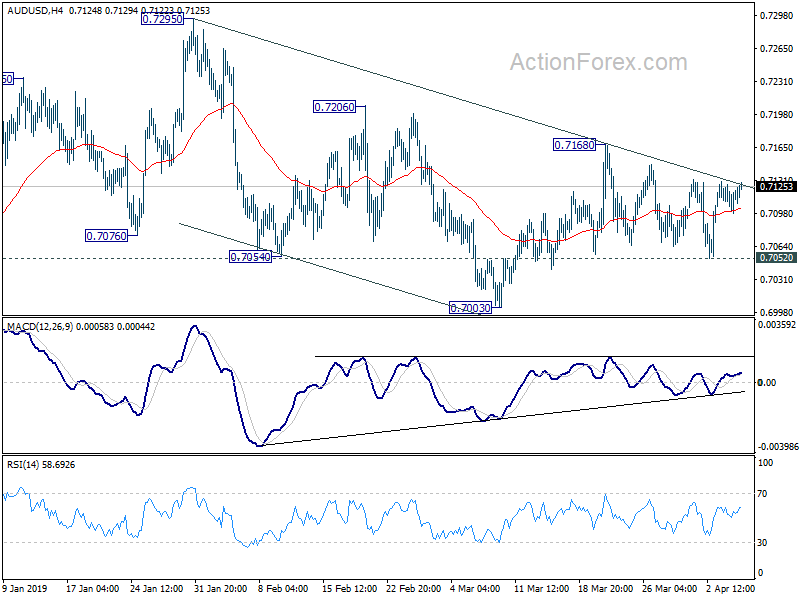
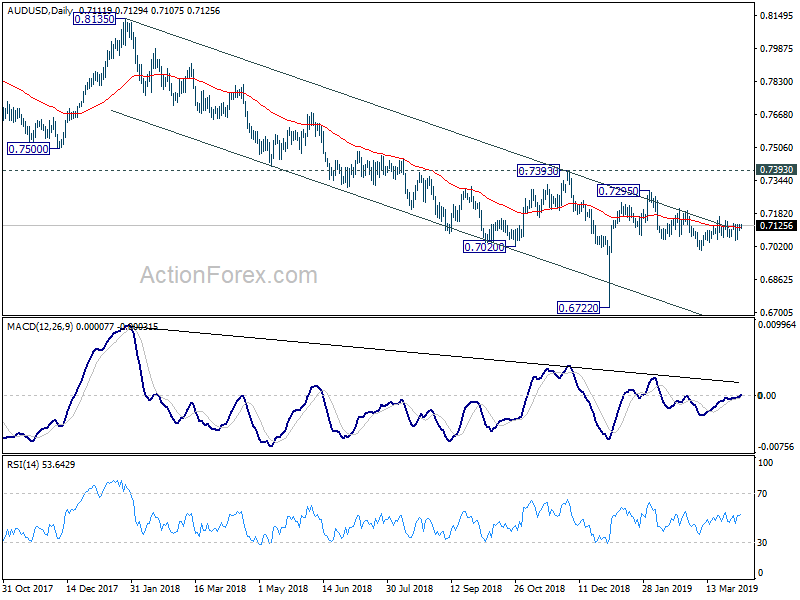
Outlook in AUD/USD remains unchanged and intraday bias stays neutral first. On the downside, firm break of 0.7052 minor support will turn bias to the downside for 0.7003 first. Break will resume the whole decline from 0.7295. On the upside, break of 0.7168 will resume the rise from 0.7003 and turn bias to the upside for 0.7295 resistance. Break will extend the whole rebound from 0.6722 to 0.7393 key resistance level.
In the bigger picture, as long as 0.7393 resistance holds, we'd treat fall from 0.8135 as resuming long term down trend from 1.1079 (2011 high). Decisive break of 0.6826 (2016 low) will confirm this bearish view and resume the down trend to 0.6008 (2008 low). However, firm break of 0.7393 will argue that fall from 0.8135 has completed. And corrective pattern from 0.6826 has started the third leg, targeting 0.8135 again.
EUR/USD Daily Outlook
Daily Pivots: (S1) 1.1200; (P) 1.1225; (R1) 1.1245; More.....
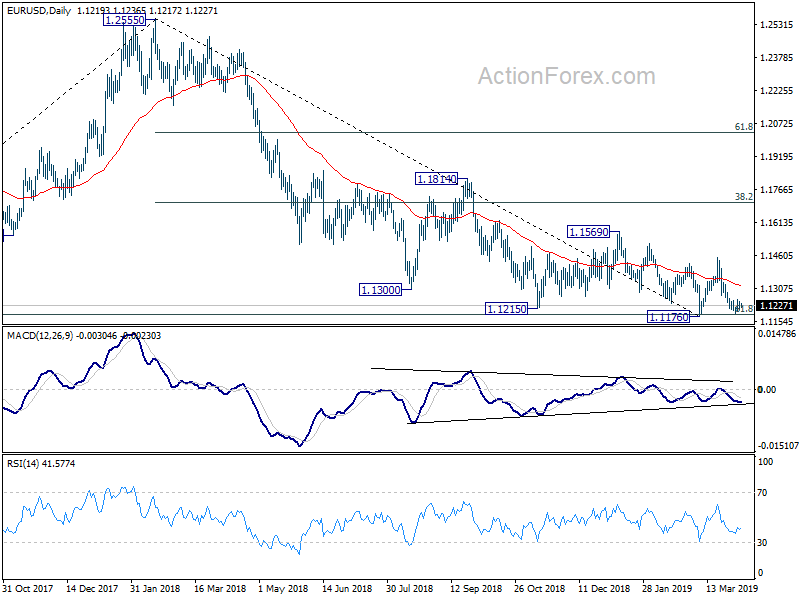
Intraday bias in EUR/USD remains neutral at this point and more sideway trading could be seen. Still, further decline is in favor as long as 1.1273 minor resistance holds. Sustained break of 1.1176 low will resume whole decline from 1.2555. On the upside, however, break of 1.1273 support turned resistance will confirm short term bottoming. Intraday bias will be turned back to the upside for 1.1448 resistance instead.
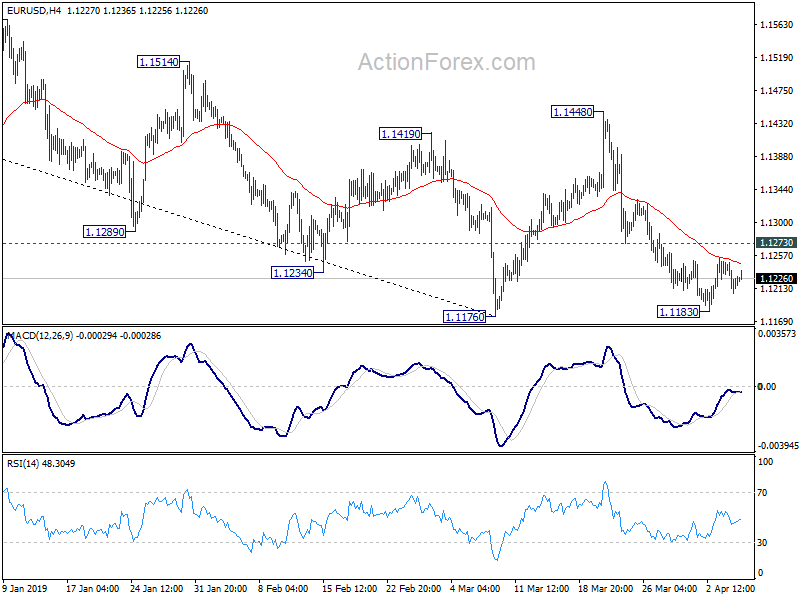
In the bigger picture, medium term weakness was revived as the weak rebound from 1.1176 was rejected well below 55 week EMA and failed to sustain above 55 day EMA. Focus is back on 1.1176 low, with 61.8% retracement of 1.0339 (2016 low) to 1.2555 (2018 high) at 1.1186. Decisive break there will resume whole down trend from 1.2555. Such decline target 1.0339 low next. On the upside, firm break of 1.1569 resistance is needed to be the first sign of medium term bottoming. Otherwise, downside breakout will be in favor.