Sample Category Title
UK PMI manufacturing rose to 13-month high, stepping up Brexit preparations
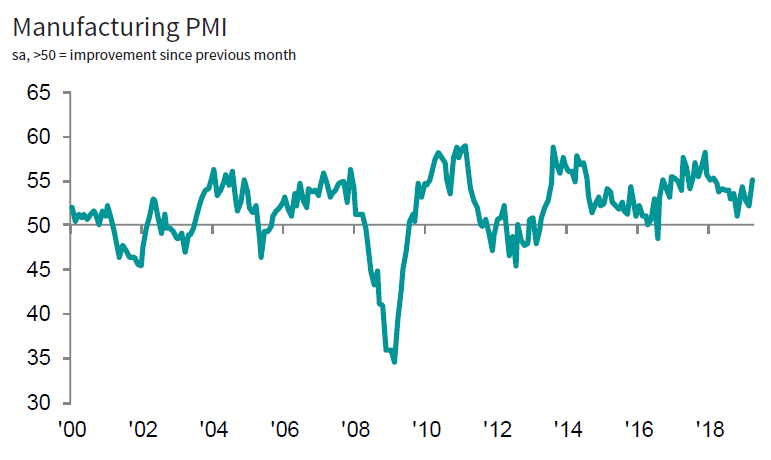
UK PMI manufacturing rose to 55.1 in March, up from 52.1 and beat expectation of 51.2. It's also the highest level in 13 months. Markit noted that stocks of inputs and finished goods rise at record rates. Also, Trends in output, new orders and employment strengthen.
Rob Dobson, Director at IHS Markit, which compiles the survey:
"Manufacturers reported a surge of business activity in March as companies stepped-up their preparations for potential Brexit-related disruptions. Output, employment and new orders all rose at increased rates as manufacturers and their clients raced to build safety stocks. Stocking of finished goods and input inventories surged to new survey-record highs.
"The stock-building boost introduces a major headwind for demand, output and jobs growth moving forward. Manufacturers are already reporting concerns that future trends could be constrained as inventory positions across the economy are unwound. The survey is also picking up signs that EU companies are switching away from sourcing inputs from UK firms as Brexit approaches. It looks as if the impact of Brexit preparations, and any missed opportunities and investments during this sustained period of uncertainty, will reverberate through the manufacturing sector for some time to come."
Gold’s Decline Takes A Pause
Gold prices stalled on Friday after posting strong declines the day before. Price action attempted to retrace the losses from the day before but settled modestly lower on the day. The precious metal remains mixed as investors look to the new trading month and easing concerns about the yield curve.
Will Gold Bounce Off the Support?
XAUUSD prices settled at the support area of 1290 on Friday and are seen posting a rebound off the level earlier today. The Stochastics on the 4-hour time frame indicates a move from the oversold level. There is scope for a rebound which could see a correction toward 1306 at the very least. However, price needs to break above the near term highs of 1299 – 1300.
Yen Trades Mixed on Tankan Survey
The Bank of Japan's quarterly Tankan surveys showed a mixed result. Manufacturing sector eased to 12, falling from 19 in the previous quarter and missing estimates. The nonmanufacturing sector was also lower at 21, easing from 24 in the previous quarter. Both the surveys missed the median estimates and came out lower than expected.
Can the USDJPY Maintain the Gains?
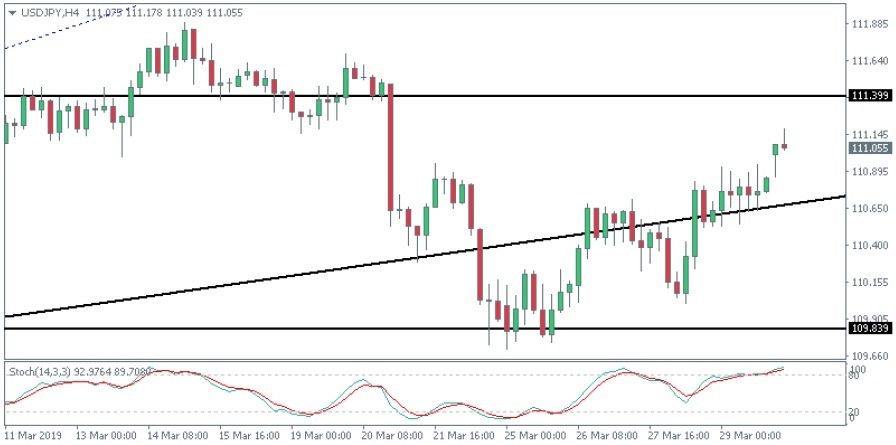
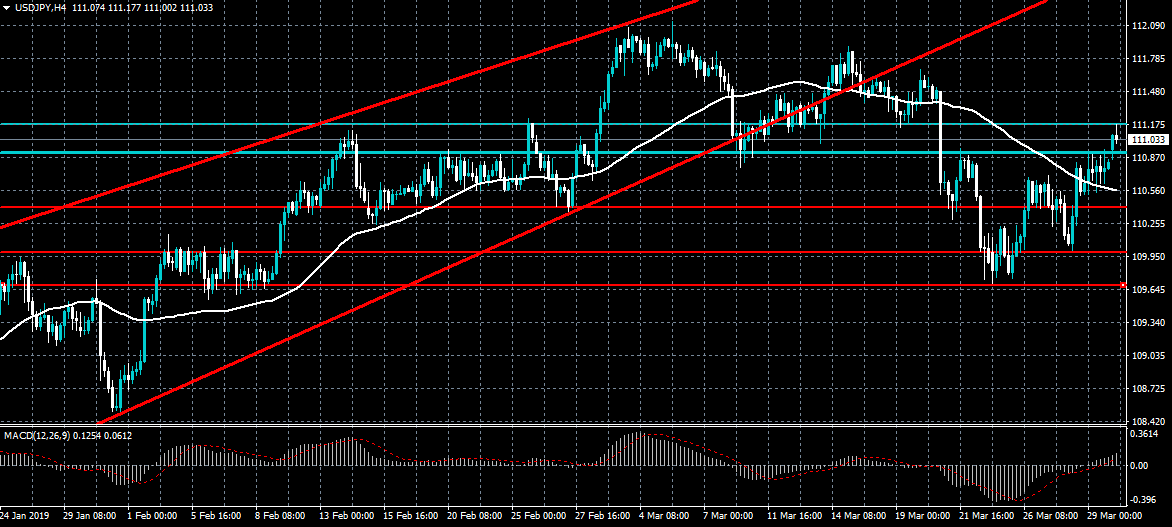
The USDJPY currency pair gapped higher on today's open and price action is likely to test the upside near 111.40. Establishing resistance here could potentially confirm the medium term sideways range between 111.40 and 109.84 levels. The bias shifts only if the USD/JPY will be able to break out past 111.40.
USD Holds Gains On Better Than Expected Economic Data
The U.S. dollar managed to hold on to the gains on the last trading day of the month. On the economic front, the personal consumption expenditure data showed a 0.2% increase on the month in February. This was a modest increase from 0.1% in January. New home sales rose 4.9% in February.
Will the Euro Move Higher?
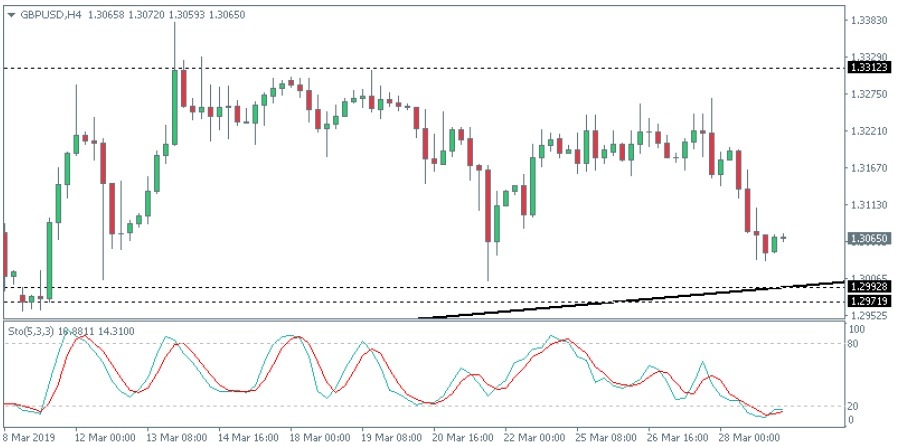
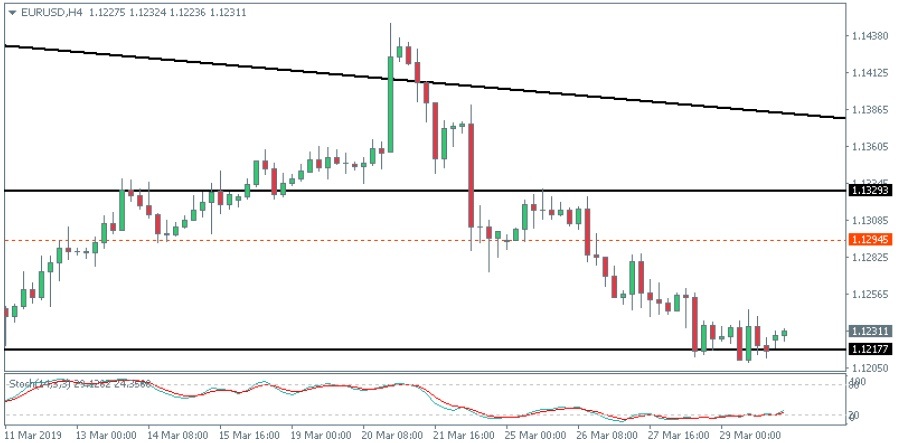
The EURUSD currency pair has been trading subdued as it approached the support area of 1.1217. The Stochastics have turned flat near the oversold levels and this could indicate a modest bounce to the upside. The near term support at 1.1294 remains a key level of interest to the upside. If the euro fails to recover off the current support, we expect a test of 1.1174 to the downside.
EURUSD 1.1216 Key Support Level
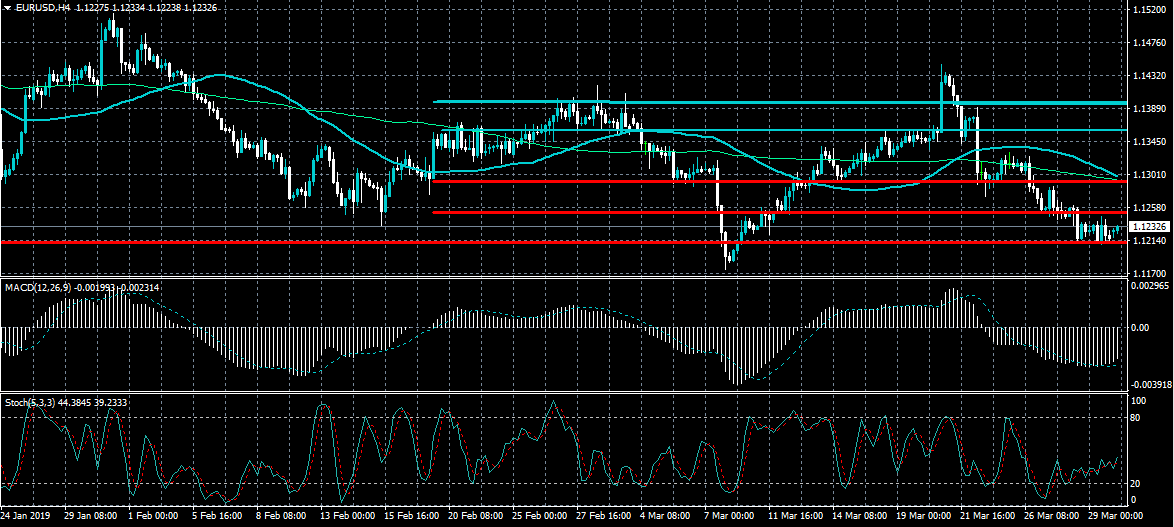
The euro is under slight pressure against the US dollar on Monday after the pair suffered its weakest monthly price close since June 2017. The EURUSD pair has a strong bearish bias while trading above the 1.1216 level, as it represents the neckline of a large head and shoulders pattern. Traders should note the 1.1310 level offers the strongest form of weekly resistance for the EURUSD pair.
The EURUSD pair is bearish while trading below the 1.1216 level, key technical support is found at the 1.1170 and 1.1110 levels.
If the EURUSD pair trades above the 1.1216 level, buyers may test back towards the 1.1250 and 1.1310 resistance levels.
BTCUSD Above Neckline Support
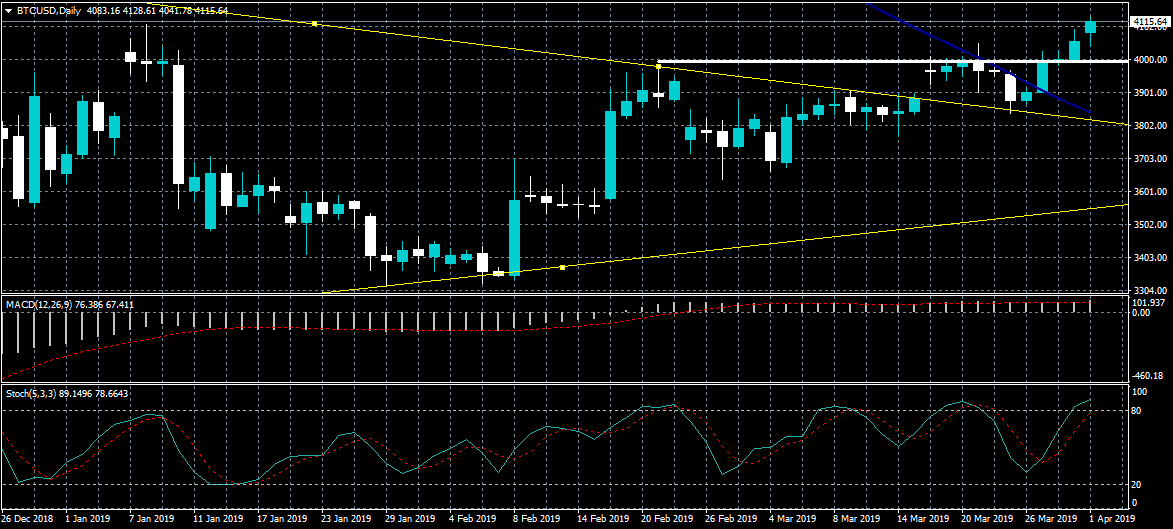
Bitcoin has opened the new trading month supported by bullish sentiment after the BTCUSD pair closed the week above its 100-day moving average for the first time since July 2018. The BTCUSD pair is also supported by the bullish pattern on the four-hour time frame, with both inverted head and shoulders and triangle breakout in play. The overall intraday bullish bias will remain in place while price trades above the $3,975 level.
The BTCUSD pair is intraday bullish while trading above the $3,975 level, key technical resistance remains at the $4,225 and $4,400 levels.
If the BTCUSD pair trades under the $3,975 level, sellers may test towards the $3,850 and $3,650 support levels.
Eurozone PMI manufacturing finalized at 47.5, lowest since 2013
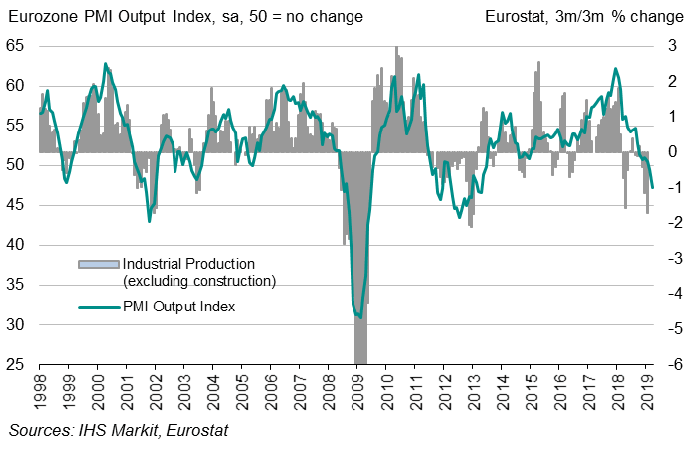
Eurozone PMI manufacturing was finalized at 47.5 in March, revised down from 47.6, down from February's 49.3. It's also the lowest level since April 2013, and the second straight months of sub-50 reading. Markit noted there was the biggest monthly decline in new orders since late 2012. Also, confidence hits lowest level in over six years.
Among the countries, Germany PMI manufacturing was revised further lower to 44.1, an 80-month low. Italy PMI manufacturing was at 47.4, 70-month-low. France PMI manufacturing was revised down to 49.7, below 50, but it's just a 3-month low. Australian PMI manufacturing was at 48-month low at 50.0. Netherlands PMI manufacturing was at 33-month low at 52.5. However, Greece PMI manufacturing was at 54.7, 12-month high.
Commenting on the final Manufacturing PMI data, Chris Williamson, Chief Business Economist at IHS Markit said:
"The March PMI data indicate that the eurozone's manufacturing sector is in its steepest downturn since the height of the region's debt crisis in 2012. The survey is indicative of output falling at a quarterly rate of approximately 1% in March, suggesting that the January rebound from one-off factors late last year seen in the latest official data is likely to prove short lived.
"Looking at the forward-looking indicators, downside risks have intensified, and the trend could clearly deteriorate further in the second quarter. New orders are falling at a rate not seen since 2012, and disappointing sales mean warehouses are filling with unsold stock. The orders-to-inventory ratio – a key indicator of the future production trend – is at its lowest for almost seven years. Expectations of output for the coming year are also the gloomiest since 2012.
"Concerns over trade wars, tariffs, rising political uncertainty, Brexit and – perhaps most importantly – deteriorating forecasts for the economic environment both at home and in export markets, were widely reported to have dampened business activity and confidence.
"Cost cutting has become more evident as firms grow more risk averse, notably with respect to hiring. Job losses were reported in both Germany and Italy, where the downturn in demand is doing the most damage. However, France's manufacturing sector is also now back in decline, Austria's goods-producing sector has stalled, Spain is close to stagnation and growth has lost considerable momentum in the Netherlands, highlighting the increasingly broad-based nature of the current deterioration."
USDJPY 110.90 Key Weekly Pivot
The US dollar has opened the new trading month with a slight bullish bias against the Japanese yen currency after the Chinese economy posted better than expected manufacturing data. The USDJPY pair has a strong bullish intraday bias while trading above the 110.90 level, which is the key weekly pivot point. The 111.60 level offers the strongest form of near-term resistance above the 111.00 resistance level.
The USDJPY pair has a bullish bias while trading above the 110.90 level, key resistance is found at the 111.20 and 111.60 levels.
If the USDJPY pair fails to move price above the 110.90 levels, sellers may test back towards the 110.68 and 110.40 levels.
Aussie Gains After Impressive Manufacturing PMI From China
The Australian dollar gained after data from China showed a rebound in manufacturing activity. The data released on Sunday showed that in March, the manufacturing PMI rose to 50.5. This was better than the consensus estimates of 49.5. It was also the best number this year after contracting in the past four months. As proof of the improving sentiment, the Caixin Manufacturing PMI released today rose to 50.8. The non-manufacturing PMI rose to 54.5, which was in line with expectations. The positive manufacturing activity from China is a good way to start the second quarter because one of the biggest fears in the market this year has been the slowing global economy, led by China.
The Japanese yen declined after data from Japan showed some weakness. In the first quarter, the Tankan large manufacturers index declined to 12 from the previous 19. Similarly, the large non-manufacturers index declined to 21 from the previous 24. These numbers rate the relative level of general conditions in the two sectors and this year, they have been on a downward trajectory. The large manufacturer's index peaked in the fourth quarter of 2017 when it reached 25.
It will be a busy data-day as traders receive the PMI data from around the world. In Spain, the PMI is expected to remain at 49.5 while in Switzerland, it is expected to decline to 53.6. In Italy, it is expected to decline to 47.6 (from 47.7), while in France and Germany, the PMI is expected to remain unchanged at 49.8 and 44.7 respectively. For the UK, the PMI is expected to decline slightly to 51.2. Other important data expected today are the EU’s CPI, which is expected to remain at 1.5%.
In the United States, the PMI data from the Institute of Supply Management (ISM) is expected to show that activity remained unchanged at 54.2 while that from Markit is expected to show that activity remained unchanged at 52.5. In addition, the retail sales are expected to show a slight gain of 0.3% while the core retail sales are expected to decline slightly by 0.4%.
AUD/USD
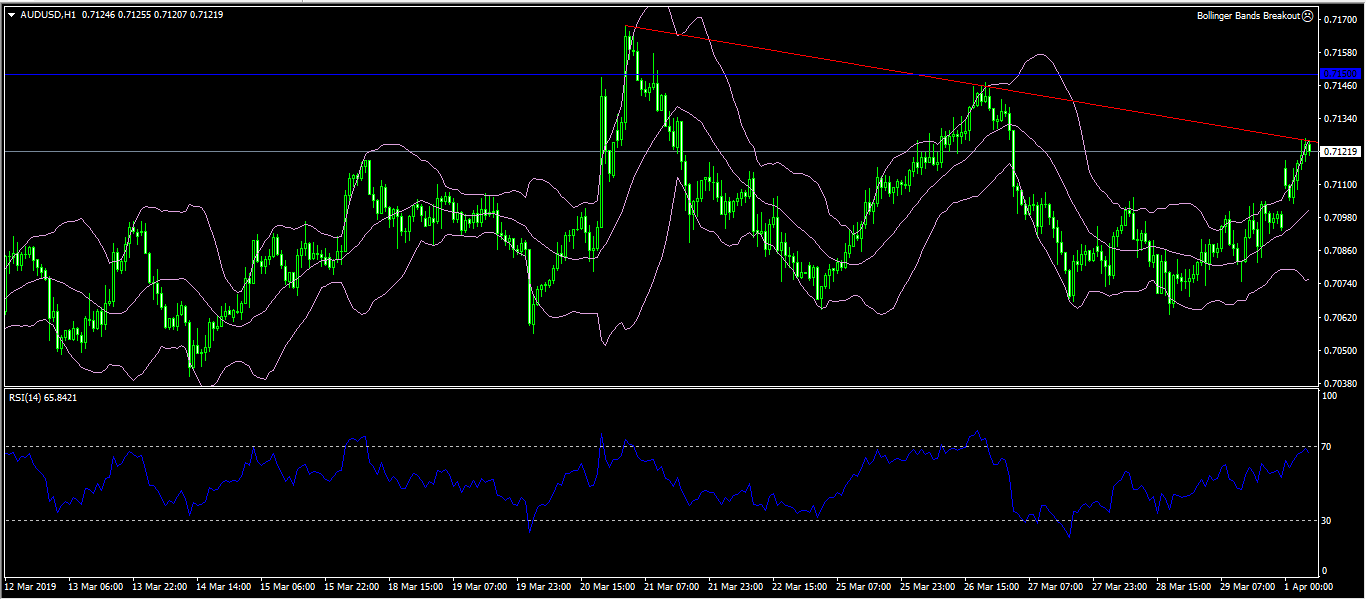
It was a positive quarterly start by the Aussie following the positive manufacturing activity from China. The AUD/USD pair rose to a high of 0.7125, which was the highest level since Wednesday. It is now trading at the 0.7122 level, which is along the upper line of the Bollinger Bands while the RSI has moved to almost the overbought level. The price is also along an important trendline as shown below. The pair will likely continue moving upwards to test the important resistance level of 0.7150.
USD/JPY
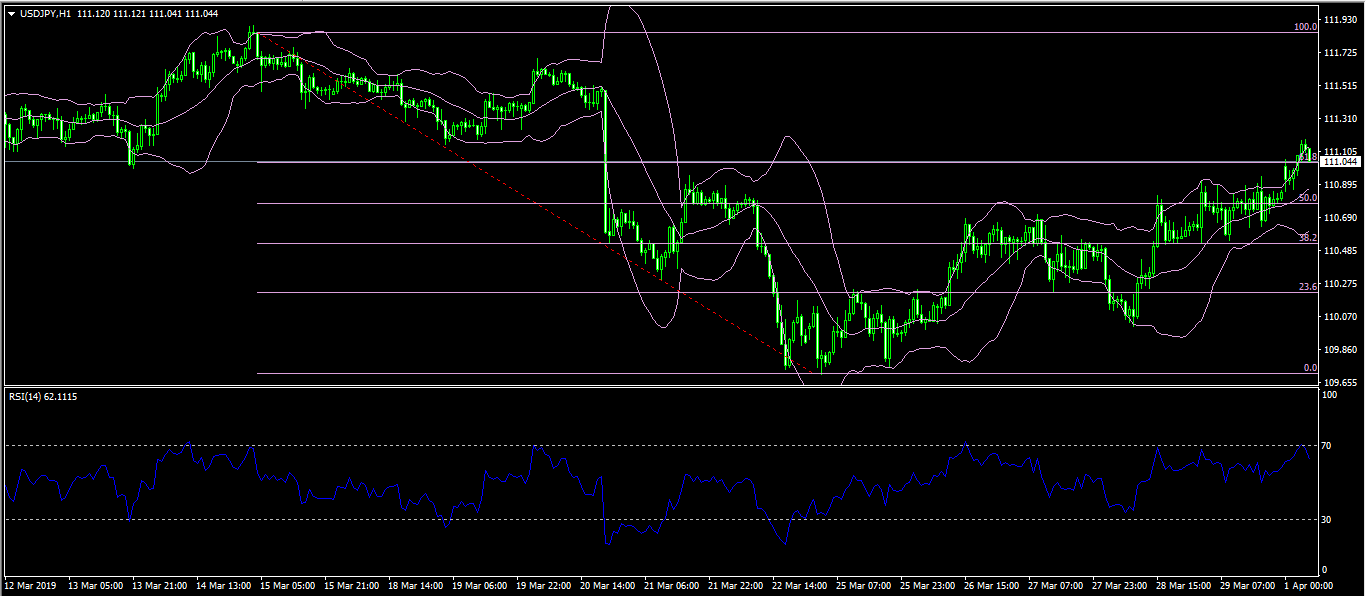
The USD/JPY pair rose after the weak economic numbers from Japan. It reached a high of 111.13, which was the highest level since March 20. On the hourly chart below, the pair is slightly lower than the upper line of the Bollinger Bands while the RSI has dropped slightly from the overbought level. It is also in the third phase of the impulse Elliot Wave, which is a sign that it could decline slightly to the 50% Fibonacci Retracement level before continuing the upward trend.
EUR/USD
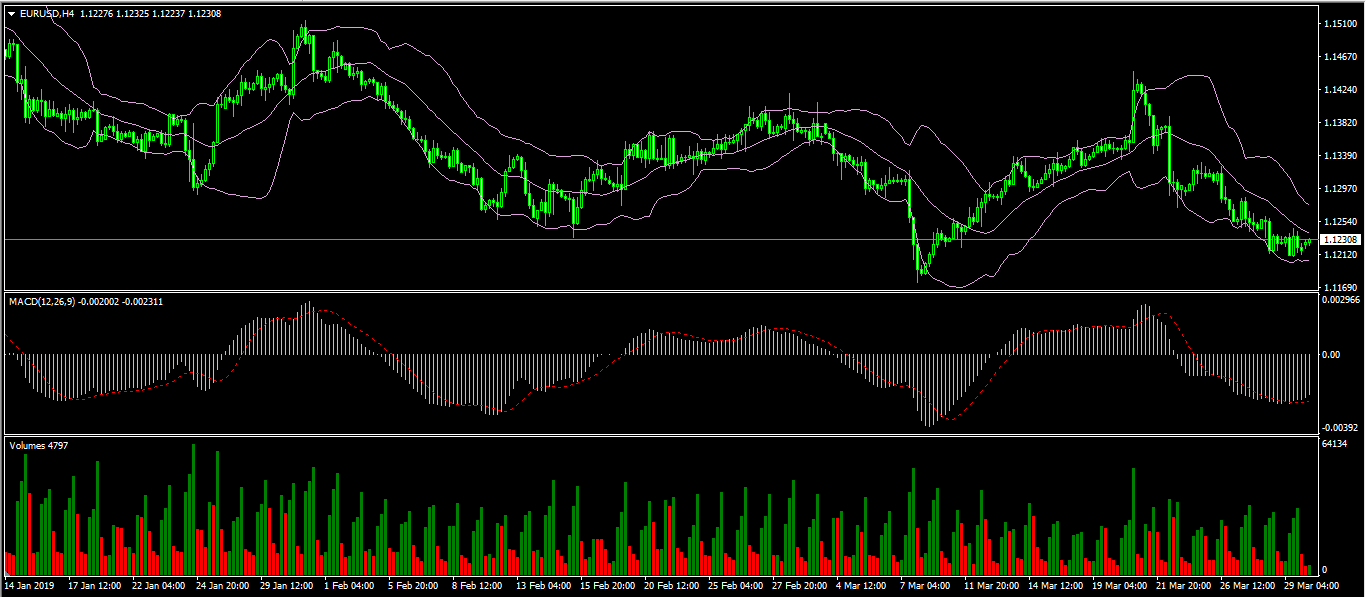
After the sharp declines of the past few days, the EUR/USD found support today at the 1.1230 level. On the hourly chart below, the pair is along the middle line of the Bollinger Bands while the MACD is still in the negative side. The volumes have declined, which is a sign that the downward trend could continue until the pair tests the 1.1200 level.
Crude Oil Supported By A Rising Trend Line
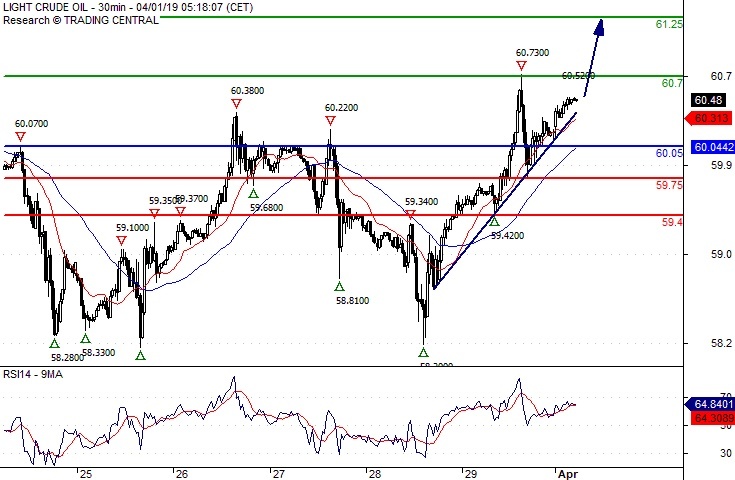
Pivot (invalidation): 60.05
Our preference Long positions above 60.05 with targets at 60.70 & 61.25 in extension.
Alternative scenario Below 60.05 look for further downside with 59.75 & 59.40 as targets.
Comment The RSI is bullish and calls for further upside.