Sample Category Title
Lest We Quickly Forget
Lest we quickly forget
Last Friday's mini-meltdown on equities appears to have been quickly consigned to history. Investors ignored quite poor housing data and lower US consumer confidence numbers, preferring to follow Europe's lead where bourses finished the day solidly in the black. Wall Street closed higher with the S&P 500 rising 0.72%, the Dow Jones up 0.55% and the Nasdaq up 0.71% with the previously-unloved financial and energy sectors leading the way.
As markets finally concluded that a minuscule one-day yield-curve inversion is not a prelude to global economic Armageddon the very next day, US Treasury yields rose ever so slightly along with oil while gold gave up some of its recent gains. Only the greenback stood firm as FX traders are a gnarled and sceptical lot, the US dollar index rising 0.21% to 96.77 as the flatline in FX volatility continues in 2019.
The volte-face in sentiment suggests to me that despite all the noise, markets are flip-flopping on short-term data as we await the conclusion of the only real game in town, the US-China trade talks. Last Friday's sell-off was just as likely about excessive long positioning in equities and risk assets as it was about dire predictions by an oracle-like bond market. If last night's poor data had come out on Monday for example, a deeper sell-off and more global hand wringing would likely have ensued.
The US Consumer Confidence print at 124.10 (versus the expected 132.5) late in the New York session was a big miss and may give Asian traders food for thought before hitting the buy button on risk assets today.
The Reserve Bank of New Zealand announces its rate decision at 0900 Singapore time this morning with markets expecting this to remain unchanged at 1.75%. As ever, the devil will be in the detail, and it will be the accompanying comments that will carry the most weight.
FX
The US dollar held firm overnight although we saw some emerging market currencies regain some of their losses as the weekend panic subsided, most notably the Turkish lira (TRY), which rallied 2% just before Europe's open on stop-loss buying and the Turkish central bank squeezing rates to defend it.
The greenback continues to mark time against the majors as FX markets exhibit fewer mood swings than the bond or equity markets.
Equities
Asia's stock market should open higher today following sprightly sessions in Europe and North America. Although Wall Street ignored the rather poor US housing and consumer confidence data, Asia may find its irrational exuberance tempered by it and gains may be more modest. As ever these days, we are just one headline away from a U-turn in sentiment so traders would be wise to remain nimble.
Oil
Oil gained overnight as confidence returned to global markets as quickly as it vanished over the weekend. Brent crude rose 1.25% to USD68.80 a barrel and WTI rose an impressive 2% to regain the USD60.00 a barrel handle. Traders are going back to their go-to analysis of OPEC+ cuts, Venezuela and Iran to find a news story to fit the price action.
Gold
Gold fell 0.50% to USD1,315.50 an ounce as markets reinstated risk trades and unwound safe havens. The pullback is more noise than substance, and overall, gold's technical picture remains very constructive.
Eco Data 3/27/19
[php_everywhere instance="1"]
Gold Slips Despite Soft U.S. Numbers, Investors Remain Concerned about Economy
Gold has posted considerable losses on Tuesday, erasing the gains seen on Monday. In North American trade, the spot price for one ounce of gold is $134.52, down 0.56% on the day. In economic news, Building permits slowed to 1.30 million, shy of the estimate of 1.32 million. Housing starts also slowed, falling to 1.16 million, down from 1.23 million in the previous release. There was more bad news, as CB consumer confidence fell sharply to 124.1, well below the estimate of 132.1 points.
U.S. data was softer than expected on Tuesday, but gold failed to take advantage. Gold gained ground last week and posted more gains on Monday, as risk apprehension has since the Federal Reserve policy meeting last week. At the meeting, policymakers were sharply dovish, indicating that the Fed planned to hold interest rates for the remainder of the year. As well, the Fed lowered its growth forecast for 2019 to 2.1%, down from 2.3% in December. There was more bad news on Friday, as the spread between 3-month and 10-year Treasury notes turned negative for the first time since 2007, pointing to an inverted yield curve, which could point to a recession. All eyes will be on U.S. Final GDP, which will be released on Thursday. If GDP misses the forecast of 2.4%, investors could get jittery and flee to the gold, a traditional safe-haven asset.
British Pound Edges Higher as U.S. Consumer Confidence Sags
GBP/USD has edged higher in Tuesday session. In North American trade, the pair is trading at 1.3221, up 0.17% on the day. On the release front, British mortgages slumped to their lowest level in almost six years. The February reading of 35.3 thousand was well below the forecast of 39.4 thousand. It was also a disappointing day for U.S. releases. Building permits slowed to 1.30 million, shy of the estimate of 1.32 million. CB consumer confidence fell sharply to 124.1, well below the estimate of 132.1 points. On Wednesday, the U.K. publishes CBI Realized Sales.
Another vote in parliament, another defeat for Theresa May. On Monday, lawmakers voted to wrestle control of the Brexit process away from the government. Parliament will now vote on Wednesday on various non-binding alternatives. These could range from a hard Brexit to holding a second referendum. The EU extended the March 29 Brexit deadline last week. If May’s withdrawal deal fails to pass for a third time, the U.K. would leave the EU on April 12 without a deal. If May’s deal is approved, the deadline would be extended until May 22. With plenty of Brexit drama ahead, we could see some swings from the British pound during the week.
The Federal Reserve has become more dovish, leaving investors in a glum mood. At last week’s meeting, policymakers indicated they had no plans to raise interest rates in 2019 and also lowered its growth forecast for 2019 to 2.1%, down from 2.3% in December. There was more bad news on Friday, as the spread between 3-month and 10-year Treasury notes turned negative for the first time since 2007, pointing to an inverted yield curve. All eyes will be on U.S. Final GDP, which will be released on Thursday. If GDP is weaker than expected, the U.S. dollar could lose ground.
Volatility Continues for Yen, U.S. Data Disappoints
After a listless start to the week, USD/JPY has posted considerable gains on Tuesday. In Tuesday’s North American session, the pair is trading at 110.56, up 0.54% on the day. In the U.S., economic data disappointed. Building permits slowed to 1.30 million, shy of the estimate of 1.32 million. CB consumer confidence fell sharply to 124.1, well below the estimate of 132.1 points. In Japan, BoJ Core CPI, dropped to 0.4%, down from 0.5% in the previous release.
Japan’s economy remains fragile, with exports down due to the global trade war. BoJ policymakers remain nervous, and the summary of opinions from the March policy meeting indicated that members debated whether to ramp up stimulus in order to boost the economy. There are concerns that the economy could be heading towards a recession, given the weak global climate and the tax hike scheduled for October.
The Federal Reserve has become more dovish, leaving investors in a glum mood. At last week’s meeting, policymakers indicated they had no plans to raise interest rates in 2019 and also lowered its growth forecast for 2019 to 2.1%, down from 2.3% in December. There was more bad news on Friday, as the spread between 3-month and 10-year Treasury notes turned negative for the first time since 2007, pointing to an inverted yield curve. All eyes will be on U.S. Final GDP, which will be released on Thursday. If GDP is weaker than expected, investors could lose their risk apetite and the safe-haven yen could get a boost.
Inverted Yield Curve: Is It Different This Time?
The recent inversion of the yield curve is not very significant in a historical context, and previous Fed purchases of Treasury securities for its QE program means that the curve is probably flatter than it otherwise would be.
How Inverted Does the Yield Curve Need To Be?
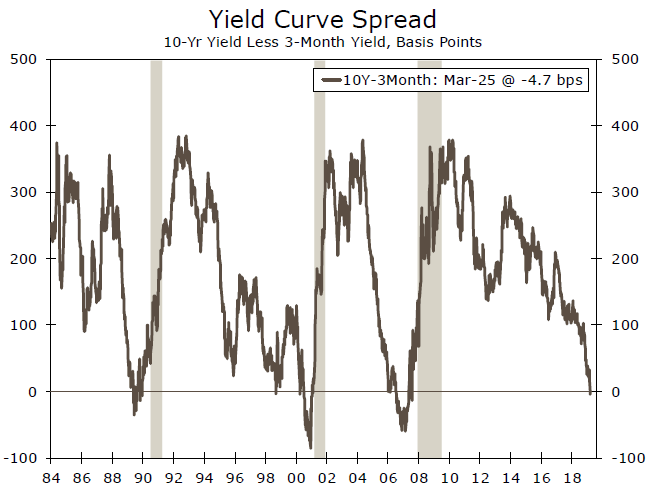
The financial press has been filled with stories in recent days about the inversion of the yield curve, which historically has been a reliable predictor of recession. Indeed, the yield on the 10-year U.S. Treasury security moved below the yield on the 3-month T-bill on March 22, and the spread stood at -5 bps on March 25. Is a recession around the corner?
Let's start by putting the recent inversion of the yield curve into perspective. As shown in the top chart, the curve inverted in July 2006, 17 months before the start of the Great Recession. The spread of the 10-year note over the 3-month bill fell to as much as -60 bps in early 2007. During the previous cycle, the curve inverted 8 months before the start of the recession in March 2001, and the yield spread fell to nearly -100 bps in late 2000. In other words, the degree of yield curve inversion at present is insignificant relative to previous cycles. The curve would probably need to invert significantly and remain inverted for weeks, if not months, before it would be a reliable recession signal.
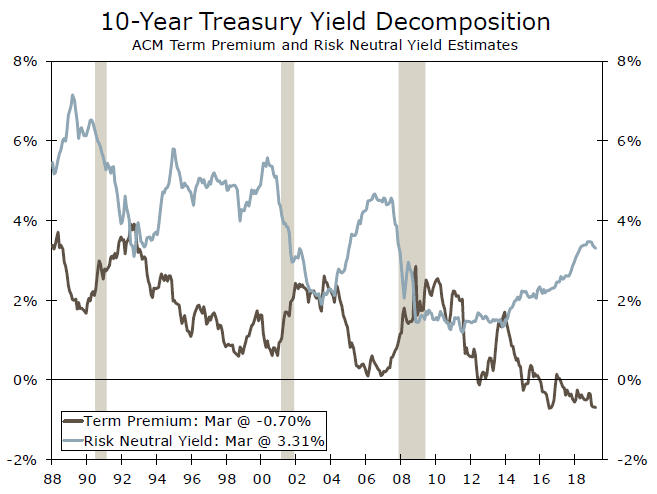
Even so, there is some question about the reliability of the yield curve as a recession predictor at present. The purchase of Treasury securities by the Federal Reserve as part of its quantitative easing (QE) program collapsed the term premium on longer-dated Treasury bonds (middle chart). Researchers at the Fed estimate that the $1.5 trillion of QE purchases of Treasury securities reduced the term premium about 60 bps.1 The Fed has subsequently allowed about $300 billion of Treasury securities to roll off its balance sheet, but the yield on the 10-year Treasury security today is still arguably lower than it otherwise would be. In the absence of QE purchases, there probably would be a positive slope between the 3-month bill and the 10-year note at present.
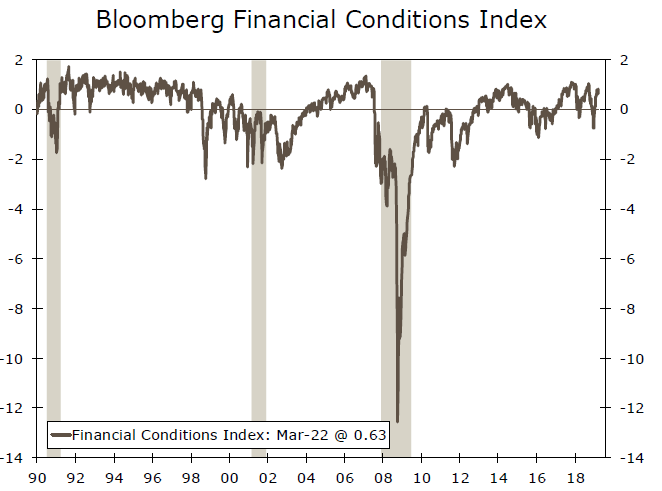
Furthermore, the yield curve is really the only indicator that is signaling any sense of trouble at present. As shown by an index that is compiled by Bloomberg, financial conditions are not all that restrictive at present (bottom chart). The stock market generally remains supported, credit spreads generally remain tight and growth in bank lending remains positive. The financial crisis of a decade ago was obviously an extreme period, but overall financial conditions are less restrictive today than they were last December or around the time of the Russian debt default in 1998 or in the months leading up to the 2001 recession.
The recent inversion of the yield curve is interesting but, in our view, it does not necessarily signal that recession is around the corner. We would need to see a further sustained inversion of the curve along with generalized restriction in financial conditions in conjunction with deterioration in economic fundamentals before we would become truly worried. Stay tuned.
Consumers Struggling to Regain Lost Mojo
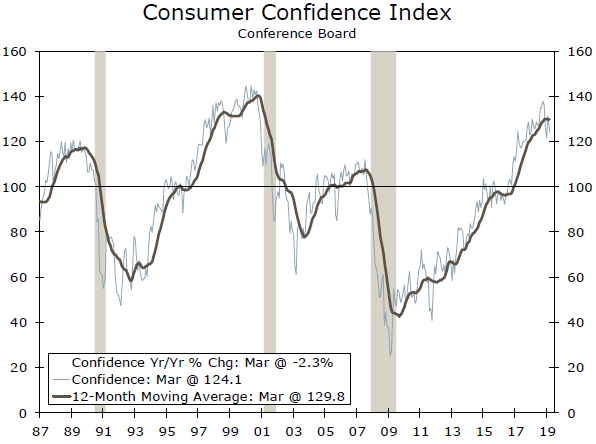
Down in four out of the past five months, consumer confidence is in a soft patch. It is still elevated by historical standards so we're not yet worried about a retrenchment in spending, but last year's sugar high has worn off.
Consumer Confidence Slips in March
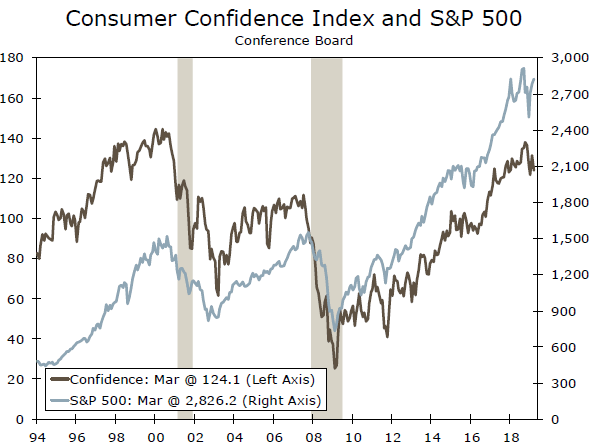
- Consumers' confidence continued to moderate in March, with the consumer confidence index falling 7.3 points to 124.1. That puts the index 13.8 points below where it was in October—before confidence was shaken in the final two months of last year.
- The stock market selloff late last year likely played a role, and though equities have retraced some lost ground, the marketrelated dent to confidence has yet to be fully restored.
Some Softening in the Tight Labor Market
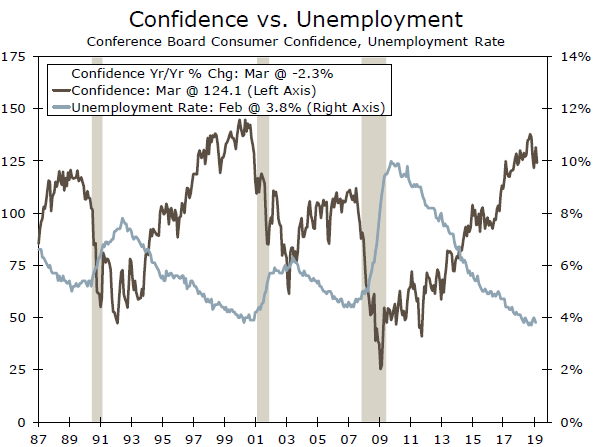
- Confidence is also a reflection of the labor market—which remains supportive of sentiment—but is starting to show some cracks in the foundation. The share of consumers who see jobs as plentiful fell to the smallest share since June even as those who see jobs as hard to get rose for the second time in two months.
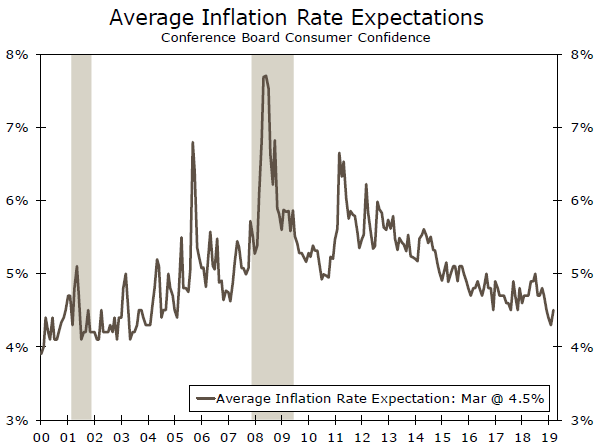
- Gas prices were largely higher in March, which may be behind the rise in average inflation expectations, a bit of a trend reversal.
GBP/CAD Found Buyers In Blue Box And Rallied
Hello fellow traders. In this technical blog we're going to take a quick look at the Elliott Wave charts of GBPCAD. As our members know GBPCAD is showing incomplete bullish sequences in the cycle from the August 15th 2018 low. Break of the 01/25 peak made the pair bullish against the 1.697 pivot. Consequently, we advised members to avoid selling the pair and keep on favouring the long side. In the following article, we're going to explain the Elliott wave structure and Forecast.
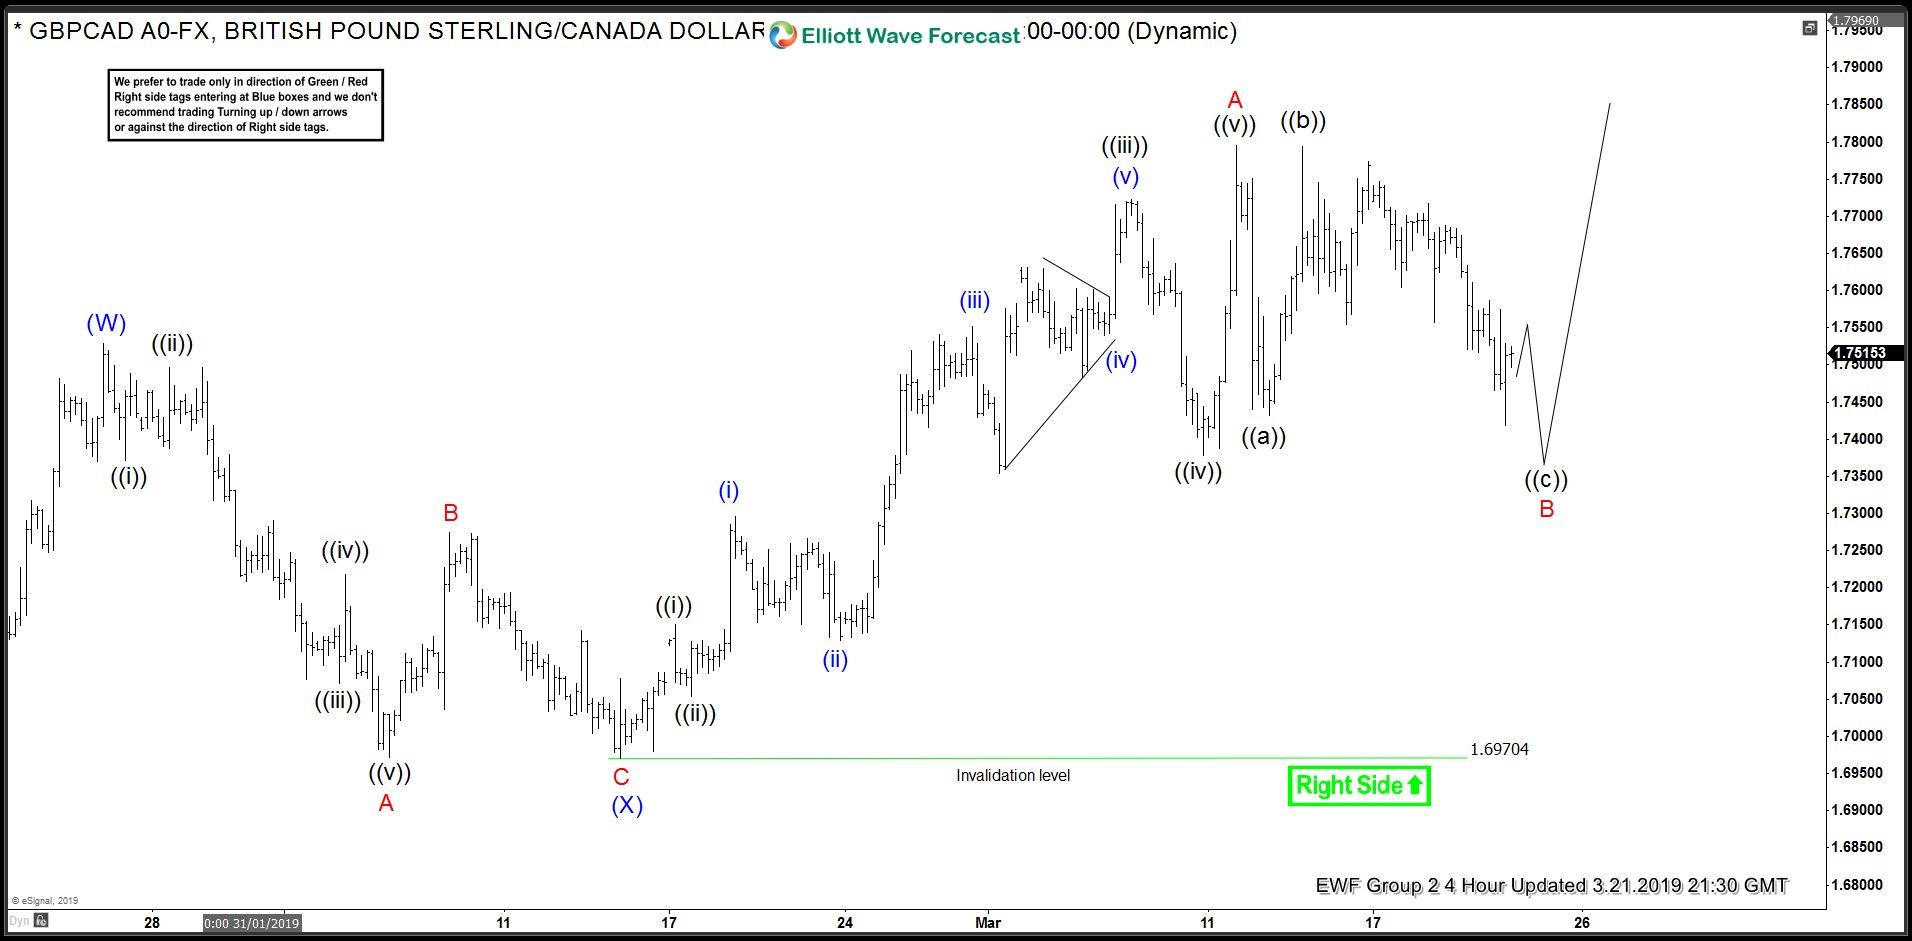
GBPCAD 4 Hour Elliott Wave Analysis 3.21.2019
Besides we have bullish sequences in August 2018 cycle, short term rally from the 1.697 low has 5 waves structure which supports idea of further rally. 5 waves from the mentioned low suggests we have ended only the first leg of potential Elliott Wave ZIG ZAG Pattern. So once B pull completes we can get another leg up C red. As of right now GBPCAD is correcting the short term cycle from the 1.697 low. Pull back is labeled as B red , having ((a)) ((b)) ((c)) subdivisions. We see pull back incomplete when we can still be in ((c)) black leg. Chart is calling for potentially another leg lower, however we don't recommend selling it.
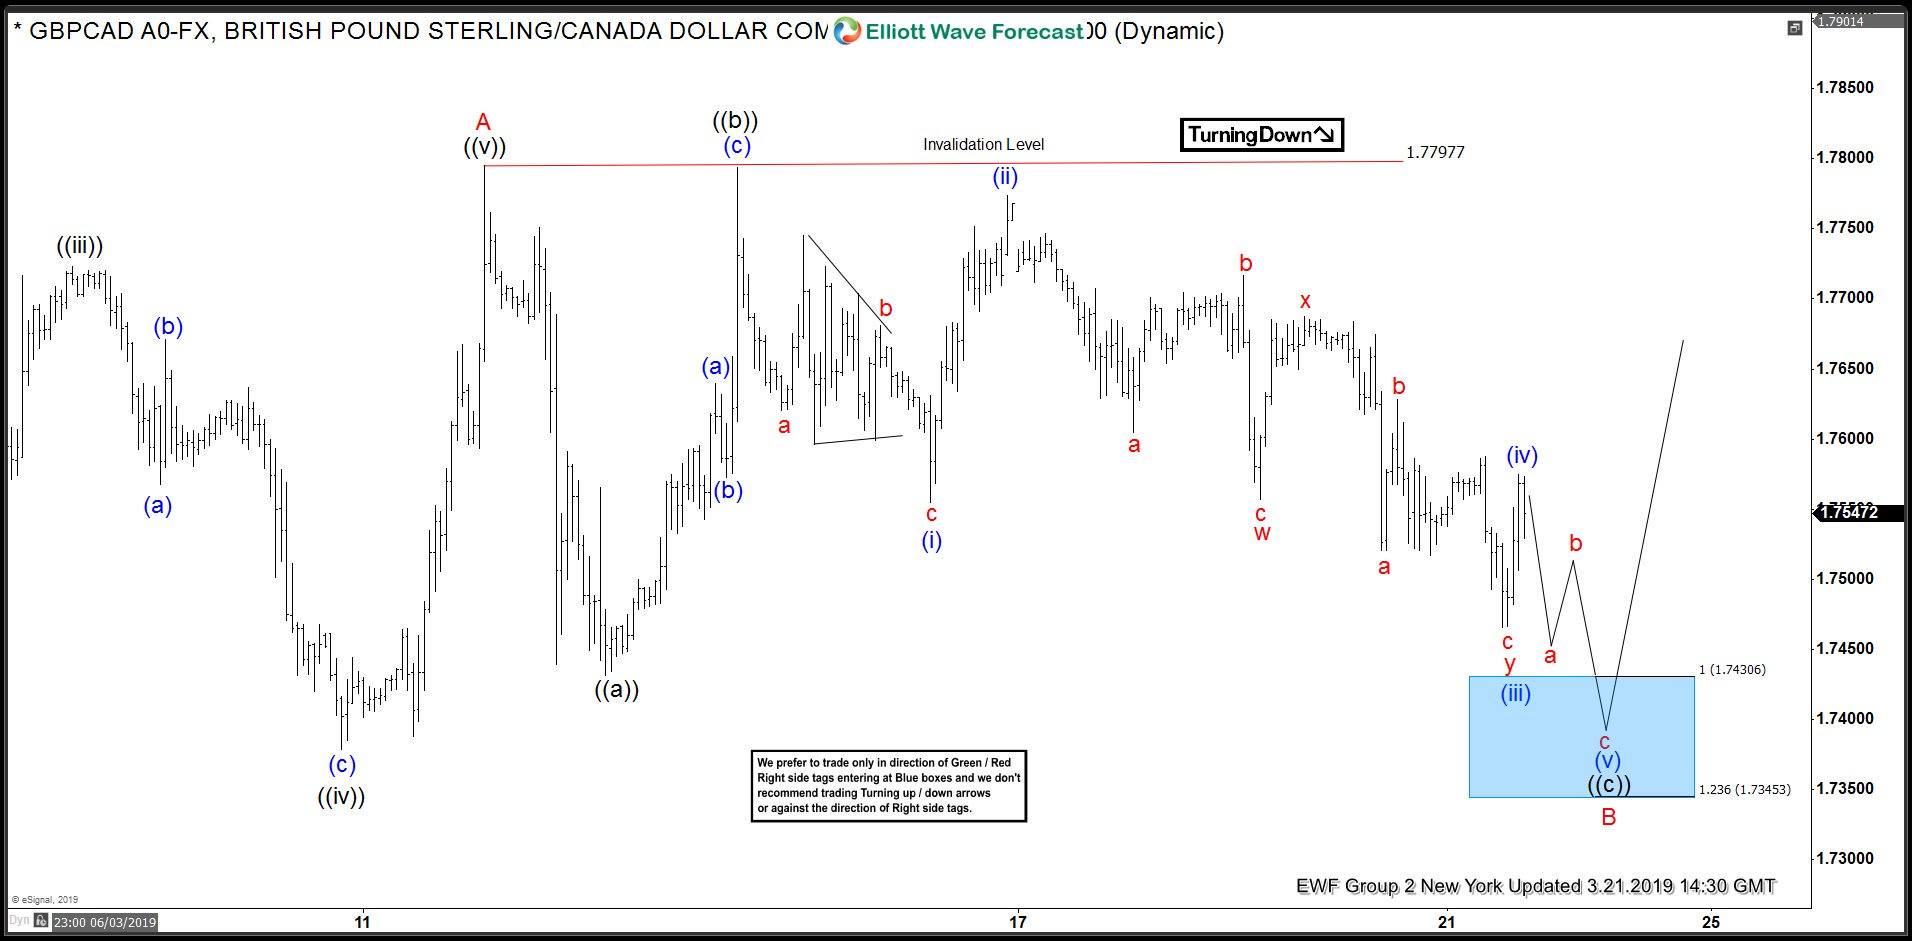
GBPCAD 1 Hour Elliott Wave Analysis 3.21.2019
B red pull back can be still in progress. We are calling for another short term swing down to allow the price to reach important technical area marked at the blue box : 1.74306-1.7345 ( buyers zone) . As our members know, Blue Boxes are no enemy areas , giving us 85% chance to get a bounce. Because of incomplete swing sequences in August cycle and 5 waves from the 1.69704 low, we expect to see reaction in 3 waves up from the blue box at least.
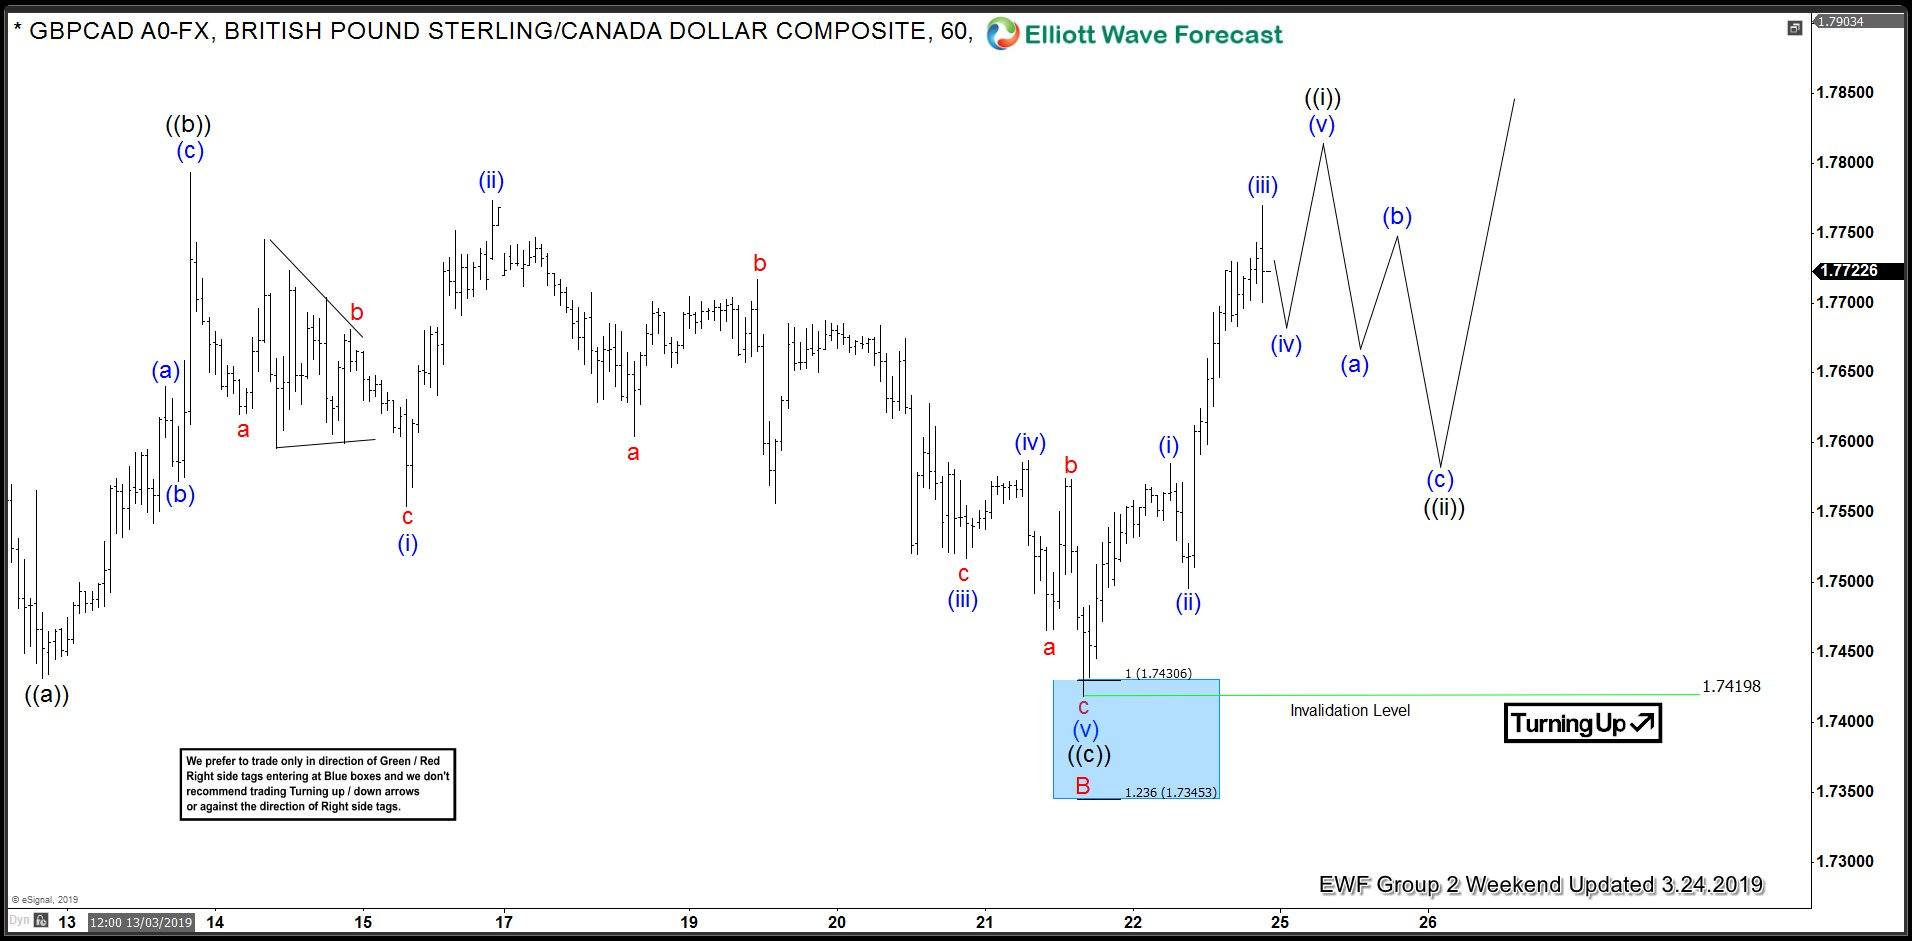
GBPCAD 1 Hour Elliott Wave Analysis 3.24.2019
Eventually GBPCAD has made leg lower as expected. The price has reached proposed Blue Box area at 1.74306-1.7345. Buyers appeared right at the blue box when pull back completed at 1.74198 low. We got expected rally. Now, we need to see break above March 12th peak to confirming next leg is in progress. Any longs from blue box area should be already risk free. If not already long we don't recommend buying short term dips against the 1.74198 low until March 12th peak gets broken.
Keep in mind that market is dynamic and presented view could have changed in the mean time. Best instruments to trade are those having incomplete bullish or bearish swings sequences. We put them in Sequence Report and best among them are shown in the Live Trading Room. You can check most recent charts in the membership area of the site.
Sunset Market Commentary
Markets
Global core bonds lost ground today as investor concerns over the global growth outlook show signs of easing. US Treasuries are underperforming German Bunds. Risk sentiment recovered overnight with Asian bourses, except China, coloring green. Core bonds opened with a downward bias. EU equities opened hesitant, temporarily supporting German Bunds. However, overall sentiment improved across the EU as German and French business/consumer confidence indicators printed stable to slightly positive. German Bunds moved lower again yet the move didn’t impress. The German yield curve is close to unchanged with yield changes varying between -0.4 bps (30-yr) to +0.8 bps (2-yr). US Treasuries moved gradually lower throughout the day after it had set a fresh peak yesterday. Boston Fed chief Rosengren was positive on the US growth outlook, clinging on to more hikes despite rising risks. Weaker than expected US housing data and a disappointing US consumer confidence reading turned the tide for US Treasuries, who partly erased its intraday losses. A convincing WS opening (+1%) was unable to halt the upward trend. The US yield curve is bear steepening with changes in the range of +0.7 bps (30-yr) to +3.1 bps (2-yr). Peripheral spreads over the German 10-yr yield remain stable overall with Italy (-2 bps) outperforming.
Trading in EUR/USD showed some remarkable intraday swings. Eco data in the US and Europe failed to give EUR/USD trading clear guidance. EMU confidence data were a bit mixed. If anything, French business confidence data on average printed slightly better than expected. Decent data and a positive risk sentiment initially laid the groundwork for a cautious EUR/USD intraday rebound. However, sentiment turned in favor of the dollar going into the open of the US markets. We didn’t seen a clear driver. Early morning, US housing data were mixed at best. Even so, US yields rebounded more than EU-ones, giving the dollar substantial interest rate support. EUR/USD declined from the 1.1325 area to the 1.1280 area. USD/JPY also rose (modestly), supported by higher core yields and a rebound in US equities. US consumer confidence was materially weaker than expected. The USD interest rate advantage eased slightly after the release, but the report didn’t change the established intraday trends in a profound way. The dollar maintains most of its intraday gains. EUR/USD is trading in the 1.1290 area. USD/JPY trades near 110.60.
Sterling traders continued to closely monitor the developing Brexit saga. MP’s are expected to hold indicative votes on different Brexit options tomorrow. The outcome of this process is highly uncertain. Even so, sterling rebounded during the session. The move was probably supported by comments from conservative Brexiteer Jacob Rees-Mogg as he indicated that May’s deal was ‘better than not leaving at all’. So, maybe there is still some chance for May’s deal to be approved. EUR/GBP is currently trading in the 0.8535 area (compared to the 0.8590 area mid-morning). Cable is resisting broader USD strength and is trading in the 1.3220 area.
News Headlines
ECB’s Olli Rehn said banks will know the full details of the TLTRO-III program by June. In March the ECB officially unveiled the basics of its new long-term funding scheme. The funding will be allotted on a quarterly basis (September 2019 to March 2021) for a maturity of 2 years at a rate indexed to the MRO and up to 30% of the eligible loan stock.
The Hungarian central bank left the base rate unchanged (0.90%) and increased its overnight deposit rate from -0.15% to -0.05%, as expected. However, the central bank signaled it might possibly be a one-off with further rate hikes highly data dependent. In contrast, it announced a fresh corporate-bond buying program, starting from July this year. The forint took a hit as the overall ‘package’ was softer than expected.
WTI Oil Futures in a Flying Mode; Bullish Bias in Short Term
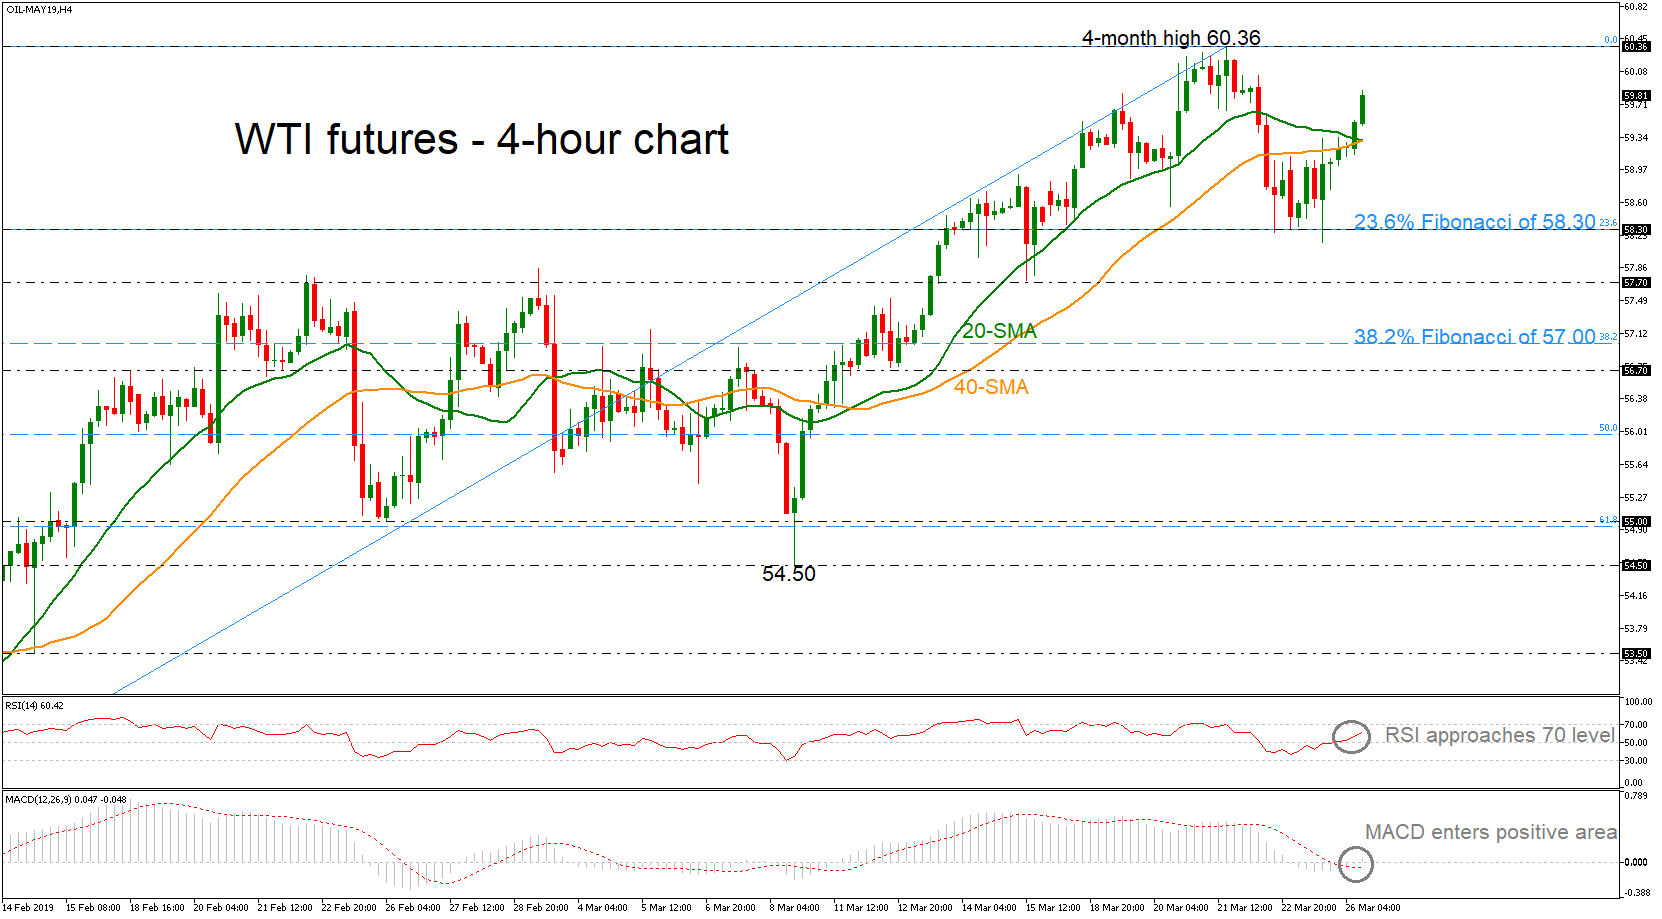
WTI crude oil futures have come under renewed buying interest, rising back above the 20- and 40-simple moving averages (SMAs) in the 4-hour chart after the market found strong support at the 23.6% Fibonacci retracement level of the upleg from 51.60 to 60.36, around 58.30.
Looking at momentum oscillators, they suggest further upside pressures may follow in the short-term. The RSI is holding above its neutral 50 line and is also pointing upwards, detecting bullish momentum. The MACD, already positive, lies above its trigger and zero lines.
If the bulls hold the control, price advances may stall initially near the latest high of 60.36. Another positive extension could find resistance at the 61.45 barrier, where the market topped on November 2018, increasing bullish sentiment. More upside pressures could drive the commodity towards the next hurdle of 63.20, taken from the peak on November 2018.
In case of a successful penetration to the downside of SMAs, oil prices could rest near the 23.6% Fibonacci which coincides with the 58.30 support. Even lower, the next stop could be around the 57.70 support level, while deeper the price could touch the 38.2% Fibonacci of 57.00.
To conclude, the market is in an ascending tendency over the last month following the rebound on the 51.60 support barrier.