Sample Category Title
R-Star Wars: The Phantom Menace
Highlights
- Markets are pricing a cut in Canadian and U.S. policy rates, while central bankers are still showing a gap relative to their higher estimated neutral rates. Herein lies the challenge with applying theoretical frameworks to unobservable variables.
- Although the Federal Reserve has at least arrived at the bottom end of its neutral range, the Bank of Canada remains quite a distance from their past estimates. Structural changes within the Canadian economy and the inherent limitations of models have led us to entertain a real neutral rate that will not only fall short of past estimates, but ultimately hover near zero or less.
Of all the benchmarks in modern finance, the policy rates set by central banks are the most closely watched and critiqued. The guidepost is typically intertwined within the concept of r-star (r*), often referred to as the neutral rate. In theory, the neutral rate allows an economy to allocate resources in a manner where the pace of economic expansion corresponds with full employment and stable inflation. It's a "goldilocks rate" that neither stokes nor stifles demand.
The theoretical concept is easy to grasp, however getting the estimate of r* right is anything but. Most economists can agree that r* is lower today than the pre-recession experience, due in large part to aging demographics that have cut labor force growth projections and slower productivity growth from prior decades. However, if you put five economists in a room to determine a specific pin-point value on r*, there's a good chance you'll get six different estimates.
The neutral rate is ultimately an unobservable variable. Knowing whether you were in the ballpark occurs only with hindsight years later. In addition, an estimated value of r* requires a combination of inputs from other unobservable variables and/or a reliance on assumptions based on historical relationships that may not hold constant over time. Hence our "phantom menace" reference as the title of this report, which aptly captures the conceptual complexity and the resulting divergent views of the neutral rate. Central bankers and economists have to navigate real-time data, often with a high degree of measurement error, employing judgement along every step of the way. Here in lies the crux of the matter. The policy rate is crucial in guiding the path for bond yields, mortgage rates, risk assets, and global financial flows. In the ultimate exercise of trial-and-error, it's important to understand the framework and inherent limitations in modelling the underpinnings to r*.
Master Yoda says: Be mindful of the future
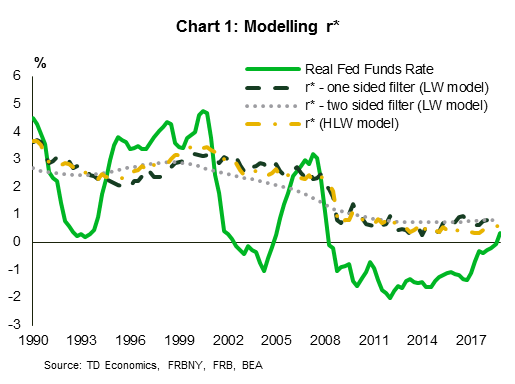
The neutral rate has two distinct "time" dimension concepts: long-term equilibrium and time-variance. The long-term equilibrium concept is based on structural supply-side developments within the economy related to demographics and productivity. This textbook r* concept marks the theoretical level that maintains an economy at a non-inflationary running speed in the absence of an output gap. However, getting there requires a more nuanced r* concept that is "time-variant". This estimation takes into account cyclicality and the level of interest rates that would help output converge back to its long-term potential when it's knocked off that path. Chart 1 offers three examples of the time-variant r*, all of which suggest that the Fed Funds policy rate is already within spitting distance of estimates of the neutral rate.
Regardless of which r* is estimated, one phenomenon holds true for both: large estimation error. In recognition, economists don't rely on a single methodology. Rather, they run the logic through various theoretical paths and present neutral estimates within a range, rather than a point-estimate. As an example, a 2018 paper by Bank of Canada researchers reviewed four modelling approaches for r*. Highly similar r* results were produced across all frameworks, with estimates falling within a range of 2.50% to 3.75%. Stripping off inflation implies a positive neutral rate of 0.50% to 1.75%.
Canada's real policy rate sits at roughly -0.25% using forward inflation expectations. As such, one could conclude that there's more room to the upside since it has yet to even kiss that bottom end of the neutral range. However, herein lies a flaw. Why did all four empirical approaches support similar positive neutral ranges? It is partly because of a reliance on similar assumptions for unobservable variables and their theoretical relationships, which ultimately causes estimates to converge onto each other.
For instance, a Canadian neutral rate can be estimated based on domestic trends and/or in combination with estimates of the U.S. or broader global neutral rates. The fact that Canada is an open economy with capital mobility means that global financial linkages should keep r* reasonably close to that of its peers. However, the global r* calculation is based on the same assumptions as those used in the domestic version. The models generally rely on a combination of estimates for potential GDP, the relationship between economic slack with inflation, and the time preference for saving. All of these incorporate elements that are unobservable at the time of estimation.
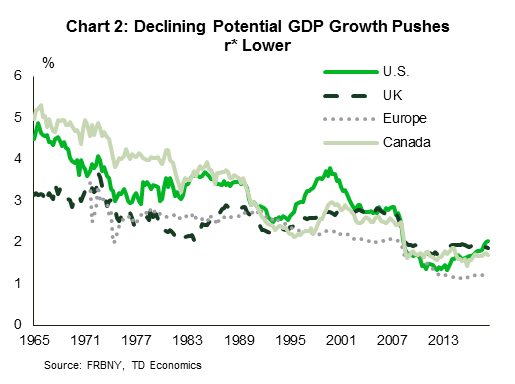
Take potential GDP growth (Chart 2). It is determined by the growth of the labor force and productivity. Sounds easy enough. Birth and death rates are transparent, as are working age cohorts. But what if changing patterns in immigration or government policies subsequently alter these estimates? What if productivity turns out to be more of a moving target? Estimates of the latter have consistently disappointed globally, causing an economic paradox relative to historical experience and the rate of technological change over the last decade. It is estimated that for every 1% change in potential GDP growth, r* changes by the same magnitude. If our demographic or productivity assumptions are off by as little as half a percentage point to the downside, r* ends up also being off by the same magnitude. For instance, using productivity growth from 2000s decade as the benchmark for the current cycle would have over predicted potential GDP growth and r* by 0.6 percentage points. Since the calculation of a trend rate of growth carries historical bias that's embedded within a common framework, assumptions can suffer from clustering within the economics community.
The key takeaway is that the modelling approaches offer a thought-framework and starting point to the analysis, but they are not a silver bullet on the value of r*. Judgement and continual assessment of the data is required as central bankers probe for that equilibrium level of a real-time unobservable variable. And, this all needs to be done in consideration of changing regimes. The past decade has brought forward complexities related to a global savings glut, central bank asset purchases, and higher financial sector regulatory standards that create larger capital buffers and more demand for risk-free assets. Canada has been more active than most other countries in imposing macro-prudential rules within the residential real estate sector that has left mortgage qualifying rates far higher than what is simply implied by the policy rate and related mortgage rate spreads. All of these drivers influence r* where there are no historical observations from which to draw.
The path of the Jedi
Some criticism was laid at the feet of the Federal Reserve on the recent about-face in the span of a few months. The Fed Chair went from saying "we're a long way from neutral" interest rates, to shifting to a neutral stance. Knowing the inherent limitations of models, we would be more concerned if a central bank did not alter its assessment in the face of data developments that challenge their 'priors'.
By extension, we think the Bank of Canada will set a course of stable interest rates going forward. One of the biggest shifts that occurred in our quarterly March forecast was the removal of any further interest rate hikes from our outlook. We hit the stop button. This is an out-of-consensus call where the median consensus estimate among economists is still incorporating 40 bps of rate increases in 2019.
For us to re-evaluate this position, we need to have confidence in a Canadian economy that can hold above 2% real GDP growth for several quarters. However, our forecast model fails to produce this result. If we have exercised the right judgement, this implies that Canada has already arrived at the time-variant neutral rate, which leaves it modestly in negative territory. Consumer-led data have demonstrated interest rate sensitivity to a greater than expected degree. When combined with key structural changes within the economy, this lead us to suspect that the policy rate needs to remain lower than past estimates of long-term r* for the following reasons:
- The high degree of household leverage
- Structural changes to the export sector.
- When the consumer sector cools, an "escape route" for Canada has often been the external sector. A depreciation of the Canadian dollar and healthy U.S. demand provide an offsetting force through exports. This dynamic, however, has become more muted over the past decade and incoming data appear to reinforce this theme.
- Related structural changes in investment and productivity in Canada, and even globally.
Despite the Bank of Canada's real policy rate being in slight negative territory, we see a significantly positive r* is becoming less convincing. Canada may very well require the real interest rate to remain close to or below zero for a long period. We need only cast our eyes to Japan and Europe for two real-time case studies. Periods of deleveraging typically have strong negative forces on potential GDP and the ability to maintain inflation at target. The U.S. is a decade removed from the beginning of their household deleveraging cycle and there still appears to be scarring that limits r* from being higher. Canada is just at the starting point of that deleveraging process and it will take years to unwind. This risks an extended period where desired savings and investment are structurally impacted.
Bottom Line
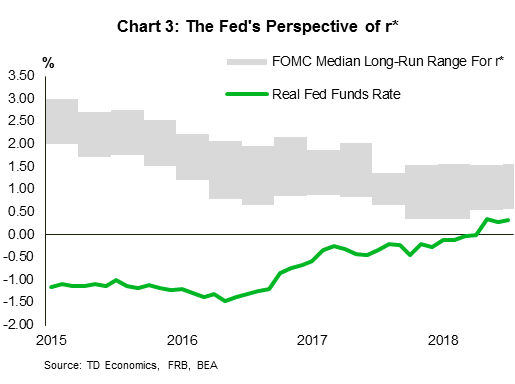
When it comes to the estimation of r*, we think Federal Reserve Chair, Powell, summed it up nicely when he noted "guiding policy by the stars ... has been quite challenging of late because our best estimates of the location of the stars have been changing significantly" (Chart 3). There is no single anchor for r* and we are ultimately engaged in a trial-and-error exercise that leaves past estimated ranges under scrutiny. If nothing else, the confidence bands are likely wider and should entertain a time-variant real neutral rate that can be negative.
QE Redux: Have We Been Here Before? Fed Policy Review Part 3
Executive Summary
In the third of a series of reports examining how the Fed's framework and toolkit may evolve in the coming years, we discuss the potential for the Federal Open Market Committee (FOMC) to return to quantitative easing (QE).1 Because the FOMC views changes in the fed funds rate as its primary means for changing the stance of monetary policy, the committee would first cut rates all the way back to 0%, if necessary, when the next economic downturn arrives. But the experience with QE shows that it can lend some monetary policy support when interest rates become extraordinarily low. Accordingly, we believe that the FOMC would revert to QE, focused on purchases of U.S. Treasury securities, should that eventually prove necessary. Renewed purchases of mortgagebacked securities, or purchases of corporate bonds and equities, are significantly less likely in our view.
QE: Providing Policy Support via Asset Purchases
Federal Reserve policymakers historically attempted to achieve their dual mandate of maintaining "stable prices" and reaching "full employment" via control of the fed funds rate. However, the depth of the Great Recession changed the way the Fed thought about its traditional means of stimulating the economy. With economic activity in free fall in late 2008 and with the target for the fed funds rate rapidly closing in on 0%, the Federal Open Market Committee (FOMC) initiated a program in November 2008 to purchase agency and mortgage-backed securities (MBS), which it traditionally did not own, in order to "provide support to the mortgage and housing markets." In March 2009, the Fed added to its MBS purchases when it started to buy Treasury securities in an effort to "improve conditions in private credit markets" more broadly. This first program of quantitative easing (QE) ended in mid-2010, but the FOMC commenced a second round shortly thereafter when it deemed that the economy was not growing strongly enough.
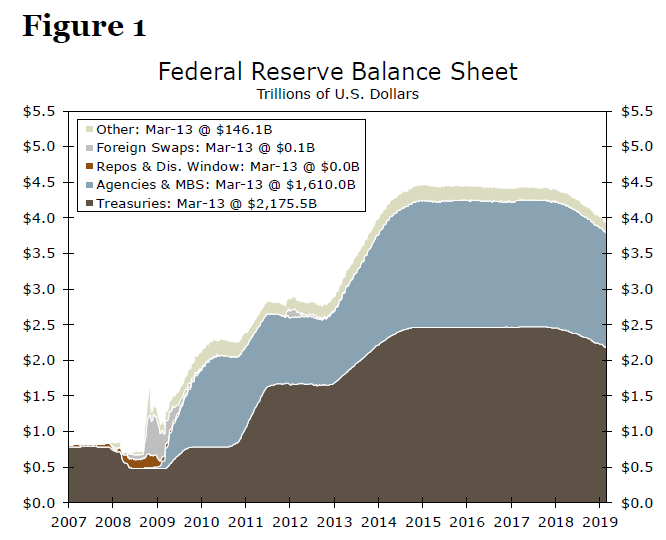
The Federal Reserve ultimately embarked on a third round of QE in late 2012. But whereas it bought a finite amount of securities in the first two rounds, the third round was meant to be open ended. That is, it announced that it would purchase $45 billion worth of Treasury securities and $40 billion worth of MBS per month until there was "sustained improvement in labor market conditions." As the economy gradually gained traction and the labor market strengthened, the Federal Reserve started to "taper" its bond purchases in early 2014, eventually leading to a complete phase-out of QE at the end of that year. At the high-water mark, the Fed owned about $2.5 trillion of Treasury securities, and its holdings of MBS totaled approximately $1.8 trillion (Figure 1). These amounts represented 17% and 22% of the outstanding stock of the respective securities (Figure 2).
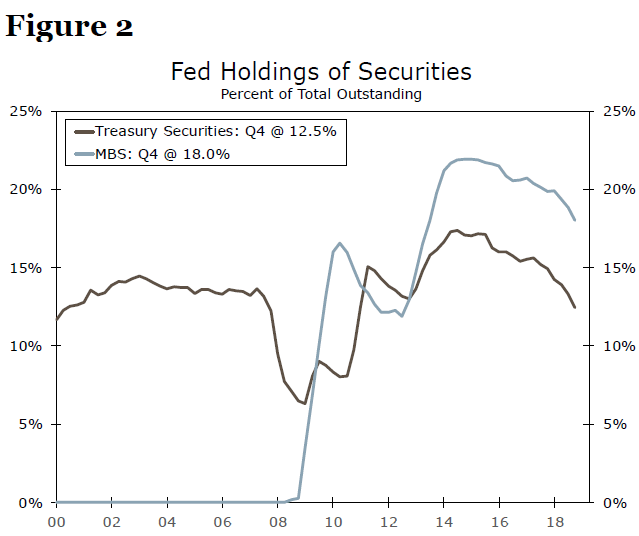
As noted previously, the Fed stopped buying bonds in late 2014 and, more recently, it has allowed up to $50 billion of maturing bonds a month to roll off its balance sheet without replacing them. Consequently, the Fed currently holds about 12% of the outstanding stock of Treasury securities, which is roughly equivalent to the pre-crisis proportion.2 Looking forward, the proportion of outstanding Treasury securities that the Fed holds will recede a bit further as it allows maturing bonds to continue to roll off its balance sheet and as Treasury issuance remains robust.3 That said, the FOMC decided at its March 20 meeting that it will soon reduce the maximum amount of Treasury securities that it allows to roll off every month, and that it will cease shrinking the overall size of its balance sheet altogether in October. 4
Could the Fed Pull the QE Rabbit Out of the Hat Again?
The FOMC views changes in the target range for the fed funds rate as its primary means for changing the stance of monetary policy.5 Accordingly, the FOMC would first cut the target range for the fed funds rate all the way back to 0% to 0.25%, if necessary, when the next economic downturn arrives. As we discussed in the second report in this series, the FOMC could potentially cut rates into negative territory, if the downturn were sharp enough. However, the Federal Reserve may first choose to restart QE purchases of Treasury securities, which has recent precedent in the United States, before resorting to negative rates.
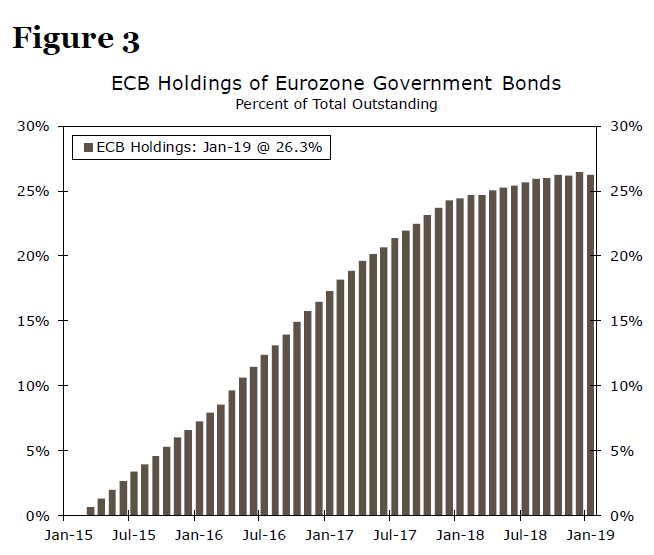
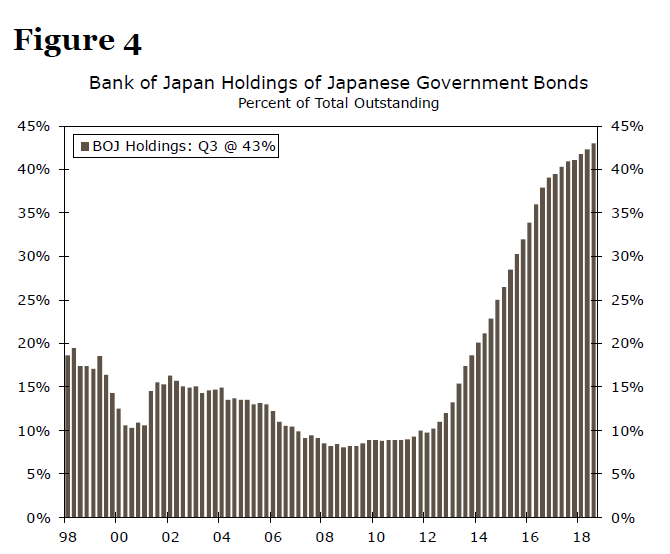
The experience of some other major central banks suggests a reboot of QE by the Fed is feasible. For example, the European Central Bank (ECB) started its own QE program in March 2015. Over the next three years, the ECB's net purchases of government bonds totaled more than €2 trillion. Today, the ECB owns roughly one-quarter of outstanding government bonds in the Eurozone (Figure 3). The Bank of Japan (BoJ) has been even more aggressive in its purchases of Japanese government bonds (JGBs). As shown in Figure 4, the BoJ's holdings of JGBs has shot up from roughly 10% in 2012 to more than 40% today. With the Fed's Treasury holdings representing just over 12% of outstanding Treasury securities, at present, there appears to be scope for a renewal of QE if the next downturn is severe enough to warrant it.
If history is a useful guide, then renewed QE would provide some additional policy support. Researchers have estimated that the $1.5 trillion of bond purchases that occurred under the third round of QE reduced the 10-year term premium by roughly 60 bps, which is equivalent to a one-totwo percentage point cut in the fed funds rate.6 Although QE may not have been a "silver bullet," it did add policy support at a time when the economy needed it. In sum, we think it would be entirely reasonable to expect the Fed to purchase Treasury securities again, if the situation warranted.
Could the Fed Extend Its Purchases to Other Types of Assets?
But would the Federal Reserve buy other assets, such as MBS, or would it confine itself largely to purchases of Treasury securities? As noted above, the Fed's asset purchases started with MBS in late 2008 when it wanted to provide support to the housing market. But under the assumption that the housing market is not the epicenter of the next economic downturn, then the FOMC may find direct support of the housing market to be less compelling than it was a decade ago. Furthermore, the FOMC's stated policy goal is to hold primarily Treasury securities in the longer run.7 Although the Fed could clearly return to MBS purchases if the next downturn were severe enough, we believe that the Fed would likely eschew buying MBS in most situations.
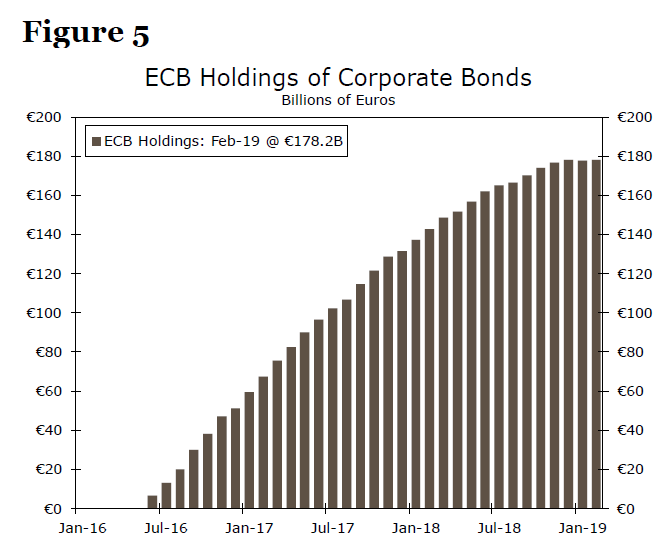
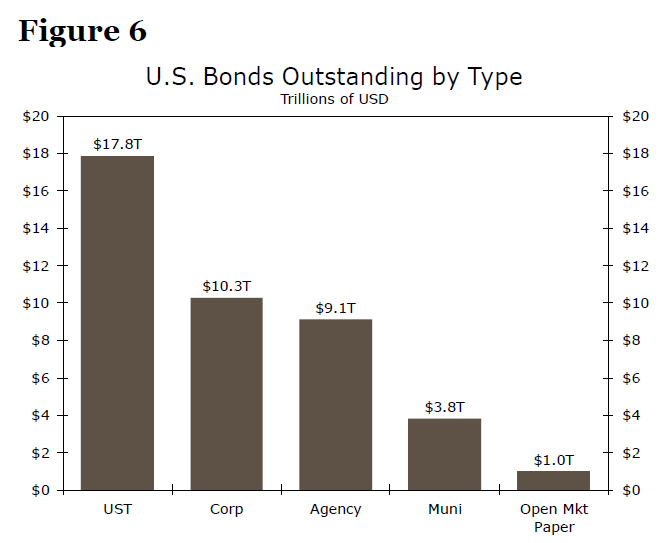
Could the FOMC authorize purchases of corporate bonds as part of any renewed QE effort? After all, the ECB has been buying corporate bonds under its Corporate Sector Purchase Program (CSPP) since June 2016, and today those holdings total nearly €180 billion (Figure 5). As shown in Figure 6, there are currently more than $10 trillion of bonds in the U.S. corporate bond market today, making this asset class a potential candidate for QE purchases. That said, there are two considerations that may give Fed officials pause regarding purchases of corporate bonds. First, there are hundreds of different issuers in the corporate bond market. Consequently, significant purchases of corporate bonds by the Federal Reserve could have adverse effects on liquidity in certain segments of the market. In addition, the Fed's staff may not have the expertise to make informed credit decisions regarding corporate bonds. Second, some Fed officials may have reservations about altering the allocation of credit across different industries.8 In effect, the Fed could end up picking "winners" and "losers" via its corporate bond purchases.
Equities have the potential to be a very powerful QE tool, at least in theory, because Americans own about $36 trillion worth of stocks, which is more than twice the amount of U.S. Treasury securities outstanding. Moreover, equity purchases by central banks is not without precedent. The BoJ bought about ¥2 trillion (roughly $18 billion at today's exchange rate) of bank stocks in 2002-2004, and it has purchased exchange-traded funds (ETFs) since 2013. The BoJ's holdings of ETFs total ¥24.5 trillion (about $220 billion) today.
However, some of the issues that were discussed above in the context of corporate bonds make the purchase of equities impractical as an instrument of QE. There are thousands of individual stocks, and Fed officials may be leery of picking winners and losers, or at least appear to be doing so. In addition, there is the practical issue of how to execute the purchase of stocks. Banks hold hundreds of billions of dollars of Treasury securities on their balance sheets and it is rather straightforward for the Fed to buy those securities by creating bank reserves, which are liabilities of the Federal Reserve. But the majority of stocks are held by households, either directly or indirectly via mutual funds. How exactly would the Fed execute the purchase of equities? Therefore, it is very unlikely that the FOMC would contemplate the purchase of stocks as a means to implement another round of QE.
Conclusion
In late 2008 as the fed funds rate neared 0%, which the Fed at that time considered to be its effective lower bound (ELB), the FOMC authorized a program of asset purchases to provide additional policy support to an economy that desperately needed it. Over the next six years, the Fed's holdings of MBS swelled to $1.8 trillion while its portfolio of Treasury securities mushroomed to $2.5 trillion. The Fed has been steadily reducing the size of its balance sheet for more than a year, but the FOMC recently announced that the runoff of Treasury securities will end in October 2019.
The Fed views changes in the fed funds rate as its primary means for changing the stance of monetary policy. Therefore, the FOMC would cut rates to essentially 0% again, if necessary, when the next downturn arrives. As we have discussed elsewhere, the FOMC could even cut rates into negative territory. But QE is a tool that the FOMC could clearly use again. Not only has the Fed had experience with QE, but other major central banks have also implemented asset purchase programs that have generally, but not exclusively, been focused on sovereign bonds. Their experiences suggest that the Fed could potentially buy significantly more Treasury securities in the next cycle, should that eventuality prove necessary, than they did in the years after the Great Recession. QE likely will remain part of the Fed's toolkit for some time.
1 See "Two Thine Own Inflation Target Be True?" (March 4, 2019) and "Could the Fed Go Negative?" (March 13, 2019).
2 Due to gaping budget deficits, the outstanding stock of Treasury securities has mushroomed from roughly $5 trillion in 2008 to about $18 trillion at present.
3 We have been projecting for some time that the Fed would stop shrinking its balance sheet by the end of 2019. See "Will the Fed's Balance Sheet Ever Return to 'Normal'? Part I" (August 29, 2018) and "The Outlook for the Fed's Balance Sheet: An Update" (February 20, 2019).
4 See "Balance Sheet Normalization Principles and Plans" (March 20, 2019).
5 https://www.federalreserve.gov/newsevents/speech/clarida20190222a.htm.
6 Gagnon, Joseph and Brian Sack, "QE: A User's Guide," Peterson Institute for International Economics Policy Brief, October 2018.
7 See "Policy Normalization Principles and Plans" (September 16, 2014).
8 See Lacker, Jeffrey, "Government Lending and Monetary Policy" (March 2, 2009).
GBP/USD Outlook: Pound Ticks Higher on News of Possible MV3 on Tuesday but Still Directionless
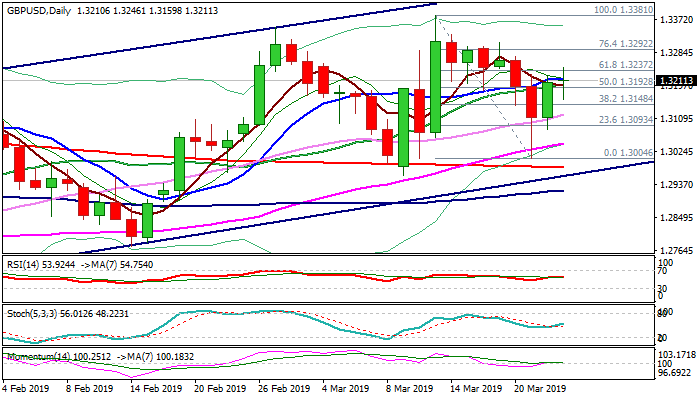
Cable spiked to session high at 1.3246 on comments that the third parliament's vote on Brexit plan could be tomorrow.
Pound remains volatile and very sensitive on any news regarding Brexit, though there is still long way until satisfactory solution.
PM May seeks for plan support from Ireland's DUP that is necessary for vote to happen.
Despite spike higher, Monday's action is shaped in long-legged Doji that signals strong indecision, as market participants await fresh signals for further action.
Flat daily momentum causes limited recovery, which was so far unable to clearly break above 10SMA (1.3216) and Fibo 61.8% (1.3237) and generate positive signal.
Rising 20SMA (1.3200) offers immediate support and underpins, guarding lower pivot at 1.3121 (30SMA), loss of which would weaken near-term structure.
Res: 1.3216; 1.3237; 1.3246; 1.3272
Sup: 1.3200; 1.3148; 1.3121; 1.3093
Sunset Market Commentary
Markets
Global core bonds are gaining modest ground today with US Treasuries outperforming German bunds. The German IFO current business confidence index increased from 103.6 to 103.8 in March, more than the expected 102.9. The forward looking subcomponent rose to 95.6, up from 94.0 a month before. The stronger-than-forecasted results weighed slightly on German Bunds. The German 10-yr yield edged higher to positive territory, albeit only temporarily. The German yield curve is mixed with modest changes between -0.4 bps (30-yr) and +0.4 bps (5-yr). US Treasuries initially took a breather during European trading after Friday’s rally. Fed governor Evans said risks from the downside scenarios loom larger than those from the upside ones, but repeated the strong current state of the US economy. As US investors joined trading, US Treasuries paired its intraday losses to gain ground at the time of writing. The US yield curve is steepening with changes varying between -4.2 bps (2-yr) and +1.6 bps (30-yr). Peripheral spreads over the German 10-yr yield are widening, with Italy (+ 6 bps) underperforming.
Global (FX) trading calmed down after Friday’s aggressive risk-off trade. The (trade-weighted) dollar is losing marginal ground. Investors are still extensively debating the risks to global growth and the meaning of recent global market movements, including a flattening/inversion of yield curves. Doubts are no longer limited to EMU or China anymore. US growth is also in question, making clear directional moves in the dollar or in other major currency cross rates less evident. Today, the focus turned on the German IFO release. In the wake of Friday’s EMU PMI’s, markets were prepared for the worst, but the IFO rebounded more than expected. It provided some relieve for European markets and for the euro. However, the rebound was limited. One (growth) swallow doesn’t make a summer. EUR/USD is trading in the 1.1315 area (compared to sub-1.13 levels on Friday and this morning). The IFO prevented further euro losses, but not much more than that. USD/JPY regained modest ground, but the rebound soon ran into resistance. The pair struggles to avoid drifting back below the 110-handle as sentiment on risk remains extremely fragile.
After a turbulent weekend for UK politics, the visibility on the upcoming steps in Brexit remain close to non-existent. UK PM May is facing a growing number of calls to resign. At the same time, Parliament might take control of the Brexit process this evening and hold a series of indicative votes on Wednesday. The EU warned that the likelihood of a no-deal Brexit is increasing. Despite the mounting chaos on Brexit, sterling held up quite well. The UK currency even reversed earlier losses. EUR/GBP is again trading in the 0.8560 area. Cable rebounded north of 1.32. The reason of the sterling resilience is not clear. Maybe some investors see Parliament potentially taking control as a larger chance on a softer Brexit. UK PM May might address Parliament later today. A Parliamentary debate is expected afterwards and MP’s are expected to vote tonight on which amendments might be retained for Wednesday.
News Headlines
The Turkish lira recouped some of the considerable losses at the end of last week. The currency was hit hard last Friday amid renewed global growth concerns and after a sudden drop in the central bank’s foreign exchange reserves. EUR/TRY closed at 6.51 before recovering to 6.37 today.
The IMF’s Deputy Managing Director David Lipton said the US/Sino trade conflict poses the largest risk to global stability. He added that (the build-up of) fiscal-stabilization capacity is necessary to respond to economic shocks in Europe (and in the US) to avoid continued over-reliance on monetary policy.
Theresa May would only table her brexitdeal to parliament for a third time, possibly as early as tomorrow, if there is a chance of getting enough support, her spokesman said. Meanwhile, the EU hardens its stance, saying it was ready for an “increasingly likely” crashing out scenario after putting in place basic temporary contingency measures.
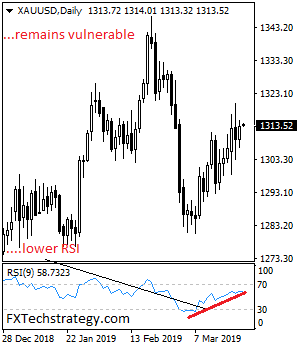
GOLD Looks To Pullbacks On Corrective Weakness
GOLD looks to pullback on corrective weakness. While the commodity trades below the 1,320.35 level, risk of more decline remains. The commodity looks to move higher towards the 1,320.00 resistance zone. Further out, resistance resides at the 1,330.00 level where a break will aim at the 1,340.00 level. A turn above there will expose the 1,350.00 level. Further out, resistance stands at the 1,360.00 level. On the downside, support comes in at the 1,300.00 level where a break will turn attention to the 1,290.00 level. Further down, a cut through here will open the door for a move lower towards the 1,280.00 level. Below here if seen could trigger further downside pressure targeting the 1,270.00 level. All in all, GOLD looks to move further lower on correction.
EUR/USD Mid-Day Outlook
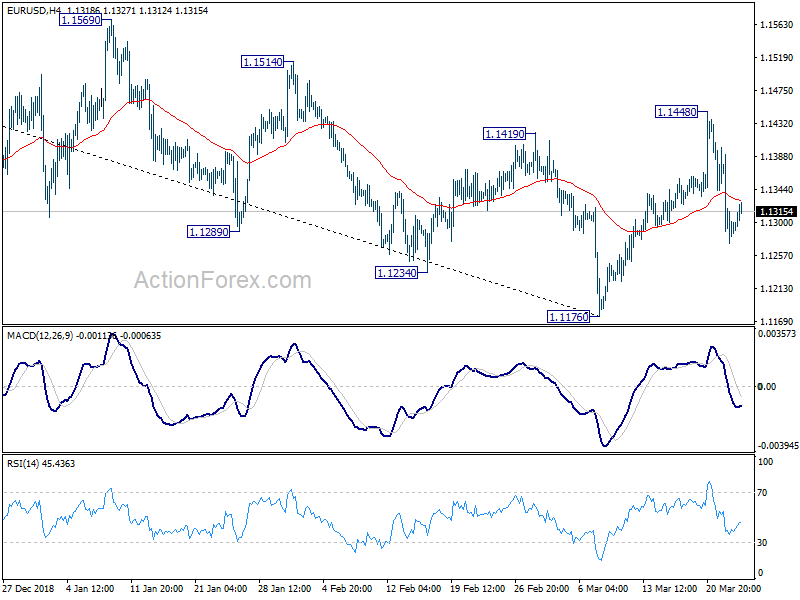
Daily Pivots: (S1) 1.1252; (P) 1.1322; (R1) 1.1372; More.....
No change in EUR/USD's outlook. Intraday bias remains mildly on the downside for retesting 1.1176 low. Decisive break there will resume whole decline from 1.2555. On the upside, above 1.1448 will resume the rebound from 1.1176 to 1.1569 resistance instead.
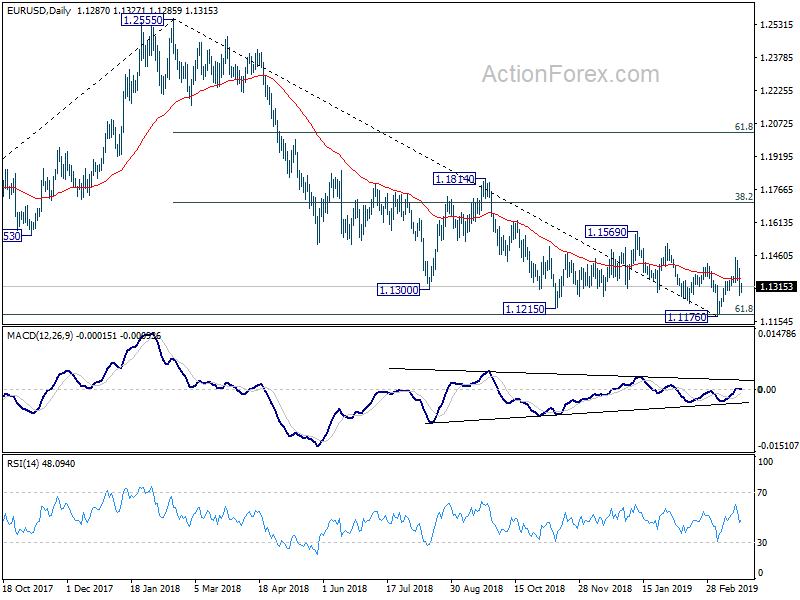
In the bigger picture, medium term outlooks is a bit mixed for now as there are conflicting signals. We'll turn neutral first. On the downside, decisive break of 61.8% retracement of 1.0339 (2016 low) to 1.2555 (2018 high) at 1.1186 will resume the whole down trend from 1.2555. Next target will be 1.0339 low. Nevertheless, break of 1.1569 resistance should confirm medium term bottoming. Stronger rebound should be seen back to 38.2% retracement of 1.2555 to 1.1176 at 1.1703. In that case, the structure of the rise from 1.1176 and reaction to 1.1703 fibonacci level will be watched for making an assessment on whether medium term trend has reversed, or rebound form 1.1176 is merely a correction.
GBP/USD Mid-Day Outlook
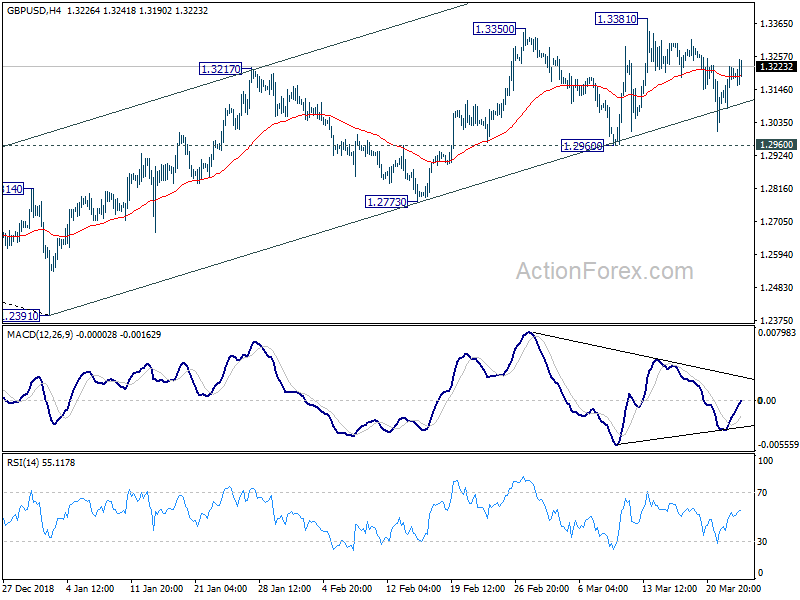
Daily Pivots: (S1) 1.3119; (P) 1.3172; (R1) 1.3262; More....
Intraday bias in GBP/USD remains neutral for consolidation below 1.3381. Further rise is expected with 1.2960 support intact. On the upside, firm break of 1.3381 will target 61.8% retracement of 1.4376 to 1.2391 at 1.3618 next. However, on the downside, firm break of 1.2960 will indicate that rebound from 1.2391 has completed earlier than expected. Deeper fall would then be seen to 1.2773 support for confirmation.
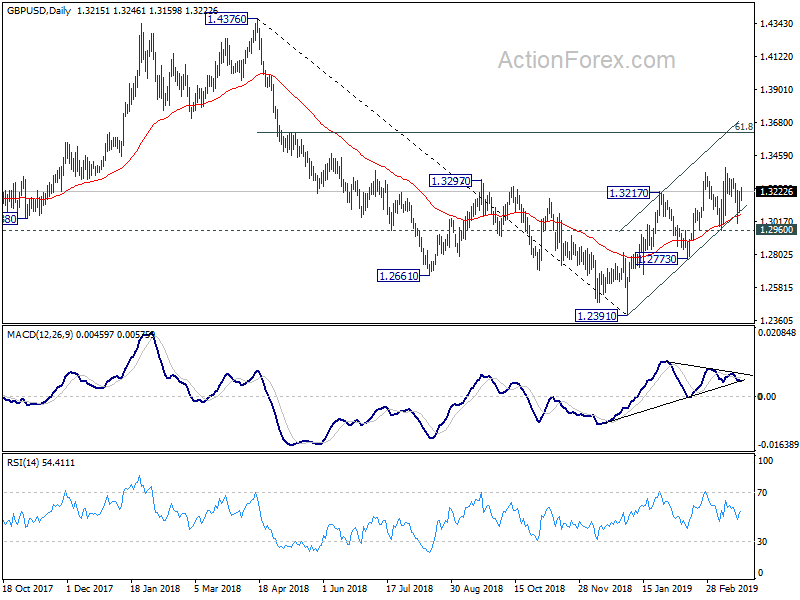
In the bigger picture, medium term decline from 1.4376 (2018 high) should have completed at 1.2391. Rise from 1.2391 is now seen as the third leg of the corrective pattern from 1.1946 (2016 low). Further rise could be seen through 1.4376 in medium term. On the downside, though, break of 1.2773 support will dampen this view. Focus will be turned back to 1.2391 low and break will resume the fall from 1.4376 to 1.1946.
USD/JPY Mid-Day Outlook
Daily Pivots: (S1) 109.45; (P) 110.18; (R1) 110.64; More...
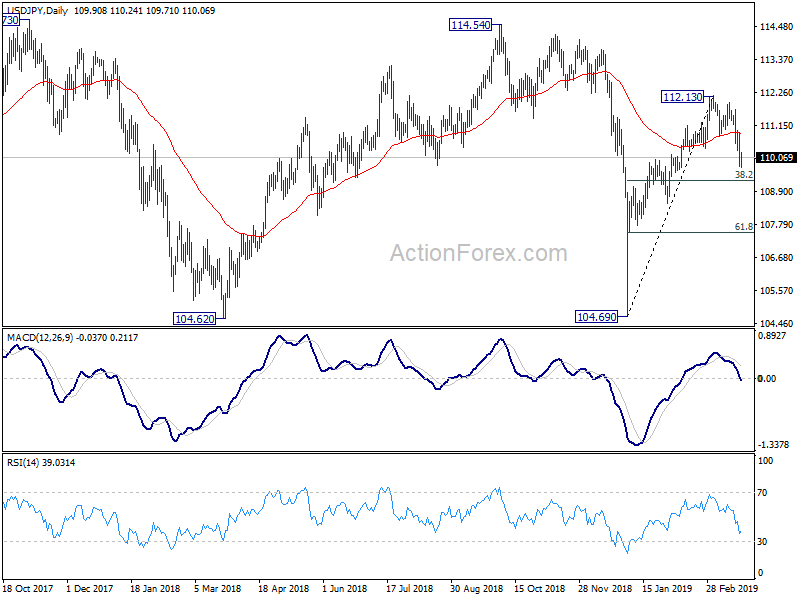
Intraday bias in USD/JPY remains on the downside for 38.2% retracement of 104.69 to 112.13 at 109.28. Prior break of 110.35 support argues that rebound from 104.69 is completed at 112.13 already. Break of 109.28 will target 61.8% retracement at 107.53 next. On the upside, break of 110.95 minor resistance will turn bias back to the upside for retesting 112.13 instead.
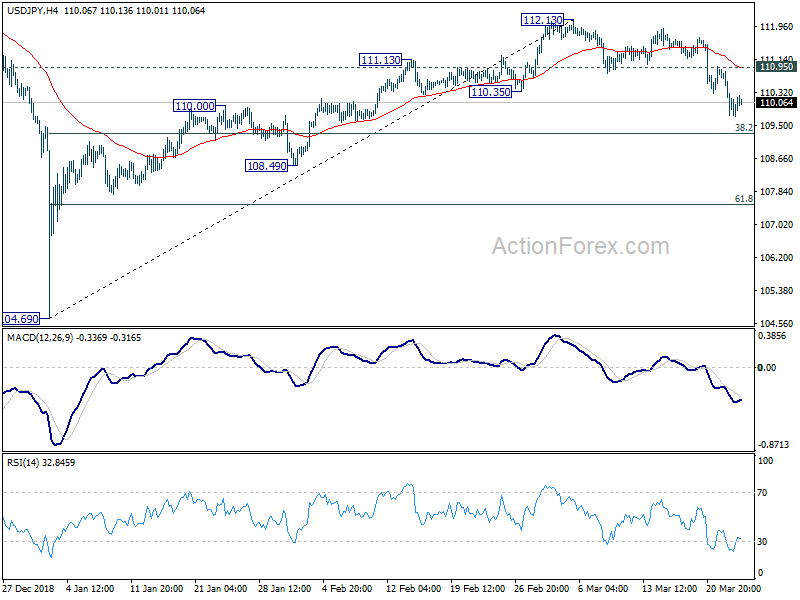
In the bigger picture, while the rebound from 104.69 was strong, USD/JPY failed to sustain above 55 week EMA (now at 110.91), and was kept well below 114.54 resistance. Medium term outlook is turned mixed and we'll wait for the structure of the fall from 112.13 to unveil to make an assessment later. For now, more range trading is expected between 104.69 and 112.13 first.
Canadian Dollar Unchanged on Light-Data Calendar
The Canadian dollar is unchanged on Monday, after USD/CAD rallied late last week. In the North American session, the pair is trading at 1.3430, unchanged on the day. There are no economic indicators on the schedule. In the U.S., we’ll hear from two FOMC members. On Tuesday, the U.S. publishes building permits and CB consumer confidence.
The Canadian dollar ended the week on a sour note, as soft consumer spending data weighed on the currency. Retail sales fell 0.3% in January, marking a third straight decline. Core retail sales gained a negligible 0.1%, shy of the estimate of 0.2%. There was better news on the inflation front, as CPI posted a sharp gain of 0.7% in January, edging above the forecast of 0.6%. The negative effect of weak oil prices has eased, which could bode well for inflation numbers in the first quarter. Still, the outlook for the Canadian economy is cloudy, with the ongoing global trade war weighing on Canada’s export-reliant economy.
Is a recession in the cards for the U.S. economy? At last week’s policy meeting, the Federal Reserve indicated it had no plans to raise interest rates in 2019 and also lowered its growth forecast for 2019 to 2.1%, down from 2.3% in December. There was more bad news on Friday, as the spread between 3-month and 10-year Treasury notes turned negative for the first time since 2007. This is known as an inverted yield curve, which is considered a recession indicator. All eyes will be on U.S. Final GDP, which will be released on Thursday. If GDP is weaker than expected, investors could lose their risk apetite and the Canadian dollar could lose ground.
USD/CHF Mid-Day Outlook
Daily Pivots: (S1) 0.9909; (P) 0.9940; (R1) 0.9966; More.....
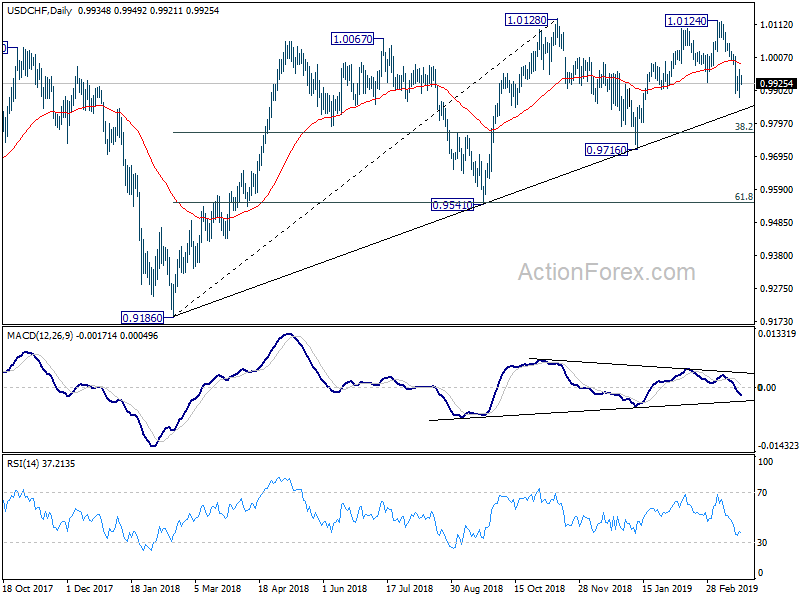
USD/CHF is staying in consolidation above 0.9879 temporary low. Intraday bias remains neutral first. Further decline remains in favor with 1.0010 minor resistance intact. On the downside, below 0.9879 will resume the fall from 1.0124 to 0.9716 key support. Nevertheless, break of 1.0010 will turn bias back to the upside for 1.0124/28 resistance zone.
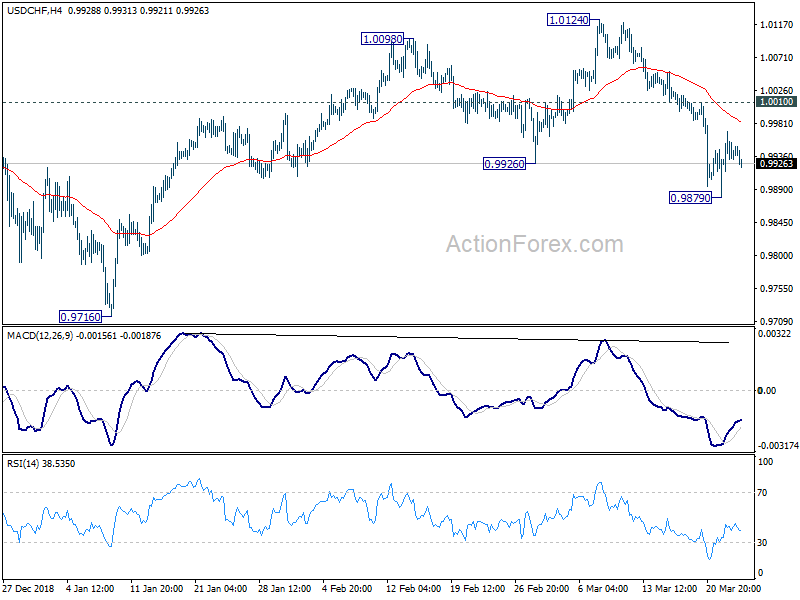
In the bigger picture, focus is back on medium term trend line (now at 0.9846). Decisive break there will argue that whole rise from 0.9186 has completed. Further break of 0.9716 will confirm reversal and target next support level at 0.9541. Nevertheless, there is still a chance that price action from 1.0128 are forming a consolidative pattern with fall from 1.0124 as third leg. If this is the case, stronger support should be seen between 0.9716 and the trend line to contain downside.