Sample Category Title
Trump delays new tariffs on China, Yuan jumps to 7-month high
Trump tweeted on Sunday that there was "substantial progress" made in US-China trade talks on "important structural issues including intellectual property protection, technology transfer, agriculture, services, currency, and many other issues". Hence he will be delaying the scheduled March 1 tariff increase. In other words, trade truce now extends beyond the date.
Trump added that assuming there is additional progresses, he is planning a summit with Chinese President Xi Jinping at Mar-a-Lago resort in Florida to conclude the agreement.
https://twitter.com/realDonaldTrump/status/1099800961089003522
https://twitter.com/realDonaldTrump/status/1099803719435239426
Later, Trump also said there could be "very big news over the next week or two" if all goes in well. He added that "China has been terrific. We want to make a deal that's great for both countries and that's really what we're going to be doing."
China's Xinhua also said the US and China have made "substantial progress" on specific issues in the latest round of trade talks.
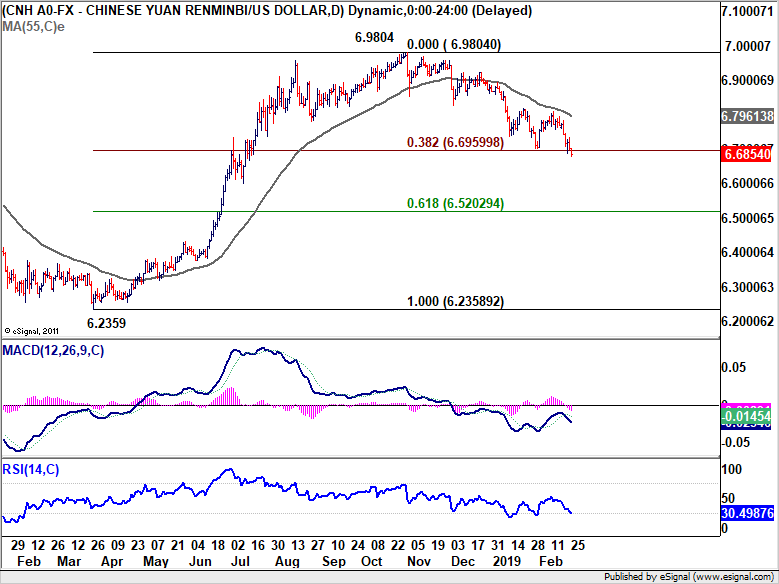
USD/CNH (offshore Yuan), resumes recent decline and hits a seven month low after the news. It's now heading back to 61.8% retracement of 6.2359 to 6.9804 at 6.5020.
Eco Data 2/25/19
[php_everywhere instance="1"]
EUR/USD Weekly Outlook
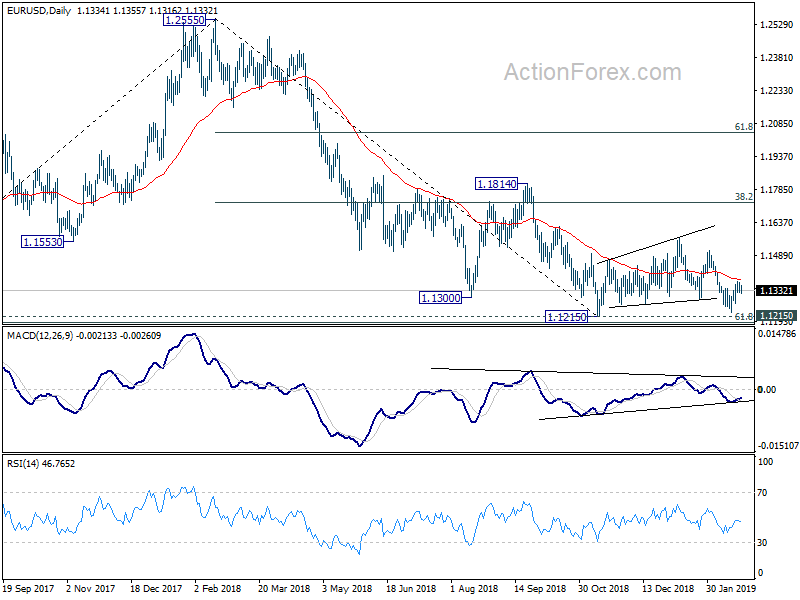
EUR/USD recovered further to 1.1371 last week but formed a temporary top there and turned sideway. Initial bias is neutral this week first. On the upside, break of 1.1371 would extend the rebound from 1.1234. In that case, rise from 1.1234 is seen as another leg in the consolidation pattern from 1.1215 and should target 1.1514 resistance. On the downside, break of 1.1275 minor support will turn bias back to the downside for 1.1215 low instead. Decisive break there will confirm completion of consolidation from 1.1215, and resumption of down trend from 1.2555.
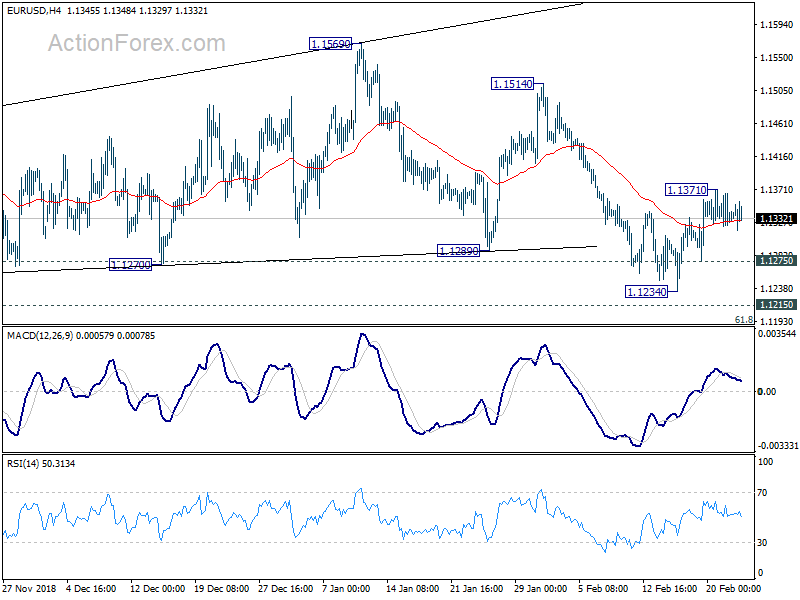
In the bigger picture, as long as 1.1814 resistance holds, down trend down trend from 1.2555 medium term top is still in progress and should target 61.8% retracement of 1.0339 (2017 low) to 1.2555 at 1.1186 next. Sustained break there will pave the way to retest 1.0339. However, break of 1.1814 will confirm completion of such down trend and turn medium term outlook bullish.
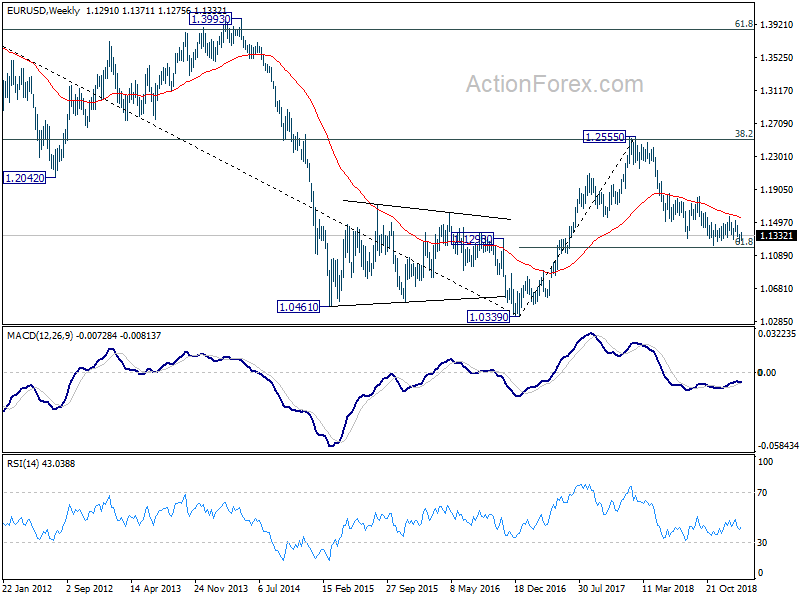
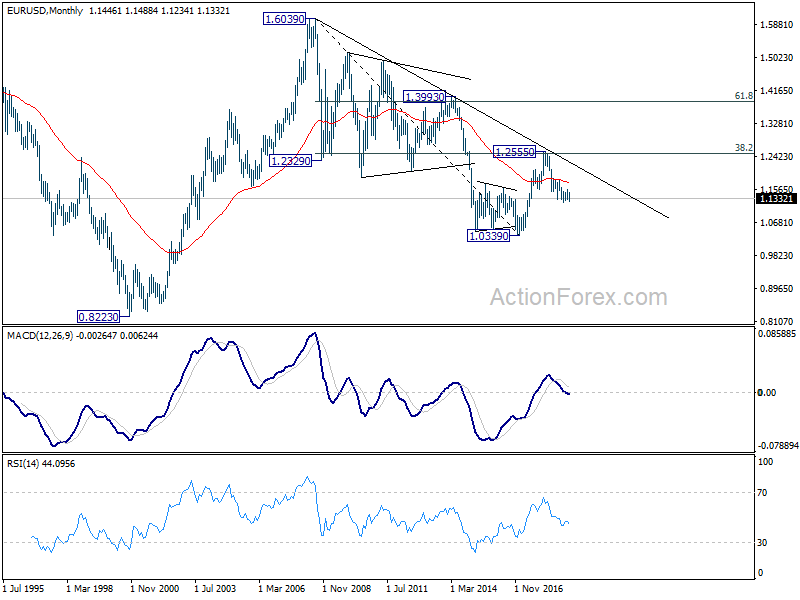
In the long term picture, the rejection from 38.2% retracement of 1.6039 to 1.0339 at 1.2516 argues that long term down trend from 1.6039 (2008 high) might not be over yet. EUR/USD is also held below decade long trend line resistance. Firm break of 61.8% retracement of 1.0339 to 1.2555 at 1.1186 should at least bring a retest on 1.0339 low. This will remain the favored case as long as 1.1814 resistance holds.
USD/JPY Weekly Outlook
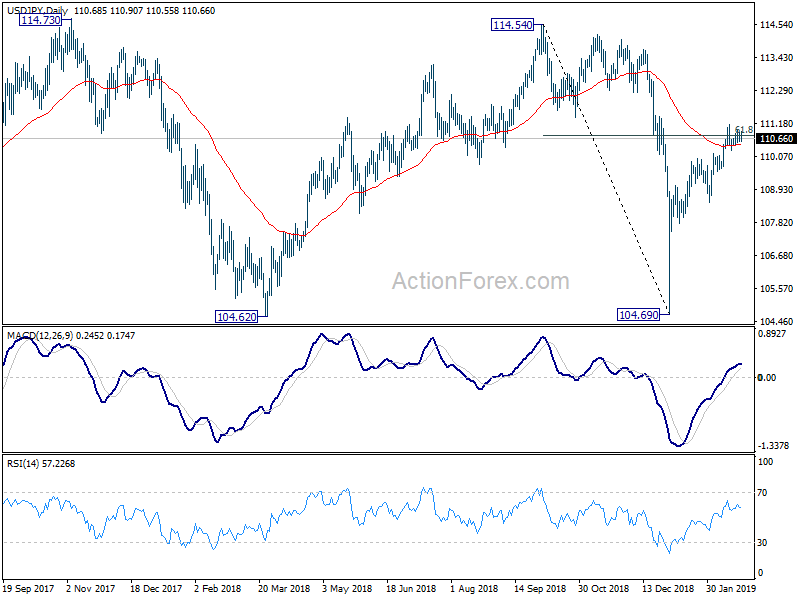
USD/JPY stayed in range below 111.13 last week and outlook is unchanged. Initial bias remains neutral this week first. On the downside, break of 110.00 resistance turned support will suggest rejection by 61.8% retracement of 114.54 to 104.69 at 110.77 and the rebound from 104.69 has likely completed. Intraday bias will be turned back to the downside for 108.49 support for confirmation. Nevertheless, break of 111.13 should confirm resumption of rise from 104.69 for 114.54 resistance.
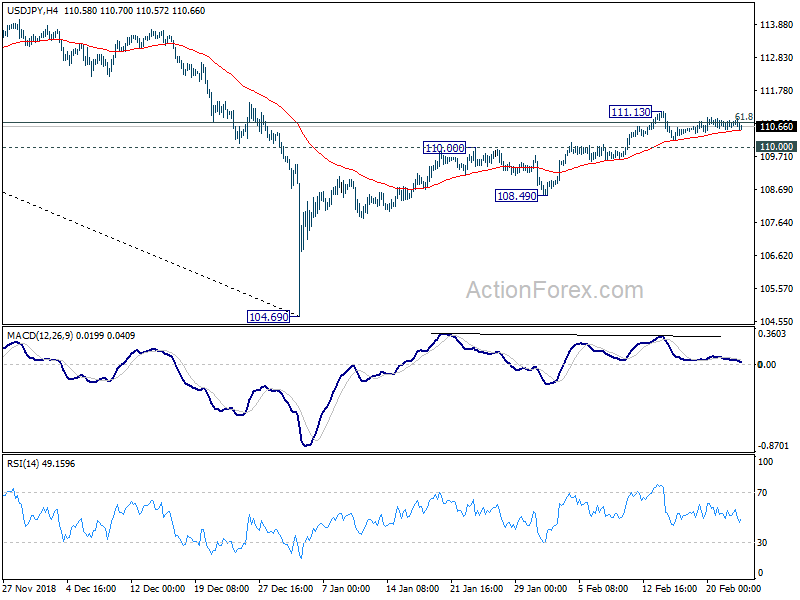
In the bigger picture, while the rebound from 104.69 was stronger than expected, it's struggle to get rid of 55 day EMA completely. Outlook is turned mixed first. On the downside, break of 108.49 support will revive that case that such rebound was a correction. And, larger down trend is still in progress for another low below 104.62. But sustained trading above 55 day EMA will turn focus to 114.54. Decisive break there will confirmation completion of the decline from 118.65 (2016 high).
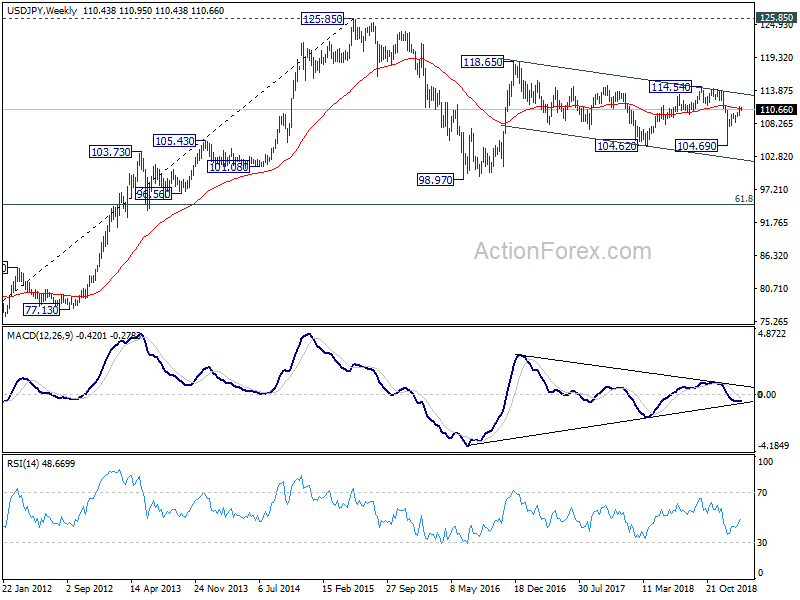
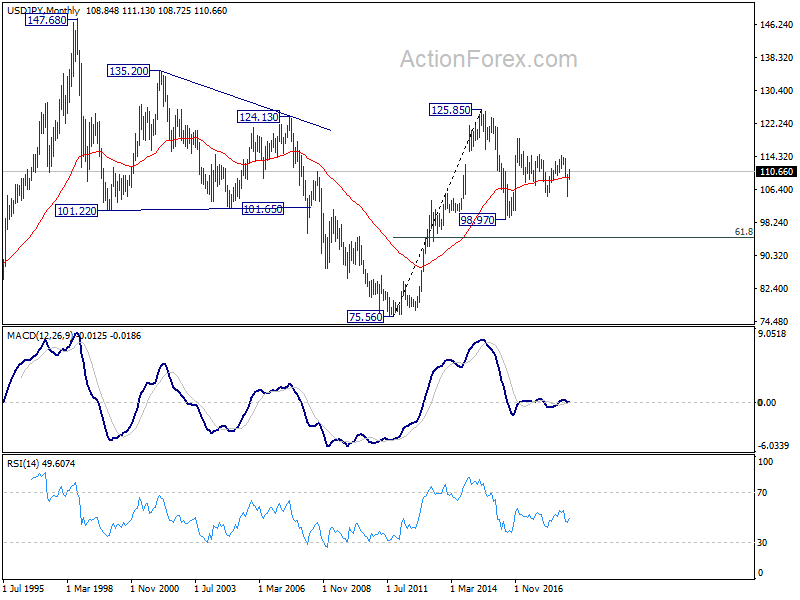
In the long term picture, the rise from 75.56 (2011 low) long term bottom to 125.85 (2015 high) is viewed as an impulsive move, no change in this view. Price actions from 125.85 are seen as a corrective move which could still extend. In case of deeper fall, downside should be contained by 61.8% retracement of 75.56 to 125.85 at 94.77. Up trend from 75.56 is expected to resume at a later stage for above 135.20/147.68 resistance zone.
GBP/USD Weekly Outlook
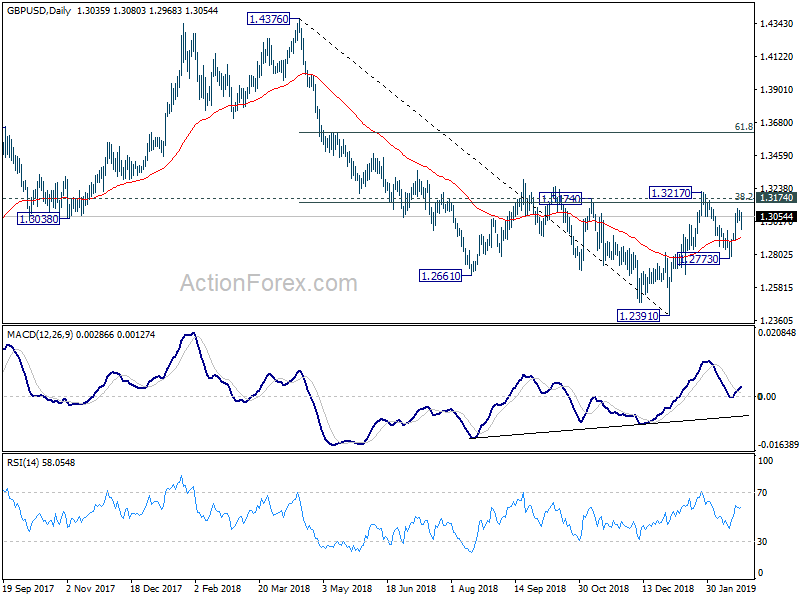
GBP/USD's strong rebound last week suggests that pull back from 1.3217 has completed at 1.2773. But as a temporary top was formed at 1.3109, initial bias is neutral this week first. On the upside, above 1.3109 will target 1.3174/3217 resistance zone. Decisive break there will complete a head and shoulder bottom pattern (ls: 1.2661, h: 1.2391, rs: 1.2773). That would indicate bullish reversal for 61.8% retracement of 1.4376 to 1.2391 at 1.3618 next. On the downside, break of 1.2938 minor support will turn bias back to the downside for 1.2773 instead.
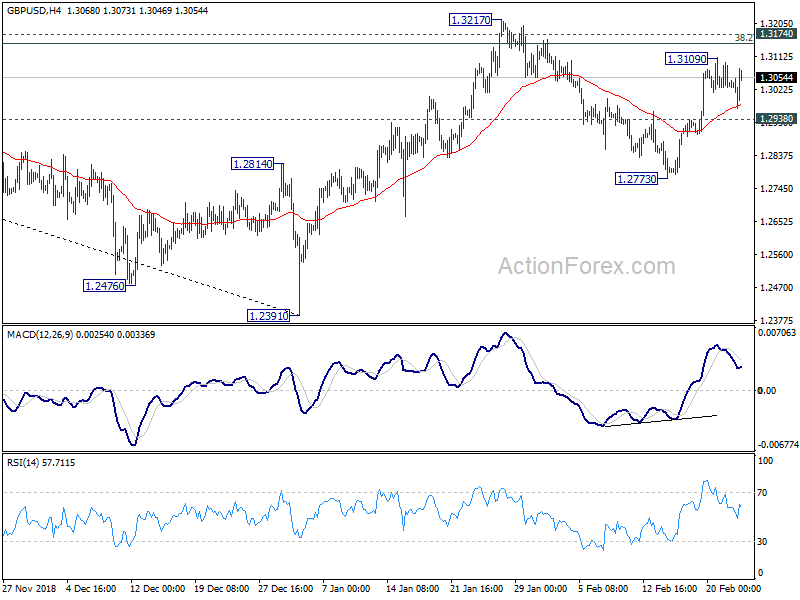
In the bigger picture, focus is back on 1.3174 resistance with current rebound. Sustained break will indicate completion of decline from 1.4376. Rise from 1.2391 would then be seen as the third leg of the corrective pattern from 1.1946 (2016 low). In that case, further rise could be seen through 1.4376 resistance. Nevertheless, rejection by 1.3174 again will extend the decline from 1.4376 through 1.2391 to 1.1946 low.
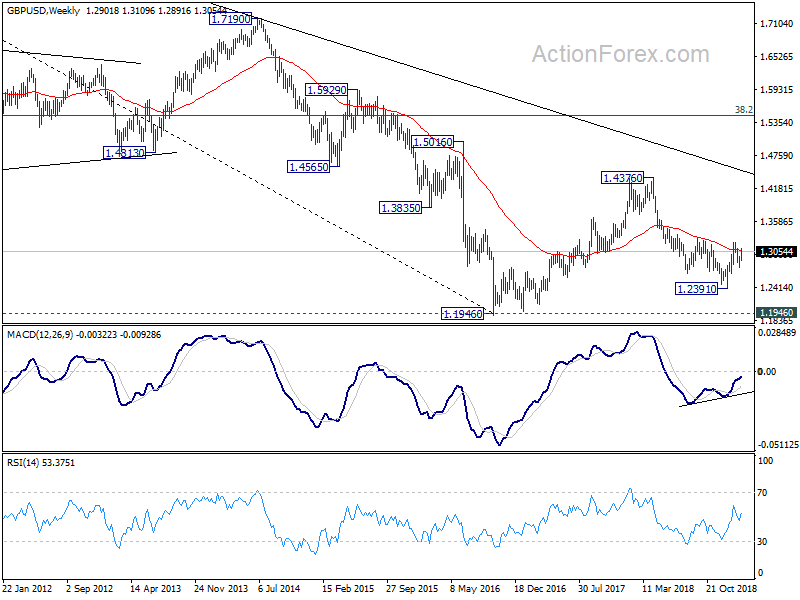
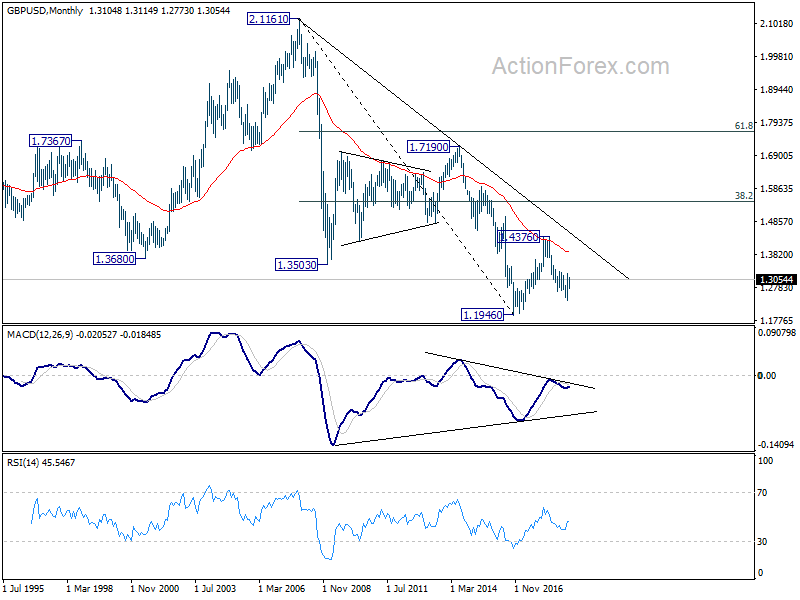
In the longer term picture, current development argues that corrective pattern from 1.1946 (2016 low) is extending with another rise. But there is no change in the long term bearish outlook as long as 38.2% retracement of 2.1161 (2007 high) to 1.1946 at 1.5466 holds. An eventual downside breakout through 1.1946 is still in favor in the long term.
USD/CHF Weekly Outlook
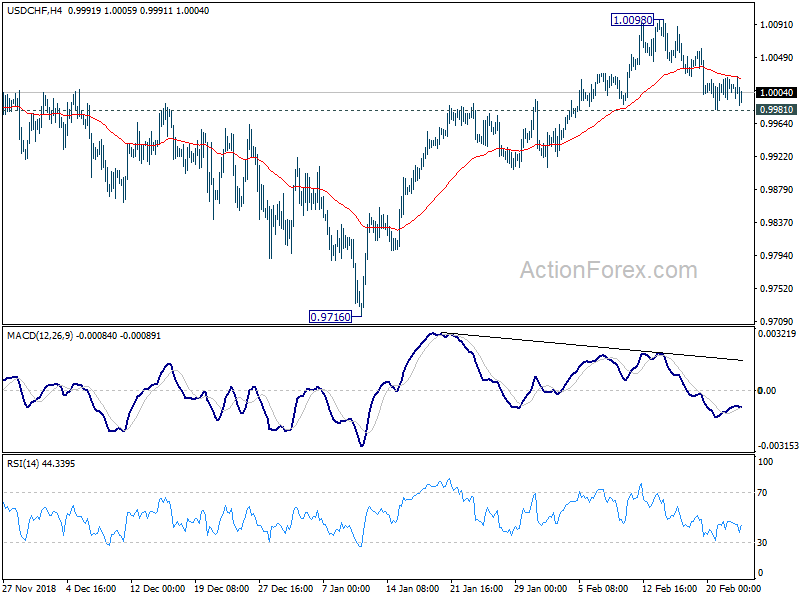
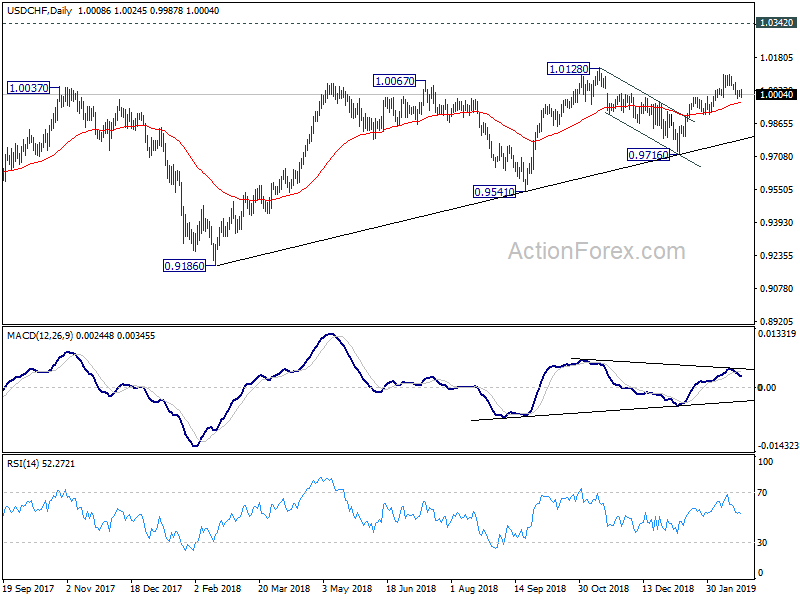
USD/CHF dropped to 0.9981 last week but turned sideway since then. Initial bias is neutral this week first. On the downside, break of 0.9981 will resume the decline from 1.0098. Sustained trading below 55 day EMA (now at 0.9964) should confirm completion of rise form 0.9716, after rejection by 1.0128 resistance. In that case, deeper fall would be seen back towards 0.9716 support. On the upside, break of 1.0098 will extend the rise from 0.9716 to 1.0128 high next.
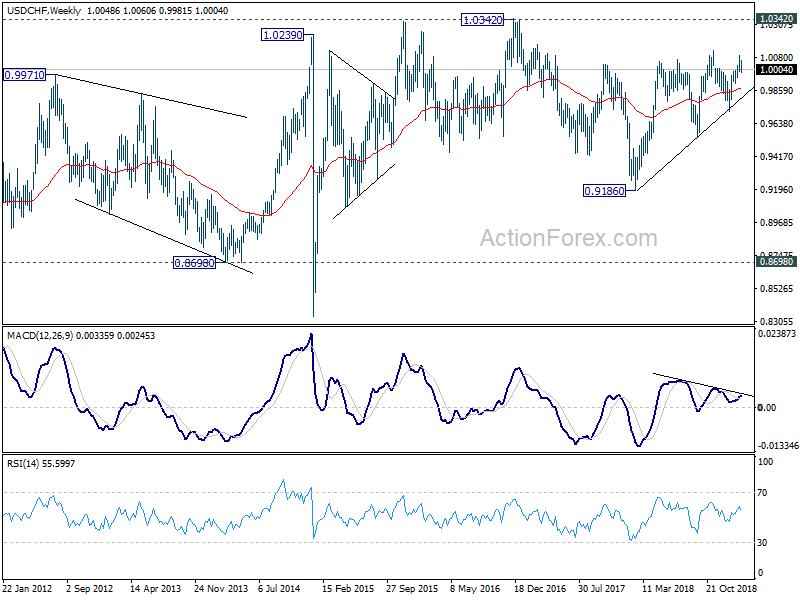
In the bigger picture, USD/CHF drew strong support from medium term trend line and rebounded. That suggests rise from 0.9186 is still in progress. Further break of 1.0128 will confirm up trend resumption and target 1.0342 key resistance. Nevertheless, break of 0.9716 will dampen this bullish view and at least bring deeper fall to 0.9541 key support.
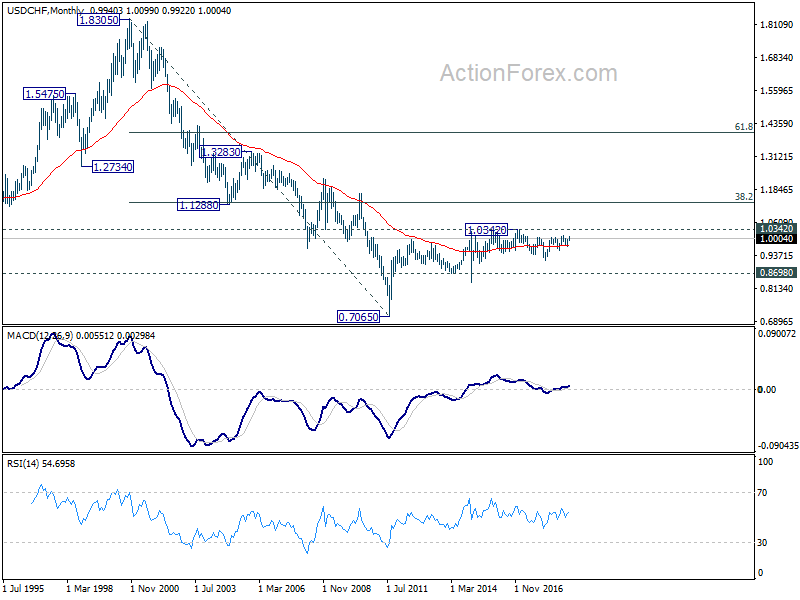
In the long term picture, price actions from 0.7065 (2011 low) are not clearly impulsive yet. Thus, we'll treat it as developing into a corrective pattern, at least, until a firm break of 1.0342 resistance.
AUD/USD Weekly Outlook
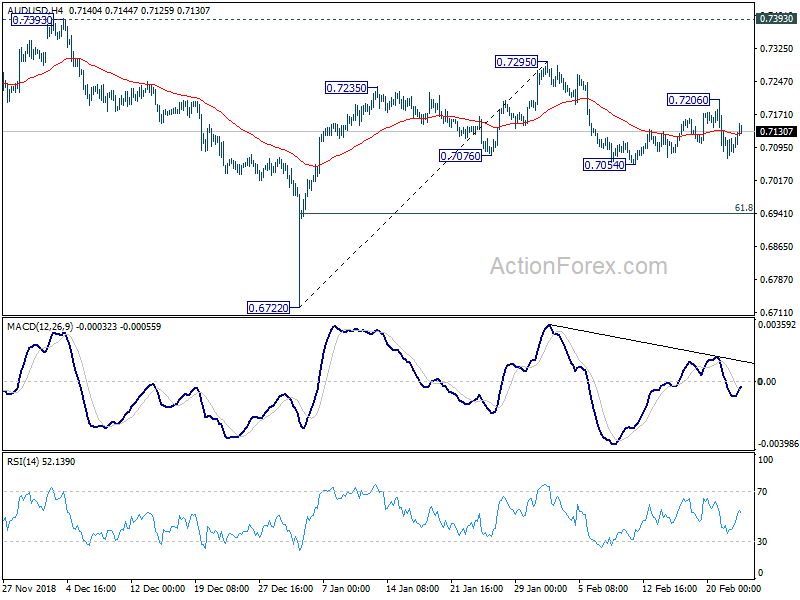
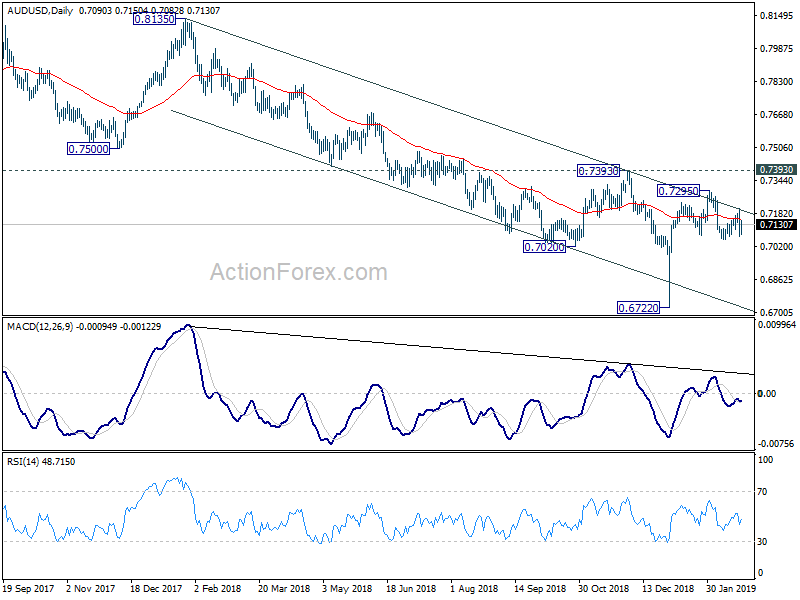
AUD/USD recovered to 0.7206 last week but upside was held well below 0.7295 resistance. Nevertheless, as fall from 0.7206 was contained above 0.7054 support, initial bias is neutral this week first. On the downside, decisive break of 0.7054 will complete a head and shoulder reversal pattern (ls: 0.7235, h: 0.7295, rs: 0.7206). That should confirm completion of rebound from 0.6722. Further decline should be seen to 61.8% retracement of 0.6722 to 0.7295 at 0.6941 next. On the upside, though, break of 0.7206 will turn focus back to 0.7295 resistance instead.
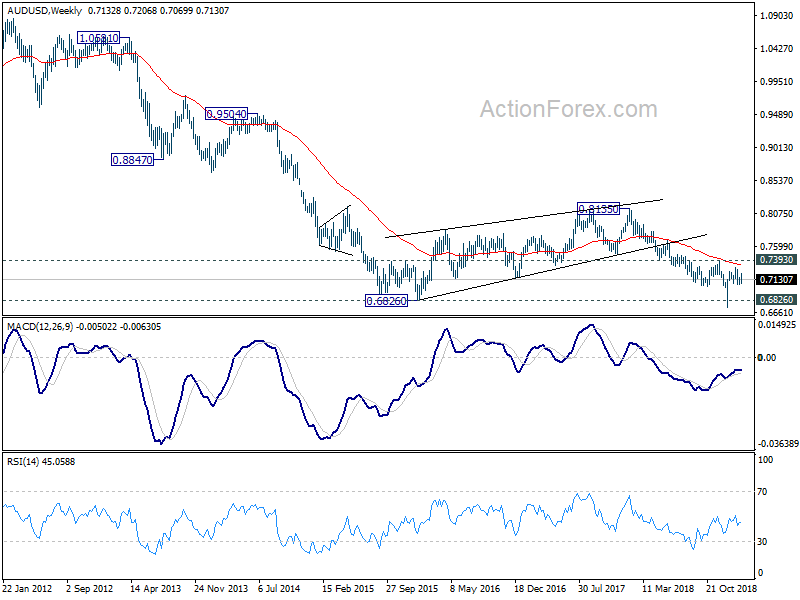
In the bigger picture, as long as 0.7393 resistance holds, we'd treat fall from 0.8135 as resuming long term down trend from 1.1079 (2011 high). Decisive break of 0.6826 (2016 low) will confirm this bearish view and resume the down trend to 0.6008 (2008 low). However, firm break of 0.7393 will argue that fall from 0.8135 has completed. And corrective pattern from 0.6826 has started the third leg, targeting 0.8135 again.
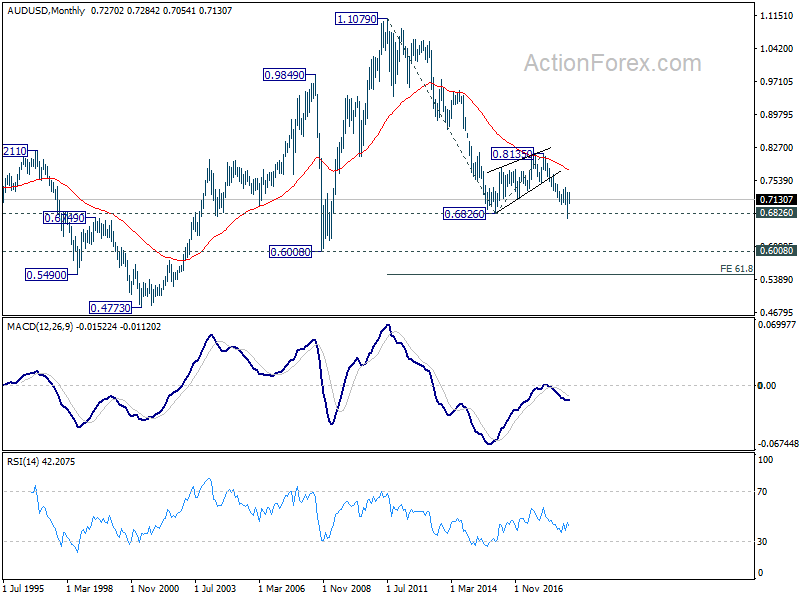
In the longer term picture, prior rejection by 55 month EMA maintained long term bearishness in AUD/USD. That is, down trend from 1.1079 (2011 high) is still in progress. Sustained break of 0.6826 will target 0.6008 low and then 61.8% projection of 1.1079 to 0.6826 from 0.8135 at 0.5507.
USD/CAD Weekly Outlook
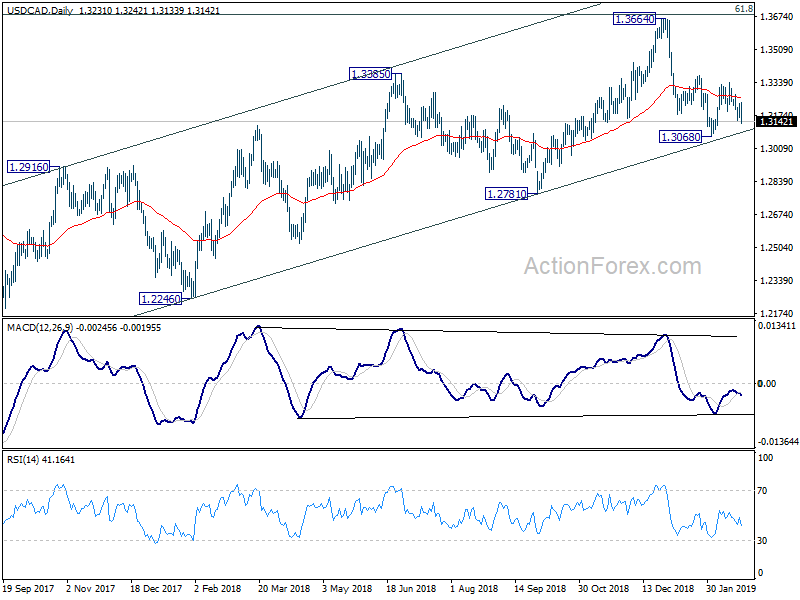
Despite some brief recovery, USD/CAD's decline from 1.3340 extended to as low as 1.3133 last week. Initial bias is back on the downside for 1.3068 key support. Decisive break there will firstly resume whole fall from 1.3664. Secondly, it will be a strong sign of medium term bearish reversal. On the upside, above 1.3242 minor resistance will turn bias back to the upside for 1.3340 resistance instead.
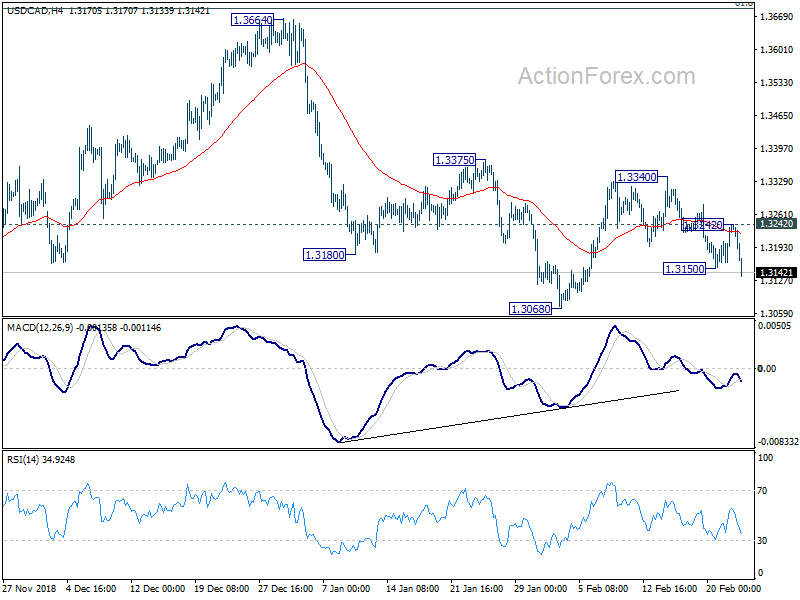
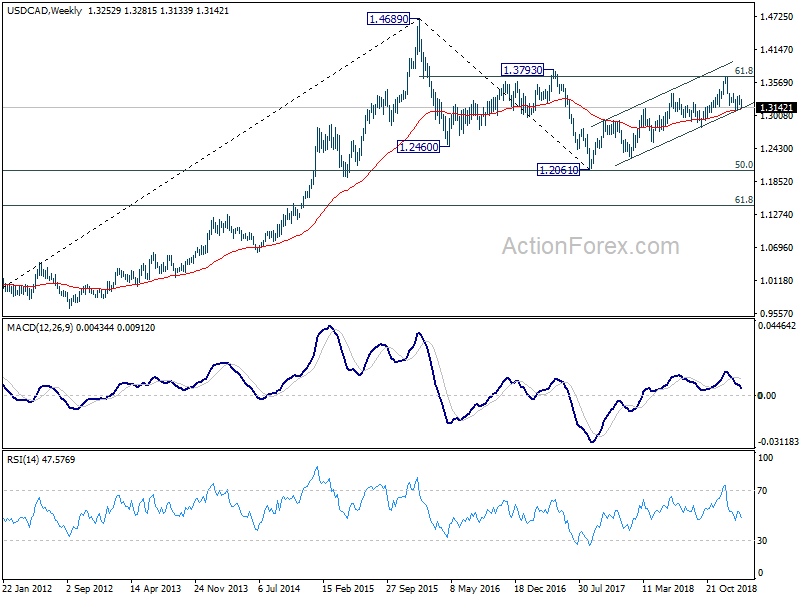
In the bigger picture, structure of the medium term rise from 1.2061 (2017 low) to 1.3664 is not clearly impulsive. Hence, we'd stay cautious on strong resistance from 61.8% retracement of 1.4689 (2016 high) to 1.2061 at 1.3685 and 1.3793 resistance to limit upside, and bring medium term topping. But in any case, medium term outlook will stay bullish as long as channel support (now at 1.3099) holds. Sustained break of 1.3793 will pave the way to retest 1.4689 (2015 high). Firm break of the channel support should confirm reversal target 1.2061 low again.
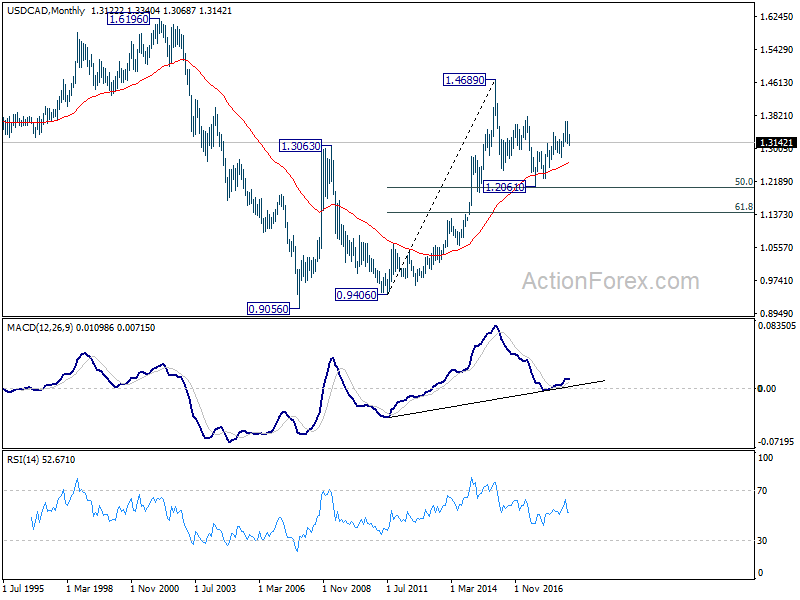
In the longer term picture, corrective fall from 1.4689 (2015 high) should have completed with three waves down to 1.2061, just ahead of 50% retracement of 0.9406 (2011 low) to 1.4689 (2015 high) at 1.2048. The development keeps long term up trend from 0.9406 and that from 0.9056 (2007 low) intact. For now, there is still prospect of extending the long term up trend through 1.4689.
GBP/JPY Weekly Outlook
GBP/JPY rose to 145.04 last week before forming a temporary top a retreated. Initial bias is neutral this week first. The break of 144.85 resistance suggests resumption of rebound from 131.51. Break of 145.04 will extend the rally. But we'd expect strong resistance from trend line (now at 146.75) to limit upside, at least on first attempt. On the downside, firm break of 141.00 support will suggest completion of the rebound and turn bias to the downside.
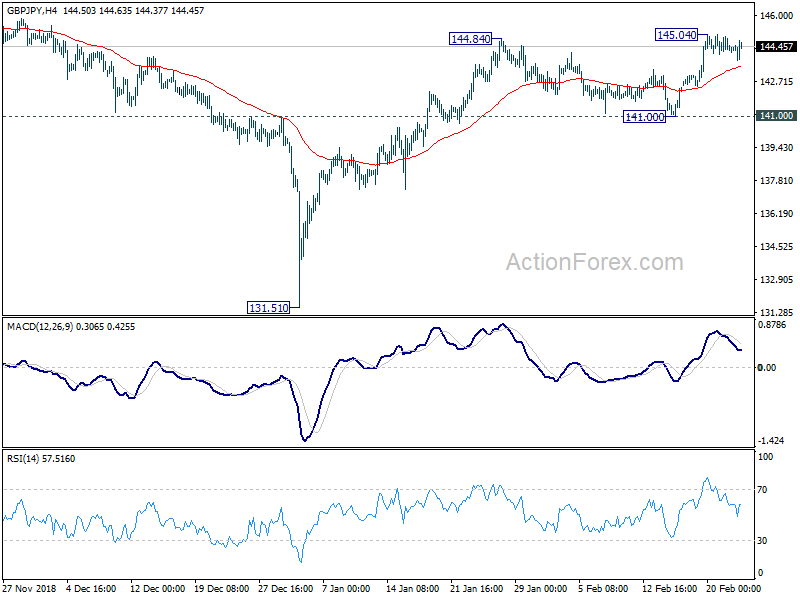
In the bigger picture, the strong rebound from 131.51 suggests that medium term fall from 156.59 (2018 high) has completed already. The corrective structure of such decline is turn argues that it's the second leg of the corrective pattern from 122.36 (2016 low). And this pattern is starting the third leg. On the upside, decisive break of 149.38 will pave the way to 156.59 resistance and above.
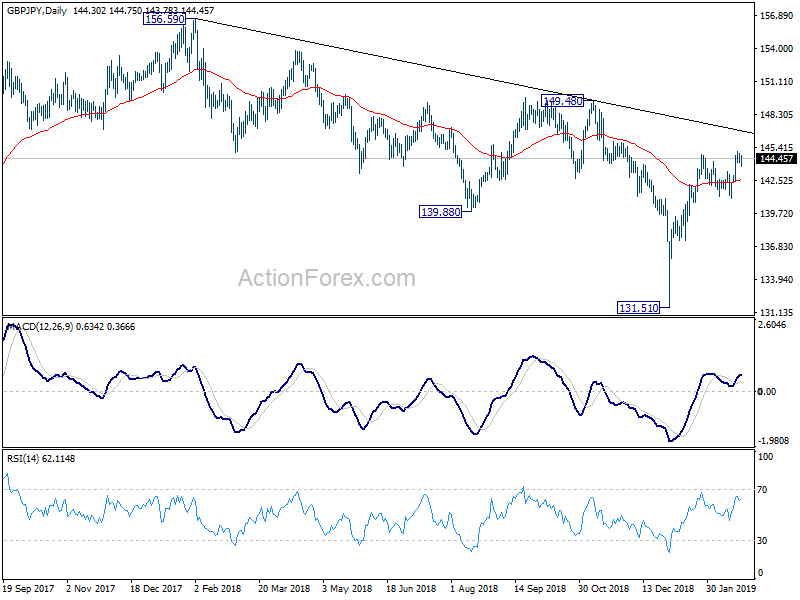
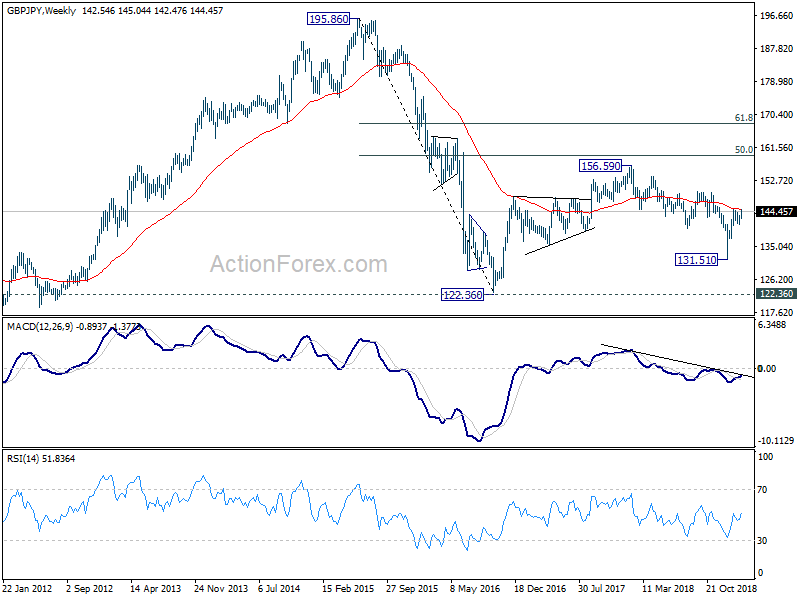
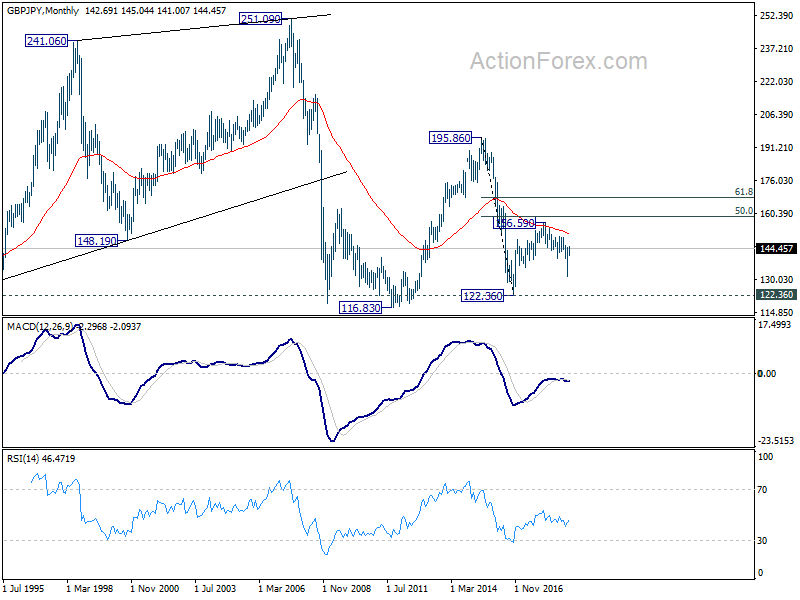
In the longer term picture, the rise from 122.36 (2016 low) to 156.59 (2018 high) doesn't display a clear impulsive structure. Thus, we're treating price actions from 122.36 as a corrective pattern. In case of an extension, strong resistance is likely to be seen at 50% retracement of 195.86 (2015 high) to 122.36 at 159.11 to limit upside. On the downside, break of 131.51 support will bring 122.26 low back into focus.
EUR/JPY Weekly Outlook
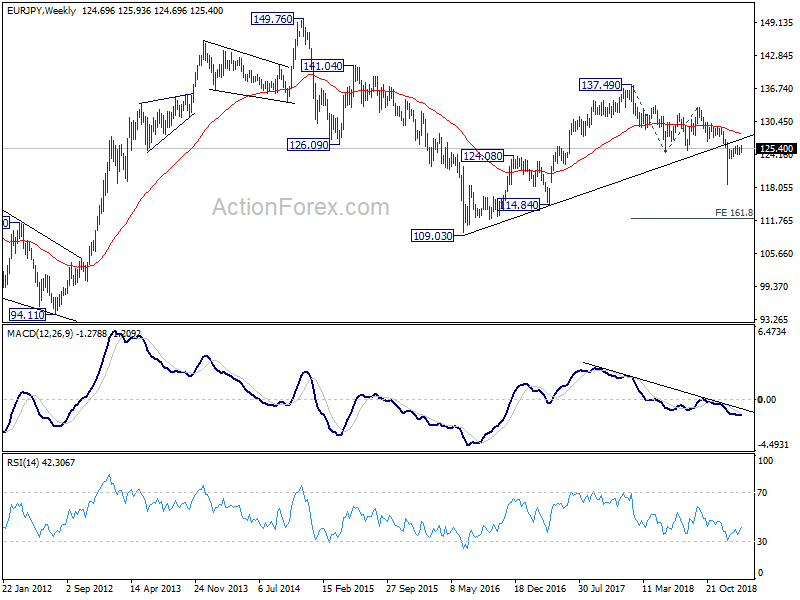
EUR/JPY rebounded to 125.93 last week but failed to break through 125.95 resistance. Initial bias remains neutral this week first. On the downside, break of 123.78 support will suggest completion of rebound from 118.62 after rejection by 55 day EMA. Deeper fall would then be seen back to retest 118.62 low. However, decisive break of 125.95 will dampen our bearish view and target 129.25 resistance next.
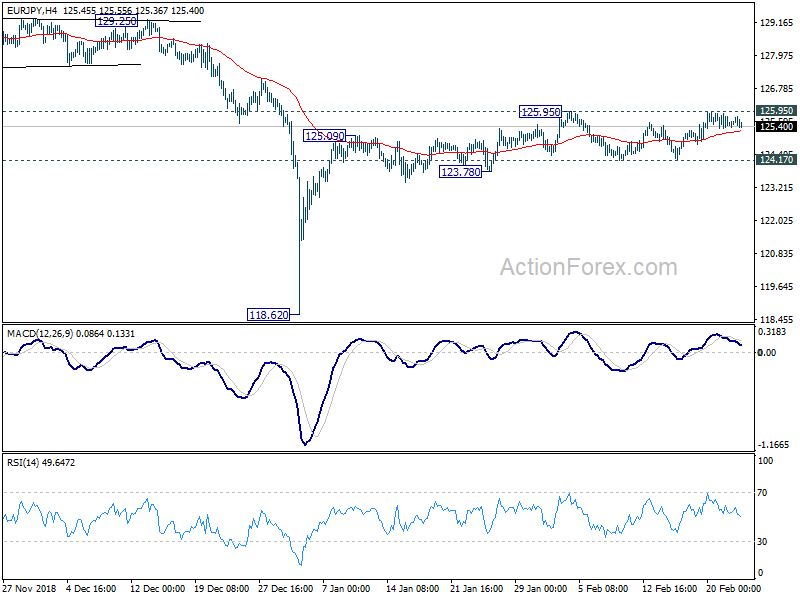
In the bigger picture, medium term rebound from 109.03 (2016 low) has completed at 137.49 (2018 high) already, with corrective structure. Fall from 137.49 is likely still in progress. Decisive break of 118.62 will target 161.8% projection of 137.49 to 124.61 from 133.12 at 112.28, which is inside 109.03/114.84 support zone. This will remain the favored case as long as 129.25 resistance holds.
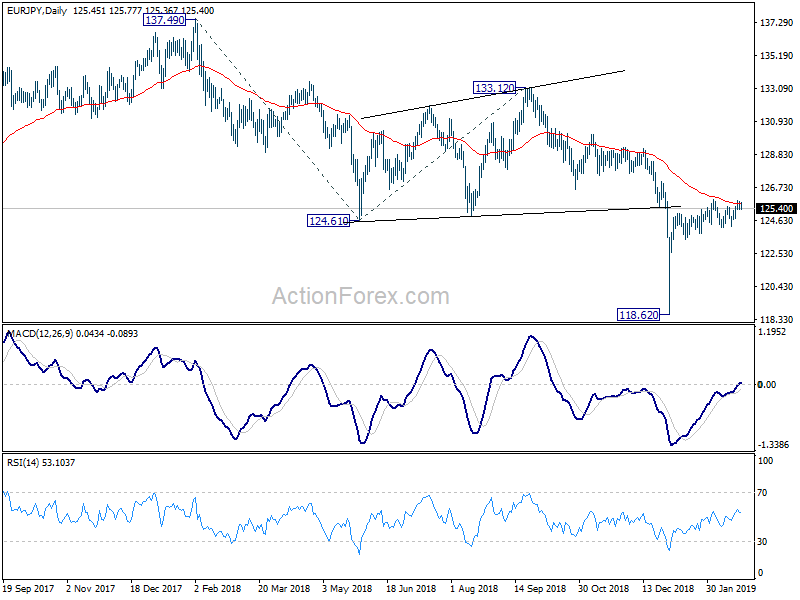
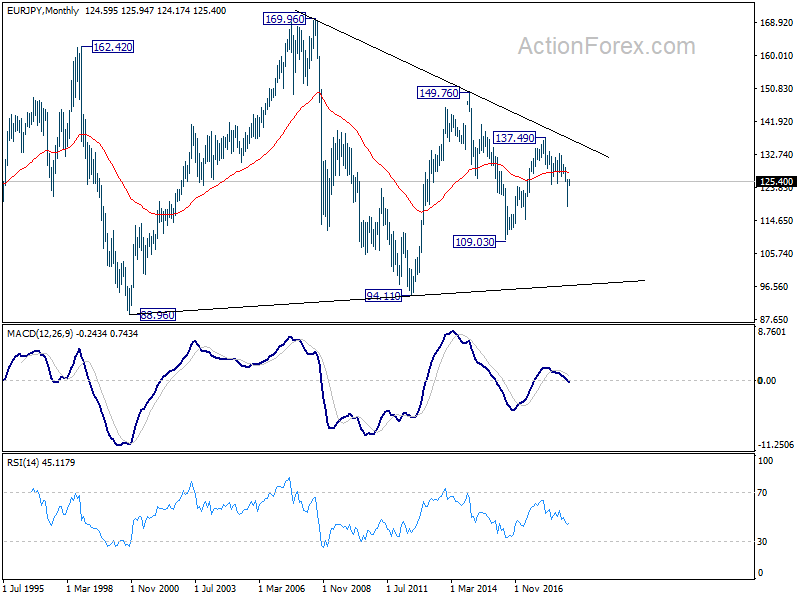
In the long term picture, EUR/JPY is staying in long term sideway pattern, established since 2000. Fall from 137.49 is seen as a falling leg inside the pattern. It could extend through 109.03 to resume the decline from 149.76 But in that case, we'd expect strong support around 94.11 (2012 low) to bring reversal.