Sample Category Title
EUR/GBP Weekly Outlook
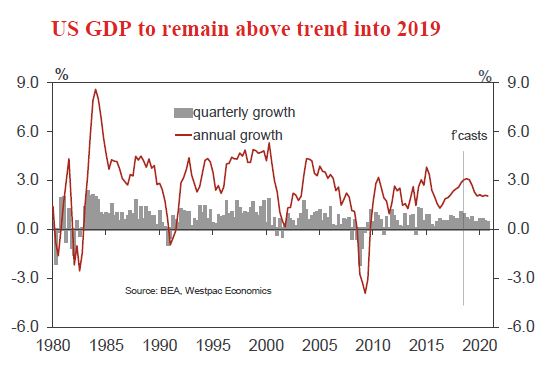
EUR/GBP's decline from 0.8840 extended to as low as 0.8660 last week before recovering slightly. The development argues that corrective rise from 0.8617 might have completed already. Initial bias is neutral this week first with deeper decline is favor. Break of 0.8666 will target 0.8617/20 key support zone. Decisive break there will resume larger down trend. On the upside, above 0.8762 minor resistance will turn bias to the upside for 0.8840 resistance instead.
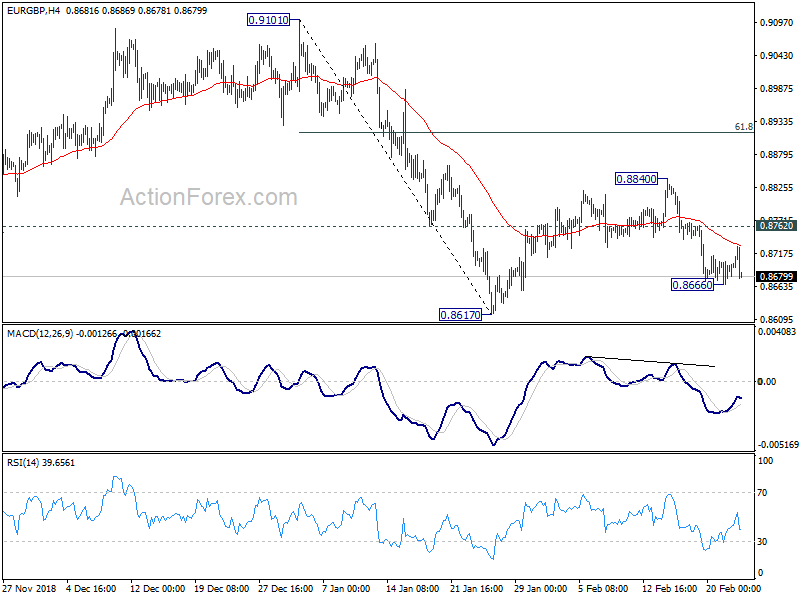
In the bigger picture, EUR/GBP is seen as staying in long term range pattern started at 0.9304 (2016 high). On the downside, decisive break of 0.8620 support will resume the falling leg from 0.9305 (2017 high) to 100% projection of 0.9305 to 0.8620 from 0.9101 at 0.8416. In that case, we'd expect strong support around 0.8312 to contain downside and bring rebound.
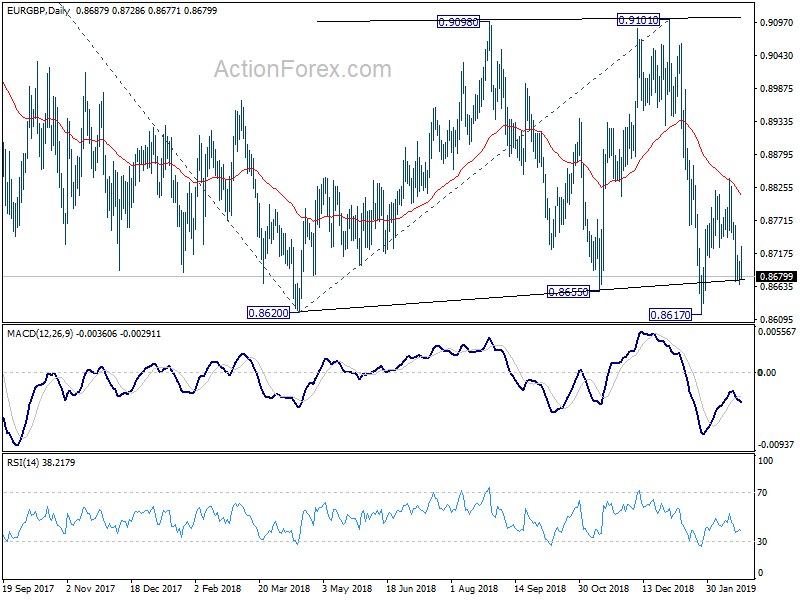
In the long term picture, we're holding on to the view that rise from 0.6935 (2015 low) is resuming the up trend from 0.5680 (2000 low). As long as 0.8116 cluster support (50% retracement of 0.6935 to 0.9304 at 0.8120) holds, further rise should be seen through 0.9305 to 0.9799 and above down the road.
EUR/AUD Weekly Outlook
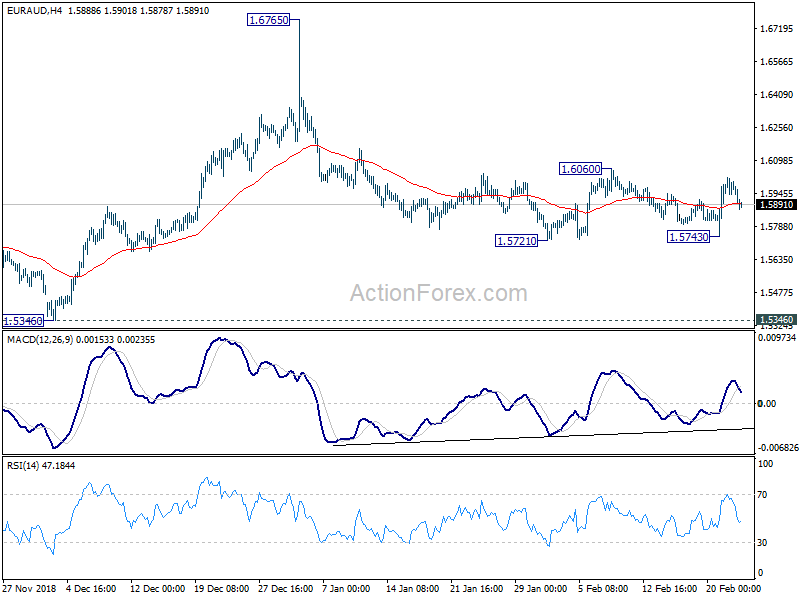
EUR/AUD dipped to 1.5743 last week but recovered strongly since then. Initial bias remains neutral this week and we'd favor further rise ahead. On the upside, decisive break of 1.6060 resistance should confirm that decline from 1.6765 has completed. Further rally should then be seen to retest 1.6765 high. On the downside, however, break of 1.5721 will extend the decline to 1.5346 support instead.
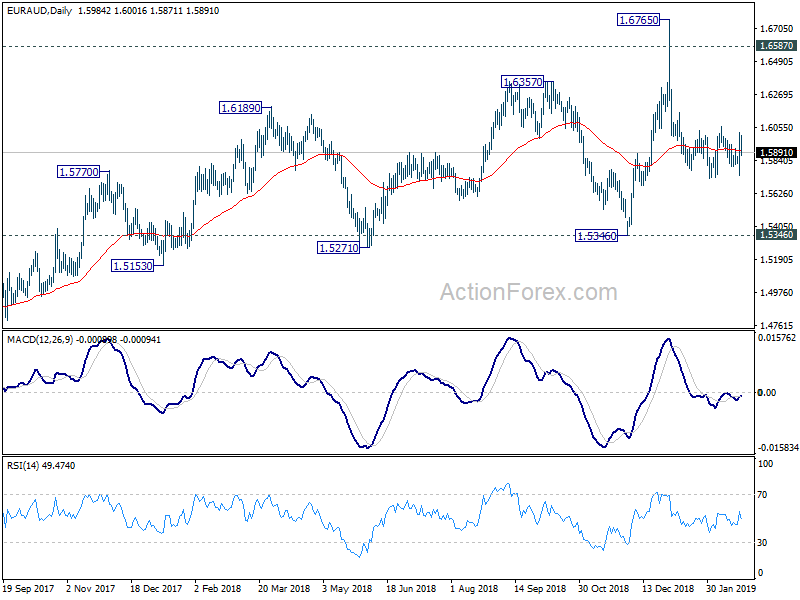
In the bigger picture, as long as 1.5346 support holds, outlook will remain bullish. Uptrend from 1.1602 (2012 low) is expected to resume sooner or later. Break of 1.6765 will target 61.8% retracement of 2.1127 (2008 high) to 1.1602 at 1.7488 next. However, firm break of 1.5346 key support will indicate trend reversal, with bearish divergence condition in weekly MACD, and turn outlook bearish.
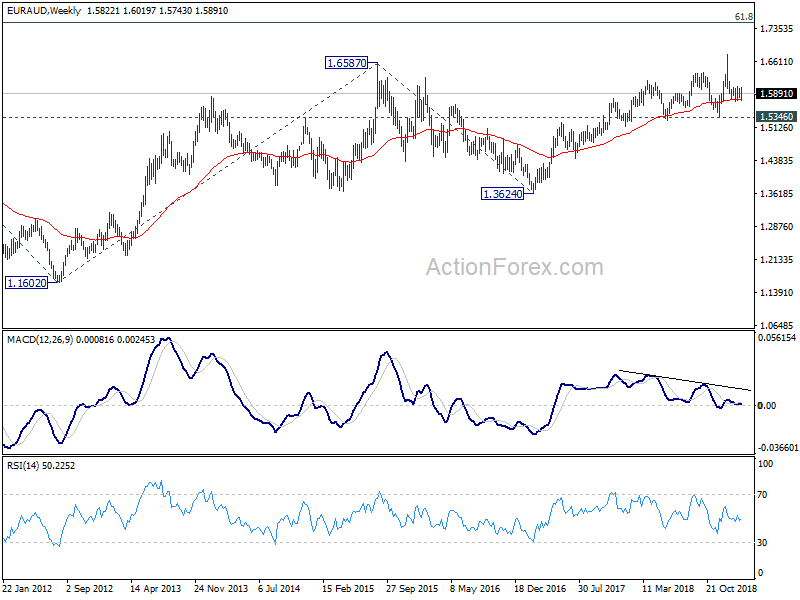
In the longer term picture, the rise from 1.1602 long term bottom (2012 low) is still in progress for 61.8% retracement of 2.1127 to 1.1602 at 1.7488. Firm break there will pave the way to 100% projection of 1.1602 to 1.6587 from 1.3624 at 1.8069. This will remain the favored case as long as 1.5346 remains intact.
EUR/CHF Weekly Outlook
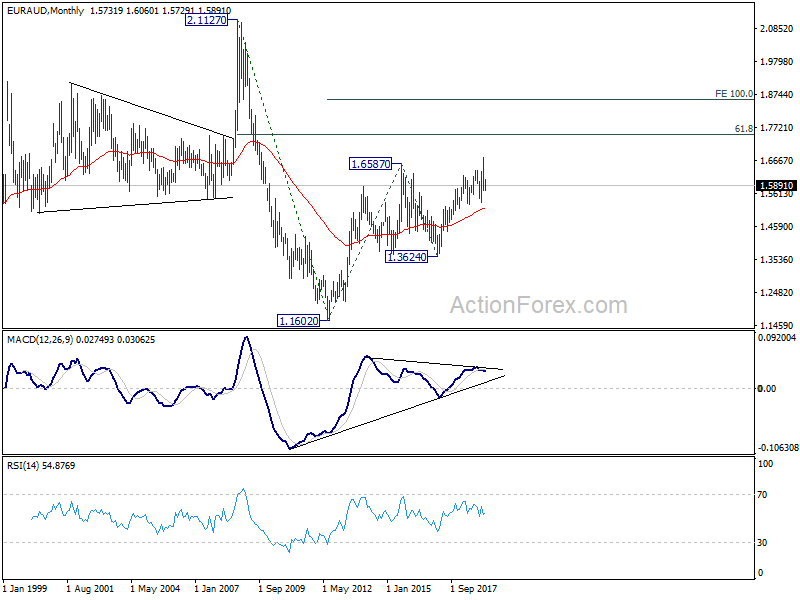
EUR/CHF gyrated inside range of 1.1310/1444 last week and outlook is unchanged. Initial bias remains neutral this week first. As long as 1.1310 support holds, further rise is mildly in favor. On the upside, break of 1.1444 will resume the rebound from 1.1181 to 1.1501 key resistance next. Nevertheless, sustained break of 1.1310 will suggest that rebound from 1.1181 might be completed. Intraday bias will be turned back to the downside for 1.1181 low again.
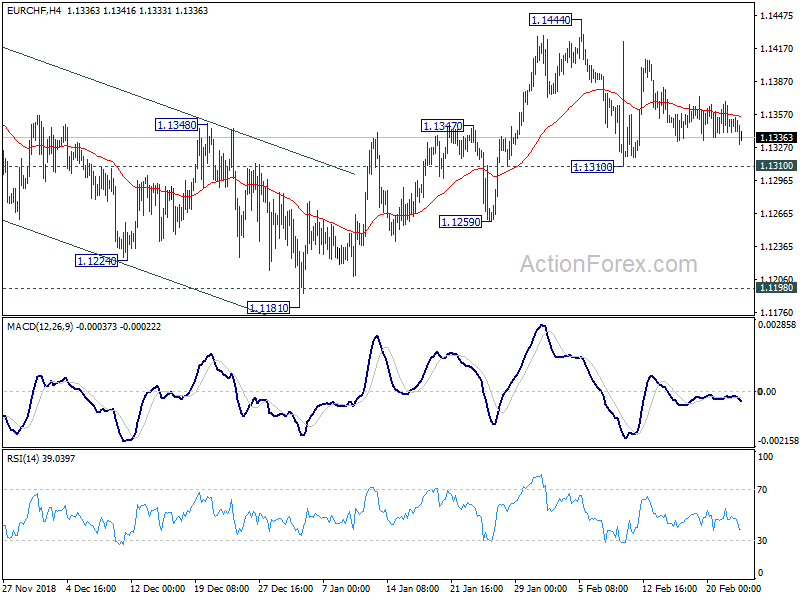
In the bigger picture, price actions from 1.2004 medium term top is seen as a correction only. Downside should be contained by 1.1154/98 support zone to complete it and bring rebound. Decisive break of 1.1501 (38.2% retracement of 1.2004 to 1.1173 at 1.1490) will confirm completion of the correction, on bullish convergence condition in daily MACD. Further rise should be seen to 61.8% retracement at 1.1687 and above next.
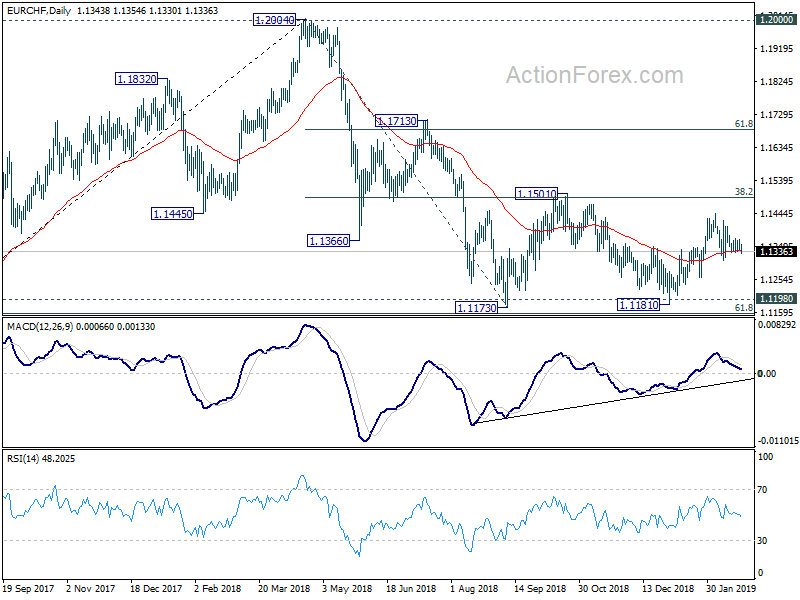
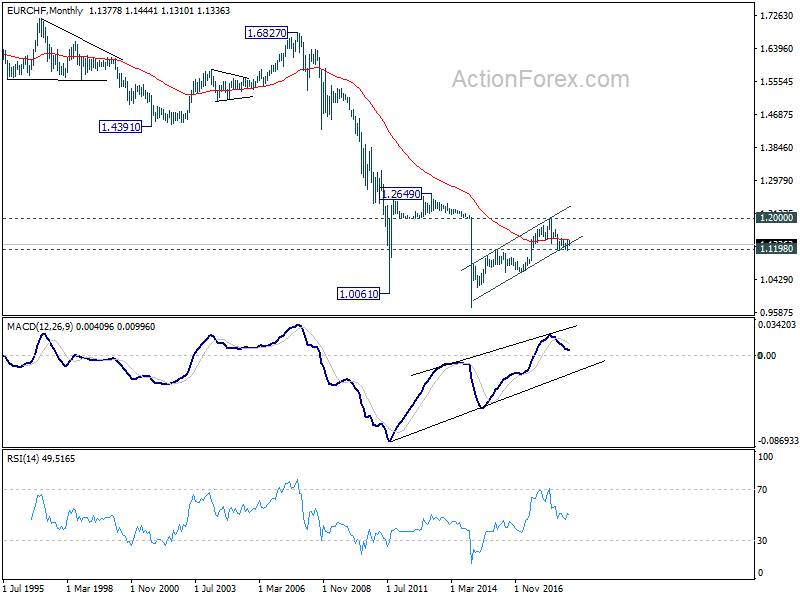
In the long term picture, as long as key support zone of 1.1198 (2016 high) and 61.8% retracement of 1.0629 to 1.2004 at 1.1154 holds, A break of 1.2 key resistance is still expected in the medium to long term. However, sustained break of the mentioned support zone will mark reversal of the long term trend. In that case, 1.0629 key support will be back into focus.
Trade Optimism Boosted Risk Appetite, Dollar and Yen Ended Lower
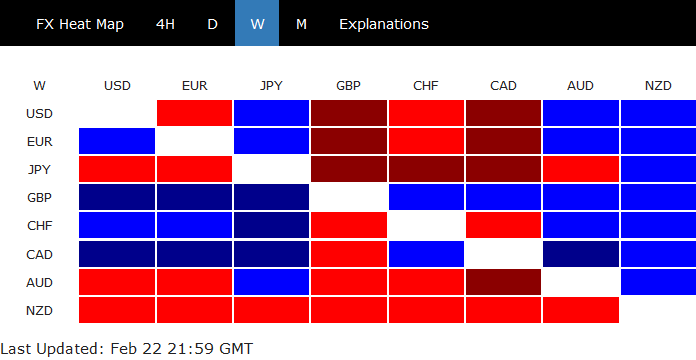
Yen and Dollar closed the week generally lower on strong risk appetite. There was some sort of optimism over US-China trade negotiations throughout the week. And that helped DOW and China SSE extend recent rally. DOW closed above 26000 for the first time since November. SSE also closed above 2800 for the first time since September too. The talks extend into the weekend and we might see some more market volatility after the meetings conclude.
Australian Dollar and New Zealand Dollar were the weakest ones, even with such positive risk sentiments. That highlights the problems the Aussie and Kiwi are facing. China denied reported that the Dalian port banned Australian coal import and helped Aussie pared some losses towards the end of the week. But in the background, Westpac now forecasts RBA to cut interest rates two this year in August and November. RBNZ proposed raising capital requirements for top banks. It's an act that might eventually tighten up financial conditions and force RBNZ to cut interest rates again. On the other hand, Sterling was the strongest one as traders saw risk of no-deal Brexit fading. Canadian Dollar followed oil prices higher.
Trump hopes to seal trade agreements in "not-too-distant future"
US-China trade talks appeared to have made some important progress and are extended by two days through Sunday in Washington. In the Oval office while meeting Chinese Vice Premier Liu He, Trump said "we both feel there's a very good chance a deal will happen." He added that "both parties want to make this a real deal" and "we want to make this a deal that's going to last for many, many years and a deal that's going to be good for both countries."
The final deal would be signed off at a summit with Chinese President Xi Jinping and Trump said he hoped to meet with in the "not-too-distant future." The current March 1 trade truce deadline could be extended by another month. Meanwhile, the final agreement might extend beyond trade to encompass Chinese telecommunications companies Huawei Technologies and ZTE Corp. Treasury Secretary Steven Mnuchin said the summit is tentatively scheduled for late March at the Mar-a-Lago resort in Florida.
Chinese Vice Premiere also said at the White House that there had been "great progress". And, "from China, we believe that (it) is very likely that it will happen and we hope that ultimately we'll have a deal. And the Chinese side is ready to make our utmost effort". Later in a statement published by Xinhua, Liu said "the two countries have conducted fruitful negotiations and made positive progress in areas including the trade balance, agriculture, technology transfer, intellectual property protection, and financial services."
Both teams are now working on Trade Agreements directly, rather than Memorandum of Understandings, as Trump dislikes MoUs. The original idea was to have six MoUs covering cyber theft, intellectual property rights, services, agriculture and non-tariff barriers to trade, including subsidies. It's uncertain what the new structures of the agreement would be. Mnuchin also said both sides have made an agreement on currency, without details.
DOW entered into sell zone
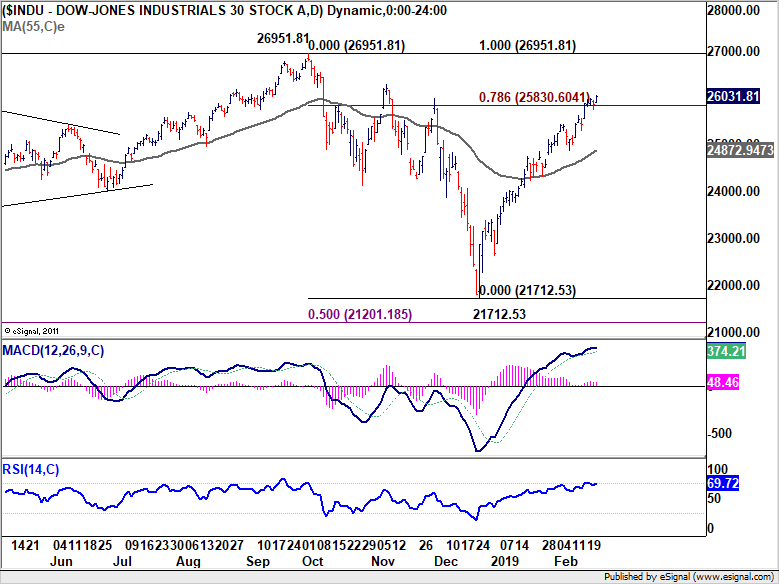
DOW's strong rebound from 21712.53 extended last week to closed at 26031.81, above 26k handle for the first time since last November. DOW is now in sell zone above 78.6% retracement of 26951.81 to 21712.53 at 25830.6041. While further rise could still be seen, DOW should start to lose upside momentum on overbought condition as seen in daily RSI. We don't expect a break of 26951.81 to resume larger up trend. Meanwhile, break of last week's low at 25762.21 should at least trigger pull back to 55 day EMA (now at 24872.94).
China SSE extended corrective rebound
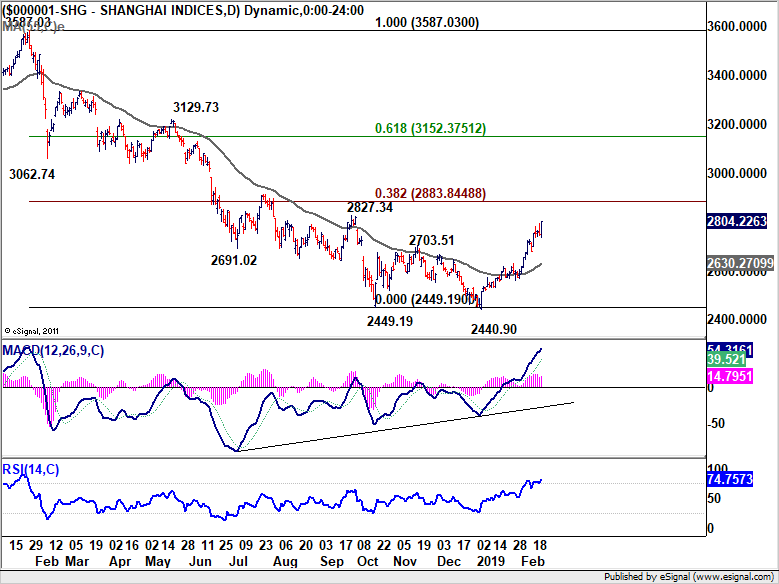
China Shanghai SSE also extended the rise from 2440.90 to close strongly at 2804.22. Currently, we're viewing price actions from 2449.91 as a corrective pattern, with rise from 2440.90 as the third leg. Thus, we'd expect strong resistance between 55 week EMA (now at 2819.27). and 38.2% retracement of 3587.03 to 1449.19 at 2883.84 to limit upside. T Break of last week's low at 2699.81 should at least bring pull back to 55 day EMA (now at 2630.27).
Sterling strongest as on bet on no hard Brexit
Sterling was the strongest one last week as traders add their bets that no-deal Brexit could eventually avoided. It's still uncertain whether UK Attorney General Geoffrey Cox could work out something with the EU to legally assure that Irish backstop would be temporary if triggered. If he can deliver something in the early part of this week, a revised Brexit deal would be put for another vote in the Commons on February 27. With Cox's endorsement, it's possible for Prime Minister Theresa May to get enough support. UK would then enter the final stage to prepare for an orderly Brexit.
If May couldn't get anything new for another meaningful vote in the Commons, the parliament would then vote for amendments to take over control of Brexit. In that case, it's very likely the the parliament would then seek Article 50 extension, or even change strategy with a Brexit delay. It would be finally be a time for UK lawmakers that they can vote in majority for something, instead of just against something.
Canadian Dollar followed oil price higher
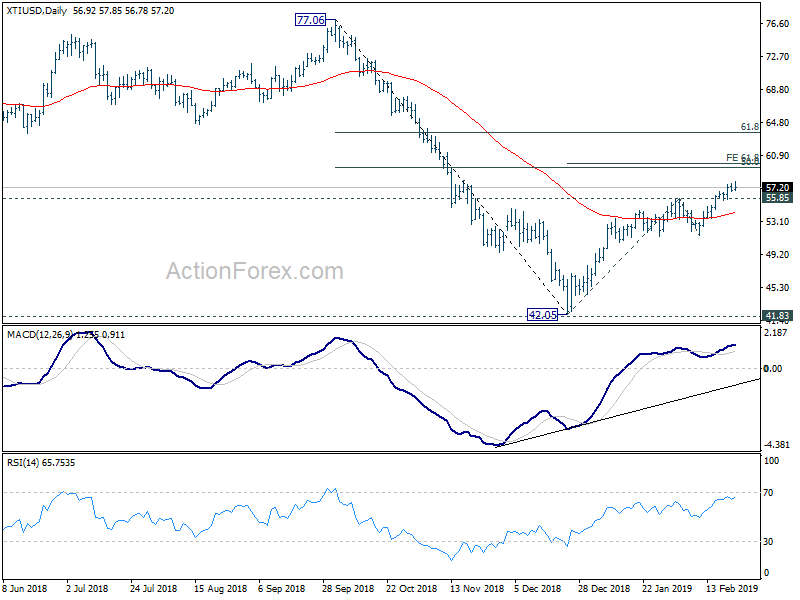
Canadian Dollar was the second strongest one as oil prices extends recent strong rally. The strength was attributed to OPEC+ production cut as well as trade optimism. But it's partly offset by surging US production. WTI crude oil extended the medium term rise from 42.05 to close at 27.20, above 57 level for the first time since November.
Further rise is still expected for the near term. But still, from 42.05 is seen as a corrective move. Hence, strong resistance will likely be seen around 61.8% projection of 42.05 to 55.85 from 51.49 at 60.01 to limit upside. That is is actually close to 50% retracement of 77.06 to 42.05 at 59.55. 55 week EMA (now at 59.60) is also in proximity.
Position trading
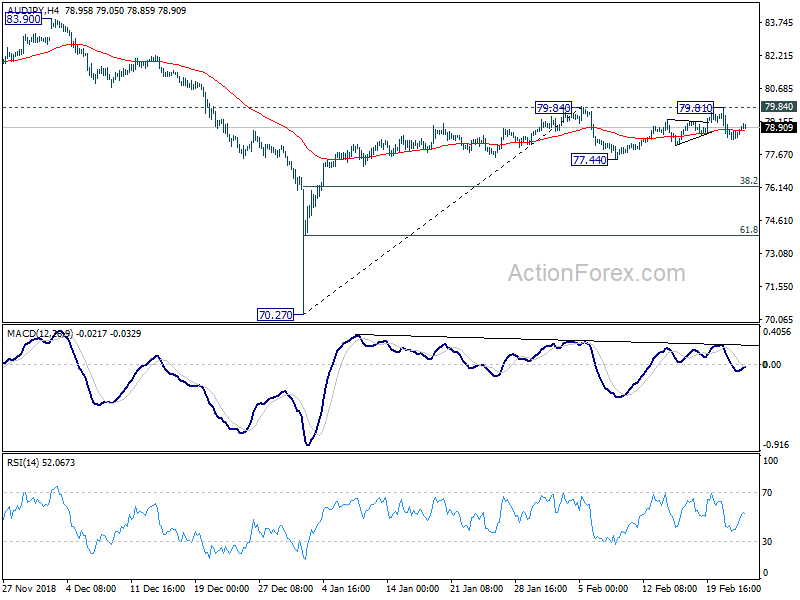
We're holding on to AUD/JPY short, entered at 78.40 stop at 79.84, and target at 61.8% retracement of 70.27 to 79.84 at 73.92. The rebound from 77.44 extended to as high as 79.81. It's way stronger than expected. But we narrowly escaped being stopped out.
Fundamentally, we'd like to reiterate that Aussie's failure to ride on stock rally last week said something about it's underlying weakness. Upcoming data might start to affirm the case of RBA rate cut. And stocks could start to reverse once the trade optimism becomes reality.
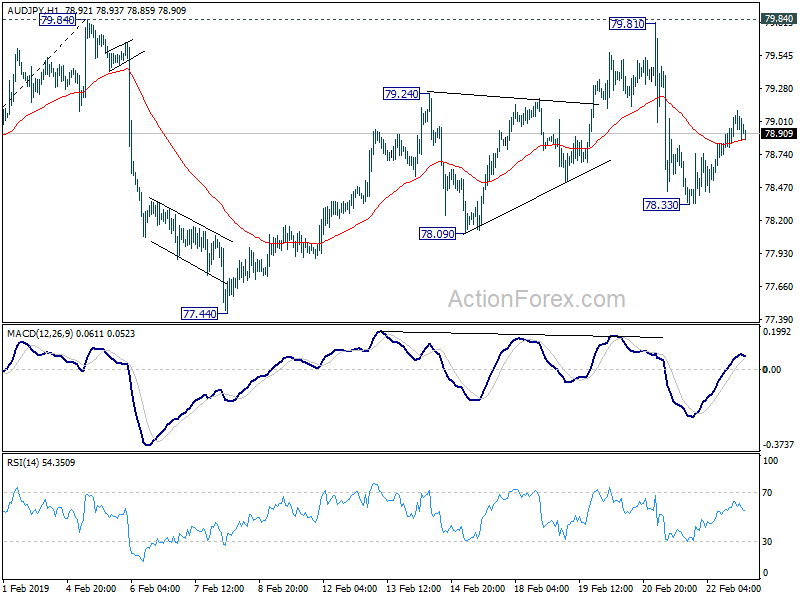
Technically, the rebound from 77.44 to 79.81 is seen as a three-wave correction. Fall from 79.81 is a impulsive move and recovery from 78.33 looks corrective. The cross also struggled to sustain above 55 day EMA. We'd expect current recovery to be limited well below 79.81 to bring another decline, at least for a test on 77.44 support. Break there will confirm that rebound from 70.27 has completed.
So, we'd hold on to the short position with stop and target unchanged. We tentatively look at lowing the stop of break of 78.33 support.
USD/CAD Weekly Outlook
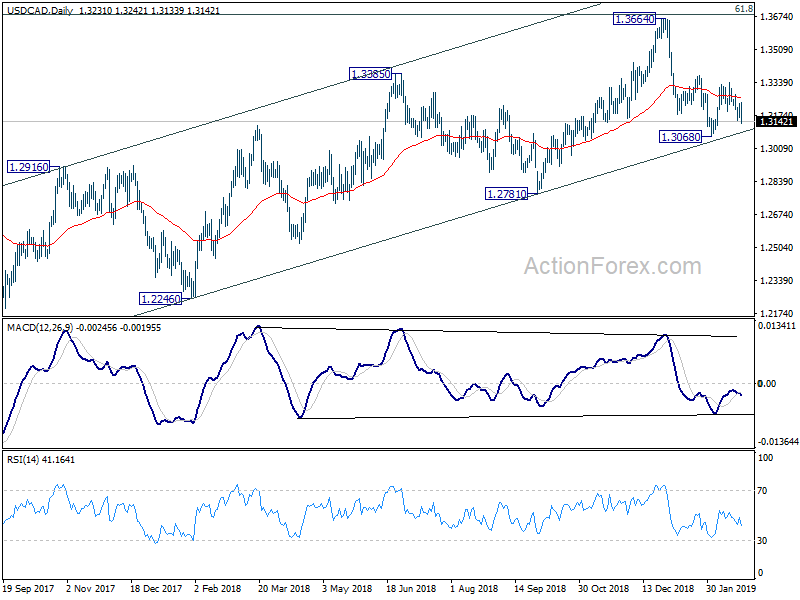
Despite some brief recovery, USD/CAD's decline from 1.3340 extended to as low as 1.3133 last week. Initial bias is back on the downside for 1.3068 key support. Decisive break there will firstly resume whole fall from 1.3664. Secondly, it will be a strong sign of medium term bearish reversal. On the upside, above 1.3242 minor resistance will turn bias back to the upside for 1.3340 resistance instead.
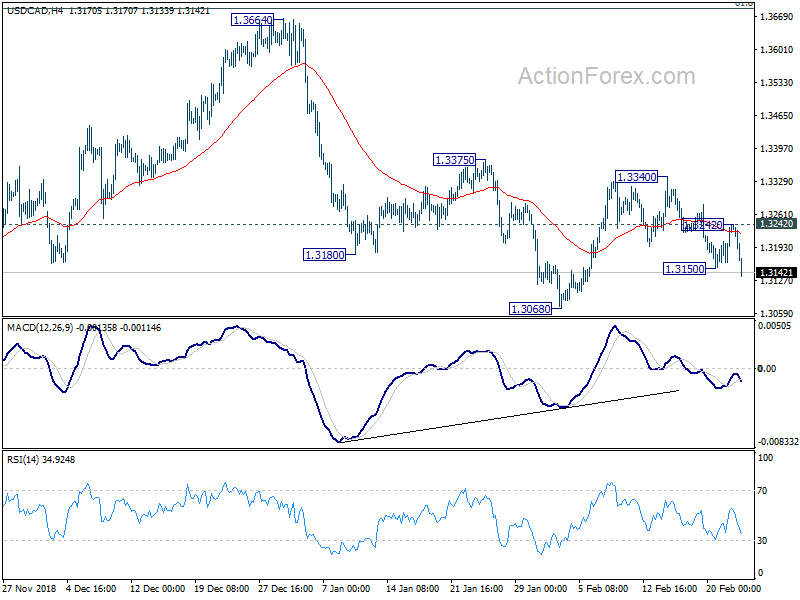
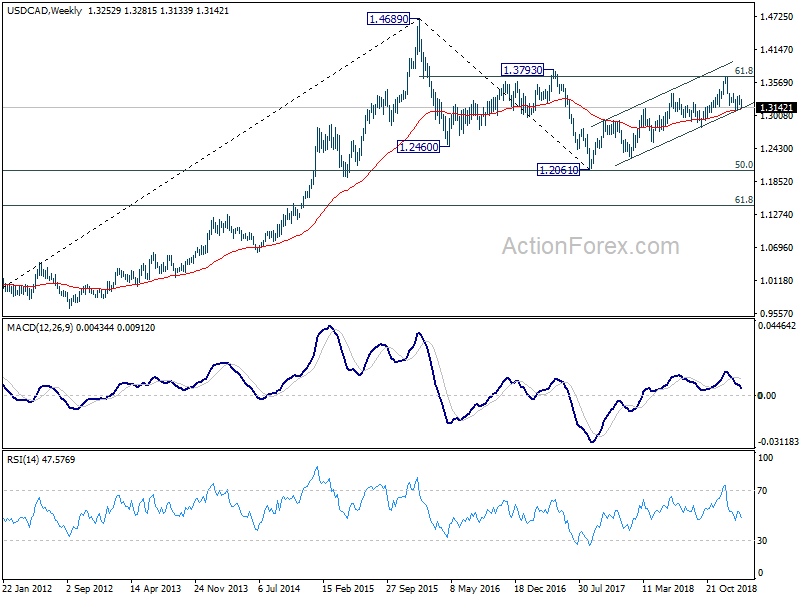
In the bigger picture, structure of the medium term rise from 1.2061 (2017 low) to 1.3664 is not clearly impulsive. Hence, we'd stay cautious on strong resistance from 61.8% retracement of 1.4689 (2016 high) to 1.2061 at 1.3685 and 1.3793 resistance to limit upside, and bring medium term topping. But in any case, medium term outlook will stay bullish as long as channel support (now at 1.3099) holds. Sustained break of 1.3793 will pave the way to retest 1.4689 (2015 high). Firm break of the channel support should confirm reversal target 1.2061 low again.
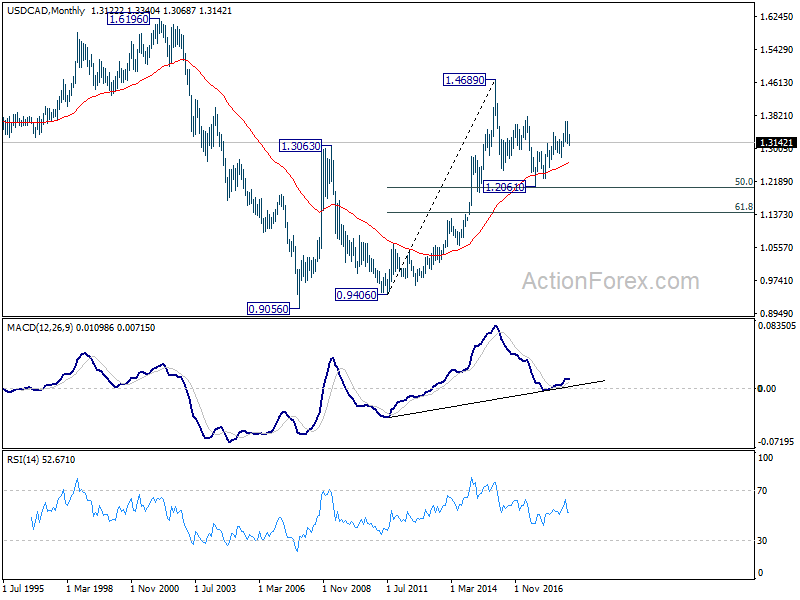
In the longer term picture, corrective fall from 1.4689 (2015 high) should have completed with three waves down to 1.2061, just ahead of 50% retracement of 0.9406 (2011 low) to 1.4689 (2015 high) at 1.2048. The development keeps long term up trend from 0.9406 and that from 0.9056 (2007 low) intact. For now, there is still prospect of extending the long term up trend through 1.4689.
US-China trade talks extend through Sunday, no more MoUs
US-China trade talks appeared to have made some important progress and are extended by two days through Sunday in Washington. In the Oval office while meeting Chinese Vice Premier Liu He, Trump said "we both feel there's a very good chance a deal will happen." He added that "both parties want to make this a real deal" and "we want to make this a deal that's going to last for many, many years and a deal that's going to be good for both countries."
The final deal would be signed off at a summit with Chinese President Xi Jinping and Trump said he hoped to meet with in the "not-too-distant future." The current March 1 trade truce deadline could be extended by another month. Meanwhile, the final agreement might extend beyond trade to encompass Chinese telecommunications companies Huawei Technologies and ZTE Corp. Treasury Secretary Steven Mnuchin said the summit is tentatively scheduled for late March at the Mar-a-Lago resort in Florida.
Chinese Vice Premiere also said at the White House that there had been "great progress". And, "from China, we believe that (it) is very likely that it will happen and we hope that ultimately we'll have a deal. And the Chinese side is ready to make our utmost effort". Later in a statement published by Xinhua, Liu said "the two countries have conducted fruitful negotiations and made positive progress in areas including the trade balance, agriculture, technology transfer, intellectual property protection, and financial services."
Both teams are now working on Trade Agreements directly, rather than Memorandum of Understandings, as Trump dislikes MoUs. The original idea was to have six MoUs covering cyber theft, intellectual property rights, services, agriculture and non-tariff barriers to trade, including subsidies. It's uncertain what the new structures of the agreement would be. Mnuchin also said both sides have made an agreement on currency, without details.
https://www.youtube.com/watch?v=rvEr7XlsaEY
Summary 2/25 – 3/1
Monday, Feb 25, 2019
[php_everywhere instance="1"]
Tuesday, Feb 26, 2019
[php_everywhere instance="2"]
Wednesday, Feb 27, 2019
[php_everywhere instance="3"]
Thursday, Feb 28, 2019
[php_everywhere instance="4"]
Friday, Mar 1, 2019
[php_everywhere instance="5"]
Weekly Economic and Financial Commentary: Signs Point to More Moderate Economic Growth Ahead
U.S. Review
Signs Point to More Moderate Economic Growth Ahead
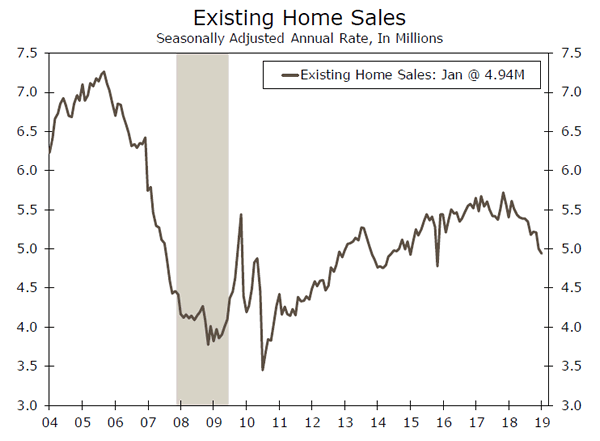
- Existing home sales dropped 1.2% in January, reflecting continued housing market weakness.
- The NAHB Housing Market Index rose to 62 in February, as more builders expressed confidence on lower mortgage rates.
- Durable goods orders increased 1.2% in December. Core orders fell 0.7%, indicating that business investment will likely slow.
- FOMC minutes for the January 29-30 meeting were released and revealed a consensus among members that patience should be exercised with further rate hikes. Many members also appeared ready for the end of the balance sheet run-off.
Signs Point to More Moderate Economic Growth Ahead
Data for 2019 are still somewhat limited, but several signs point to a moderate slowdown in overall economic growth relative to the strong pace registered throughout 2018. The weakness in the housing market felt through much of last year has extended into 2019. Existing home sales dropped 1.2% in January, as the lingering effects of rapid home price appreciation and higher mortgage rates in the second half of 2018 dampened sales for the third consecutive month. While overall sales have slumped, lower mortgage rates more recently make us optimistic that gradual improvements in home sales should be forthcoming.
A similar sentiment was expressed by homebuilders in the NAHB Housing Market Index, which posted its second consecutive monthly gain in February after dramatically falling in the final month of 2018. More builders feel confident about future market conditions given the lower rates, which bodes well for new residential construction headed into the spring. Mortgage applications also improved to start the year. The MBA Mortgage Applications Purchase Index rose 1.7% for the week ending February 15. While extremely volatile on a weekly basis, the average index reading seven weeks into 2019 is 3.1% higher than the same period last year.
Meanwhile, durable goods orders rose in December. Overall orders increased 1.2% during the month, while shipments for core capital goods edged 0.5% higher. However, much of December's gain was due to a 28.4% surge in nondefense aircraft orders. Core capital goods orders, which is an important barometer of future business investment, slipped for the second straight month and fell 0.7%. We still expect business investment to rise and be supportive of overall GDP growth in Q4; however, the drop in core orders makes the prospect of continued growth at its current pace unlikely.
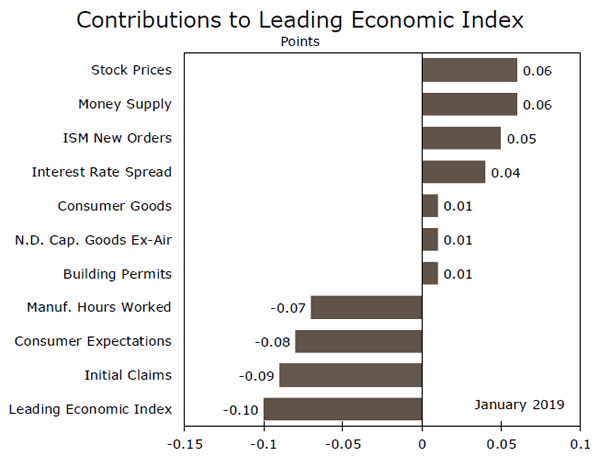
The leading economic index (LEI) continues to point to generally favorable economic conditions in coming months. The 0.1% decline registered in January was weighed down by a drop in average consumer expectations, likely a fallout from the partial federal government shutdown and stock market volatility towards the end of 2018. The government closure also led to an uptick in jobless claims, which were also a drag on the topline index. More recent data, however, revealed that the spike in claims was temporary. Initial jobless claims fell 23,000 to 216,000 for the week ending February 16, underscoring just how resilient the labor market is at present.
The topic of a strong labor market was also breached in the minutes for the most recent January 29-30 FOMC meeting released this week. While no change was made to the target federal funds rate during the meeting, the minutes revealed that participants generally agreed that patience should be exercised in the face of tighter financial conditions and moderating global economic growth. We still believe that the FOMC is not entirely finished with rate hikes, and modest price pressures and sturdy employment growth should lead to another hike toward the end of the year. Furthermore, the minutes appear to confirm our view that the balance sheet runoff will likely come to an end by the end of 2019 or early 2020.
U.S. Outlook
Consumer Confidence Index • Tuesday
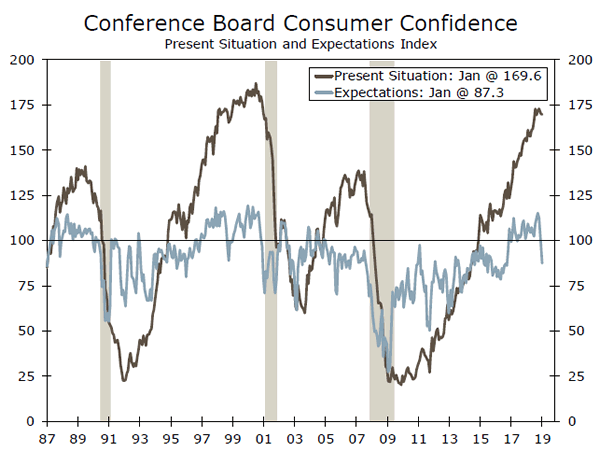
A partial government shutdown rung in the new year, trade "discussions" between the United States and China to prevent a fullblown trade war remain ongoing and financial markets have recovered but remain suppressed from all-time highs seen only a few short months ago. Such market noise has inevitably found its way into the confidence of consumers. The Consumer Confidence Index has declined the past three months, with most of the weakness concentrated in the expectations component.
We expect a modest rebound in confidence this month. If confidence falls short of our expectation, it will be the latest affirmation that a slowdown in consumer spending is in store this year. A miss to the upside, however, would suggest that the still-strong job market and the modest gain in wages that has finally begun to transpire have provided some much needed support to the outlook of consumers.
Previous: 120.2 Wells Fargo: 124.0 Consensus: 124.2
Q4 GDP • Thursday
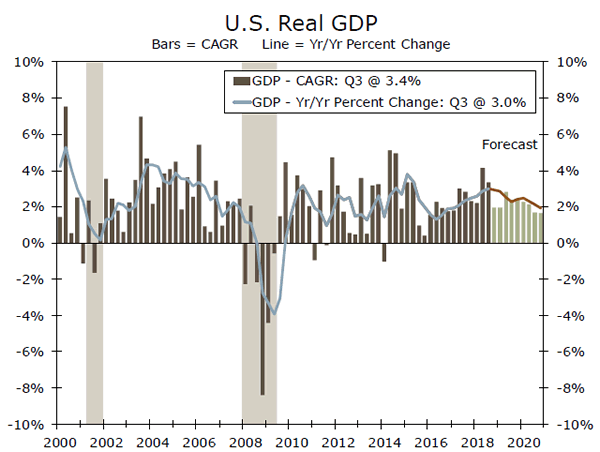
On Thursday, market participants' attention will turn to Q4 GDP. Given that it has been more than a month since the originally scheduled release date, the Census Bureau has decided this will be a combined release of the first and second estimates of Q4 growth.
Recent data have pointed to a slower-than-anticipated pace of growth in the final months of the year. As such, we have reduced our Q4 GDP growth forecast to 2.0% from 2.3% previously. Consumption growth is likely to be weak, as retail sales plummeted 1.2% in December (the largest one-month decline since 2009). However, as we noted, it was hard to square the plunge in sales with other variables, which suggests revisions may eventually be in order. Business fixed investment, on the other hand, may surprise to the upside. The advance estimate of durable goods data for December revealed a rise in capital goods shipments, which bodes well for Q4 investment spending.
Previous: 3.4% Wells Fargo: 2.0% Consensus: 2.5% (Quarter-over-Quarter, Annualized)
ISM Manufacturing Index • Friday
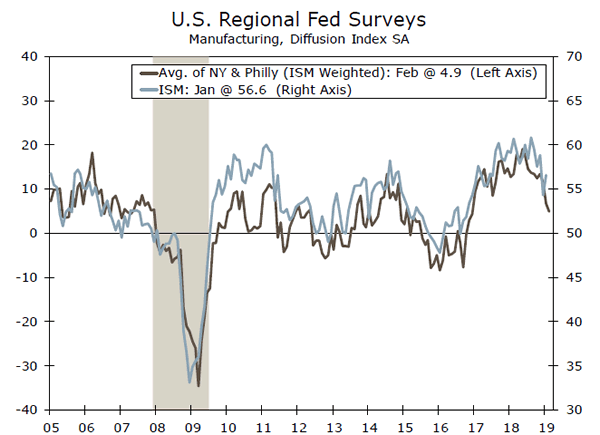
With durable goods data having been delayed in recent months, the ISM manufacturing index has received particular emphasis as an indication of how the factory sector is faring.
The ISM manufacturing index rose 2.3 points in January. However, that rebound occurred after the index posted its single-largest monthly drop since December 2008. Underlying details of January's report and slower domestic and global growth continue to point to factory activity slowing on trend this year.
Consistent with what we have seen from the regional PMIs to date, we expect the ISM index to give up a bit of ground in February. If the index falls more than we anticipate, it would support the cautious policy stance by the FOMC. A miss to the upside, however, would provide some comfort that activity in the factory sector has held up, at least, through February.
Previous: 56.6 Wells Fargo: 55.0 Consensus: 56.0
Global Review
Still Quiet on the Global Central Bank Front
- The global economic data released this week have been decidedly mixed. In the Eurozone service sector confidence improved, but manufacturing confidence fell into contraction territory. Australian employment figures were sturdy, but other data were mostly soft in tone. Finally, in Japan, the economic figures over the past five days have been generally subdued.
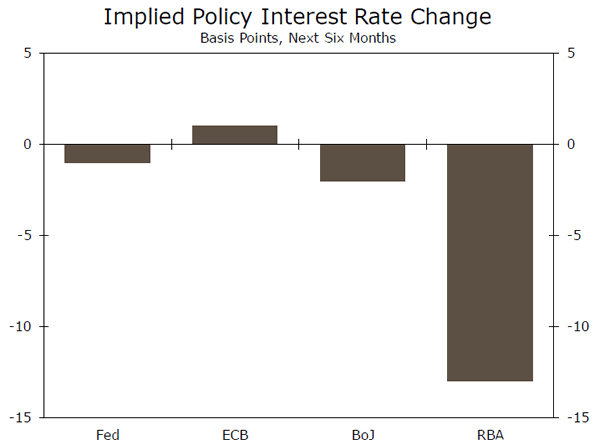
- Given this mixed backdrop, things should remain quiet on the global central bank front for now. Central bank comments from Europe and Japan have been mostly dovish in recent weeks, while Australia has adopted a more balanced outlook. It could still be some time before these central banks adjust policy rates.
All We Need Is Just a Little Patience
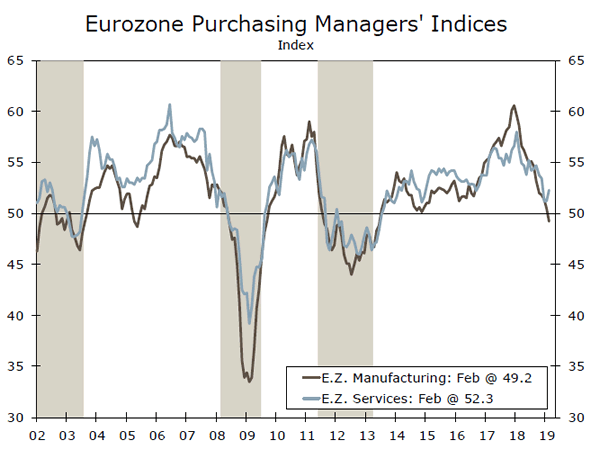
The Eurozone February manufacturing and service sector PMIs provided the latest reading on the state of the region's economy. Those figures hardly offered a silver lining, although perhaps made the economic clouds a little less dark. On the negative side, the manufacturing PMI fell to 49.2, the first time that index has been in contraction territory since mid-2013. That largely confirms softness seen in other indicators, including a large decline in December industrial production. On a more positive note the service PMI rose to 52.3, the first increase since September, meaning that the economy-wide composite PMI also rose in February. Germany's economy has been weak in recent quarters, and the fall in the February IFO business confidence to 98.5 hints at continued subdued growth. Overall, with growth sluggish and several European Central Bank policymakers adopting a more dovish tone in recent speeches, we do not anticipate the central bank will begin raising its deposit rate from the current -0.40% until the final quarter of this year.
Reserve Bank of Australia on Hold
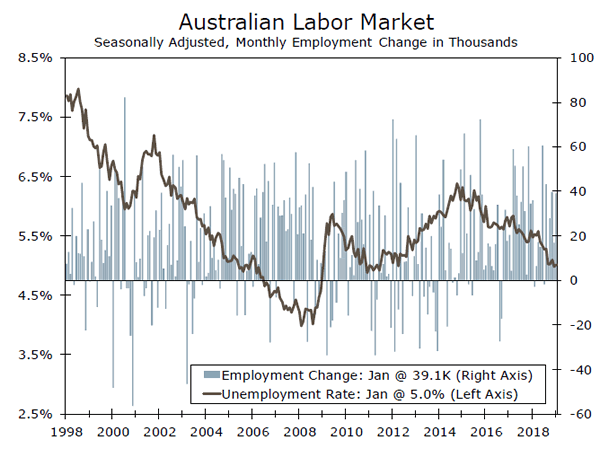
While there have pockets of strength in some Australian data, the Reserve Bank of Australia (RBA) is also likely to be on hold for an extended period. January labor market figures were sturdy, with employment rising 39,100, led by a 65,400 gain in full-time jobs, while the unemployment rate was steady at 5.0%. Still, the early February PMI readings showed softness, while wage growth remains moderate, as the Q4 Wage Price Index rose 2.3% year-over-year. Australian economic sentiment was also hurt to some extent by news reports that China had banned imports of Australian coal indefinitely at five key ports. Despite the encouraging employment news the RBA remains firmly on hold for now. Earlier this month the central bank moved to a neutral outlook, with Governor Lowe saying that the probability of the next interest rate move being up or down was more evenly balanced, a view he reiterated at Parliamentary testimony this week.
Bank of Japan Sounds Dovish
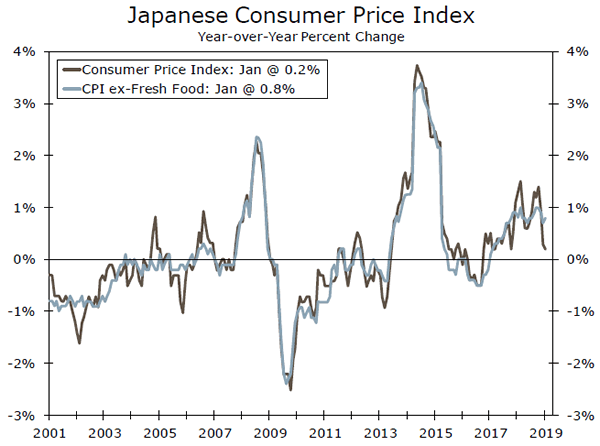
Bank of Japan Governor Kuroda also spoke to Parliament this week, telling Japanese lawmakers the central bank may consider additional monetary easing if moves in the yen were to affect the economy and inflation. Kuroda's comments were largely supported by this raft of economic data. The January CPI rose just 0.2% year-over-year while the core CPI rose 0.8%–both well short of the Bank of Japan's medium-term inflation goal of 2%. Meanwhile, activity data were broadly soft in tone, as the December all industry activity index fell 0.4% month-over-month and core private sector machinery orders dipped 0.1%. Japan's manufacturing PMI also fell in February. Given the central bank's recent comments and the subdued overall tone of the economic figures, there is a risk that the window closes on our base case of a modest adjustment towards less accommodative monetary policy by the Bank of Japan in Q2, a policy adjustment that would be far enough in advance of Japan's consumption tax increase scheduled to take place in Q4-2019.
Global Outlook
Canada GDP • Tuesday
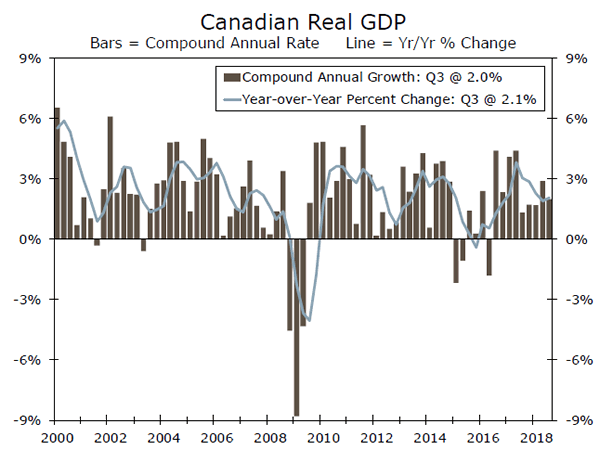
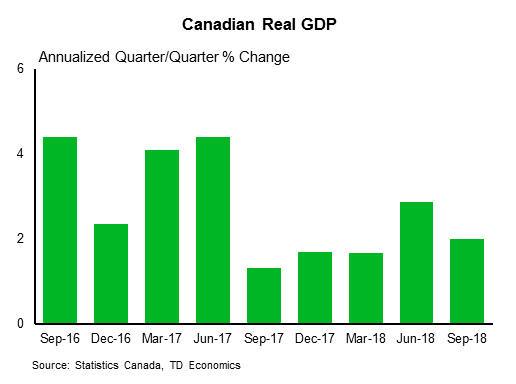
Canada's Q4 GDP is due next week, with the slower growth of Q3 expected to continue into Q4. Canada's economy rose at just a 2.0% annualized rate in Q3, and monthly data hint at subdued growth in the final quarter of 2018. Retail sales excluding motor vehicles recorded five straight monthly declines through December, while manufacturing shipments fell in each month during Q4. Meanwhile, oil production cuts in Alberta likely also weighed on growth during the quarter. We forecast that Canada's Q4 GDP slowed further to just 1.5% annualized, although given the recent rebound in oil prices and a lessening drag from the Alberta production cuts, we expect growth to improve on a sequential basis as 2019 progresses.
Next week also sees the release of January CPI inflation data. The consensus expects the headline CPI to rise just 1.5% year-over-year, which would be the smallest gain since October 2017, while core inflation measures should be broadly steady just below 2.0%.
Previous: 2.0% Wells Fargo: 1.5% Consensus: 1.5% (Quarter-over-Quarter, Annualized)
Brazil GDP • Thursday
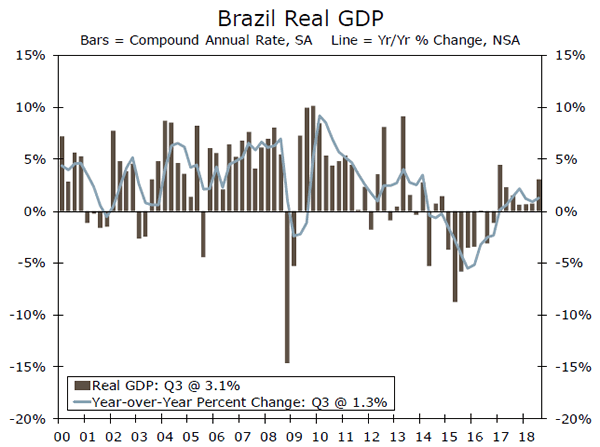
Brazil's Q4 GDP should show an economic expansion that remains somewhat uneven but on an overall upswing. After GDP rose 0.8% quarter-over-quarter in Q3, the consensus expects sequential growth slowed in Q4. Monthly retail sales data suggest consumer spending was relatively solid last quarter, although weakness in industrial production hints at possible weakness in investment spending. On a year-over-year basis, growth is expected to quicken further, though, to 2.0%. Overall, we expect Brazil's economic growth to remain moderate over the medium-term. That outlook depends critically on whether President Bolsanaro can successfully push through pension reforms, successful passage of which would likely limit the pace of growth but improve the sustainability of economic expansion.
India's Q4 GDP is due and is expected to slow to 6.7% year-over-year, while next week other key emerging market data include China's February manufacturing and services PMIs.
Previous: 1.3% Consensus: 1.5% (Year-over-Year)
Eurozone CPI • Friday
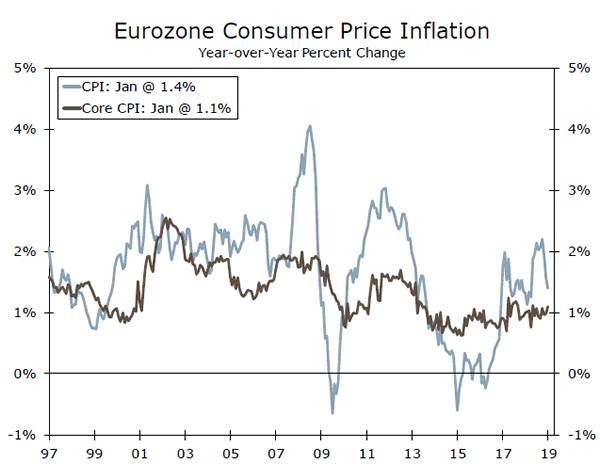
The latest reading on Eurozone inflation is released next Friday, although we do not expect those figures to shift the Eurozone's monetary policy outlook. We forecast the headline CPI rose 1.5% year-over-year in February, slightly more than the January increase. Moreover, there is arguably some upside rise to that outlook, given a rise in oil prices through much of February, and a relatively stable euro versus the U.S. dollar. That said, underlying inflation pressures are building only gradually, and we forecast the core CPI to rise 1.1% year-over-year in February, the same as the previous month and well short of the ECB's inflation goal.
With economic growth still relatively subdued and inflation pressures building only gradually, we still expect it will be some time before the ECB begins to raise interest rates. Eurozone February economic confidence is also released, with the consensus forecasting the index to ease to 106.0.
Previous: 1.4% Wells Fargo: 1.5% Consensus: 1.5% (Year-over-Year)
Point of View
Interest Rate Watch
The Markets Matter
Minutes from the FOMC's January meeting offered insight into the reasons for the committee's abrupt pivot from December to a decidedly more dovish policy stance. As Chair Powell laid out in the post-meeting press conference, the committee viewed the downside risks to growth had increased. Specifically, members were concerned about a slowdown in global growth, waning fiscal stimulus, trade policy tensions and tightening financial conditions.
Tighter financial conditions in the immediate wake of the December meeting came as markets viewed the FOMC as "insufficiently flexible" in its policy path, given the perceived risks to the outlook. Although not wanting to appear beholden to markets, it nonetheless looks like the FOMC's about-face was determined to demonstrate flexibility.
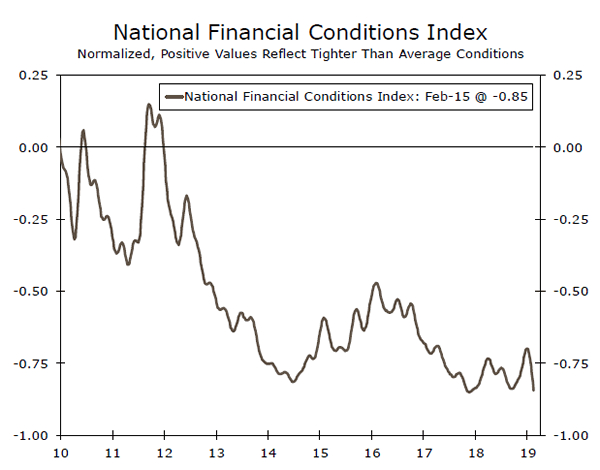
Of course, policy adjustments are not warranted only when conditions or risks are perceived to have worsened. Since the start of the year, financial conditions have loosened and are now the easiest levels in more than a year (top chart), while equity markets are up about 10% since the December meeting. The improvements come as markets no longer expect the Fed to hike rates further this cycle.
The minutes were not definitive in that view, however. The base case for growth appears little changed. Therefore, if the downside risks subside, "many" participants believe the "patient" stance would need to be revisited.
Evenly Split…For Now
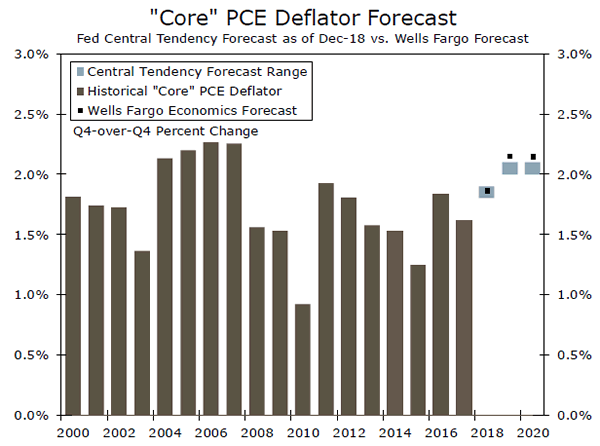
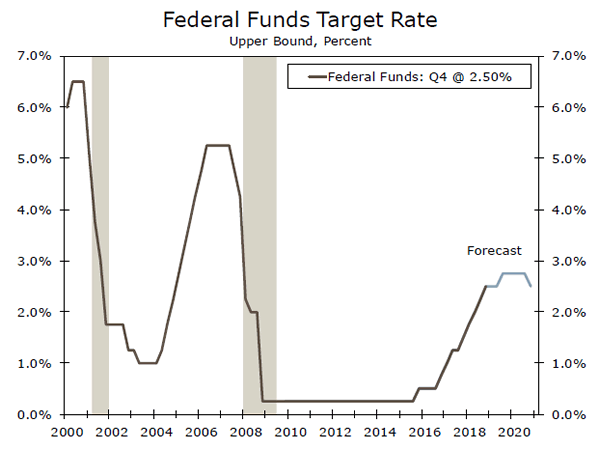
The majority of the FOMC was not clear which way the FOMC's next move would be. "Several" expected it would be appropriate for at least one more hike this year, while another "several" thought hikes would only be necessary if inflation came in higher than expected. We anticipate inflation will be roughly two-tenths stronger by Q4 what the most recently published FOMC estimates (middle chart), which, along with recent easing in financial conditions, results in one more hike this year (bottom chart). The FOMC may indeed be flexible, but just not in the way the market currently expects.
Credit Market Insights
Canary in the Camry?
Seven million Americans are seriously delinquent on their auto loans, according to the New York Fed. The current number of borrowers 90 days behind on their auto loan payments vastly exceeds the maximum reached in the height of the last recession. With wage growth picking up and job growth still incredibly strong, is this a harbinger of widespread financial distress or something more benign?
Due to the centrality of cars to the economic and personal stability of so many, consumers typically prioritize auto loan payments over other liabilities—even mortgage or credit card debt. Thus, a growing number of consumers transitioning into delinquency on their auto loans can be an indicator of significant financial distress. Yet, this alarming number of delinquent borrowers is to a large extent simply a consequence of an increase in the magnitude of the auto loan market. Lenders originated a record $584 billion of auto loans in 2018, increasingly to prime borrowers, who still comprise a much larger share of outstanding debt than subprime borrowers. The portion of vehicle purchases financed by debt has remained stable, and the flow into serious delinquency in Q4 only reached 2.4%. Still, this marks a noticeable deterioration in performance—this is up from the 2012 cycle low of 1.5%, and is concentrated among the young and the subprime. While the headline of seven million may not indicate a systematic threat, it can offer clues into where financial hardship is the most acute.
Topic of the Week
Refund Status: Still Processing
The tax cuts passed in the final days of 2017 resulted in increased after-tax income for most U.S. households. However, due to a number of factors (changes in withholdings, and the government shutdown) there remains considerable uncertainty about how much of that gain was realized in calendar year 2018 and how much will (or will not) be realized during the 2019 filing season.
What is known: so far, the pace of filings and returns is slower than in prior years. Fewer people are filing taxes early this year, and those who are have seen tax refunds that are down on average 8.7% through versus this period last year (February 8, 2019).
What is unknown: whether once the dust settles the actual aggregate amount and average refund will fall as precipitously as they have so far. An inauspicious start does not necessarily mean that tax refunds are sure to be lower for the year, but should this trend continue, it poses a potential threat to Q1 GDP growth.
The bottom line from our perspective is that the timing of tax returns might be running a few weeks behind. Early filers are doing so at a slower pace, and even despite the slower pace of filing, the IRS is having a more difficult time keeping up.
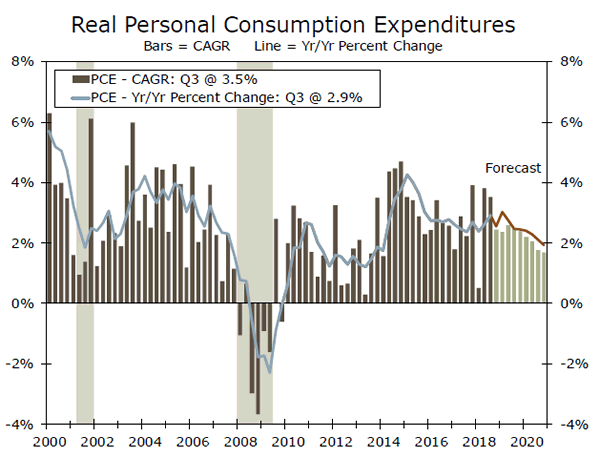
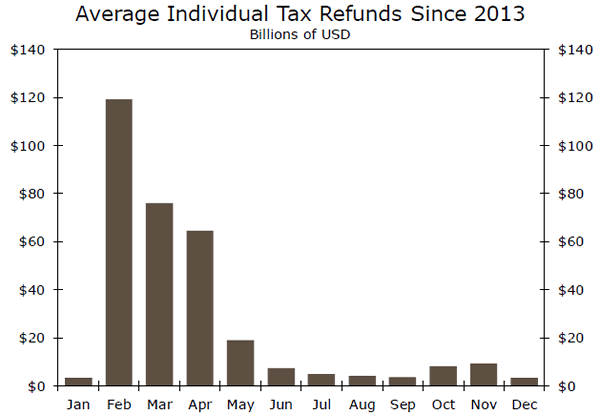
While the size of the refund being down so far does not necessarily mean smaller refunds are certain for 2019, it does pose a challenge for Q1 spending. February is the biggest month for tax returns (bottom chart), so the smaller refunds at the outset and the fact that the IRS is running a little behind processing means some durables spending could be put off into March or perhaps Q2.
We plan to further unpack the factors that complicate this issue in an upcoming special report, as a practical way to monitor this year's refunds.
The Weekly Bottom Line: A Reminder on the Limits of Monetary Policy
U.S. Highlights
- The barrage of negative U.S. data continued this week, with weakness in December durable goods orders and a decline in existing home sales in January.
- Still, markets were hopeful that progress would be made in the China-U.S. trade talks, which could help remove a cloud of uncertainty that has weighed on investment.
- The data affirms that the Fed made the right choice to shift off of gradual rate increases, and wait patiently to see if the U.S. economy remains resilient in the face of global weakness. We expect these signs to become clearer in the spring.
Canadian Highlights
- Oil prices and a broader U.S. dollar sell off helped lift the loonie a touch this week.
- Retail sales volumes rebounded in December, but the fourth quarter as a whole was flat, consistent with our view of subdued consumer spending at the end of the year.
- In a speech this week, Bank of Canada Governor Stephen Poloz discussed the limitations of monetary policy, and reaffirmed the data dependent path for getting interest rates back to neutral.
U.S. - Awaiting Signs of Spring
Spring training got underway this week, a reminder that better weather is just around the corner. But, it will likely be some time before we see signs of spring in the U.S. economy. Various indicators pointed to soft momentum at the end of 2018 and early in 2019. Last week it was retail sales and industrial production. This week, the bad news came from durable goods orders and existing home sales.
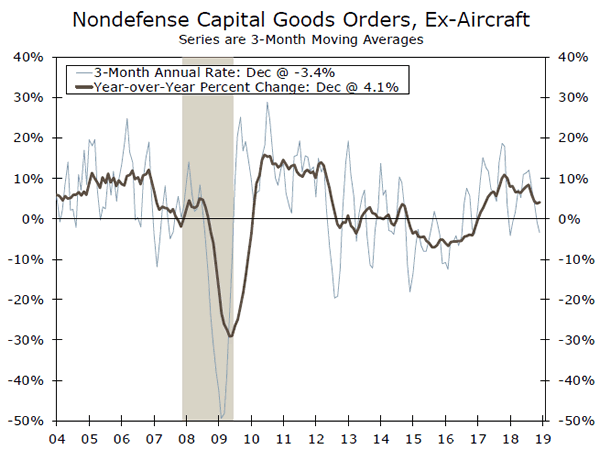
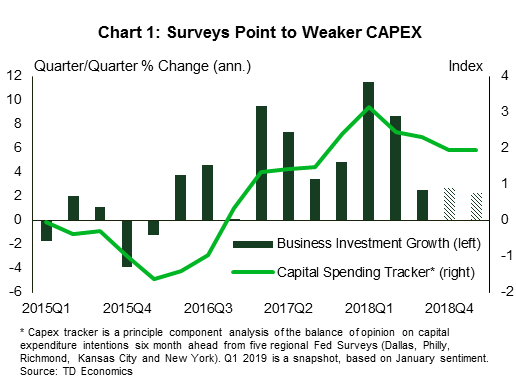
Overall durable goods orders rose 1.2% in December, but the underlying business-investment gauge – nondefense capital goods orders ex-aircraft – declined 0.7%, the fourth decline since August. Capex spending had already slowed in the third quarter of 2018 after a period of strength (Chart 1), and the durables data suggests a similarly modest pace in Q4. That lines up with our capital expenditure tracker, (based on Fed sentiment surveys) and points to more modest growth into early 2019 as well.
Uncertainty related to trade policy and slower growth abroad likely contributed to more modest business spending in the latter half of 2018. Markets were optimistic about ongoing China-U.S. talks this week, but there is no concrete news yet. The President also indicated that March 1st is not a magic date, providing hope that an escalation in tariffs isn't imminent. It could also mean that talks drag on, keeping the cloud of uncertainty hanging over investment.
The U.S. housing market also started 2019 on a weaker footing. Existing home sales fell 1.2% in January, hitting the lowest level since November 2015. It is likely sales were somewhat depressed by uncertainty due to the government shutdown, but the trend was already soft.
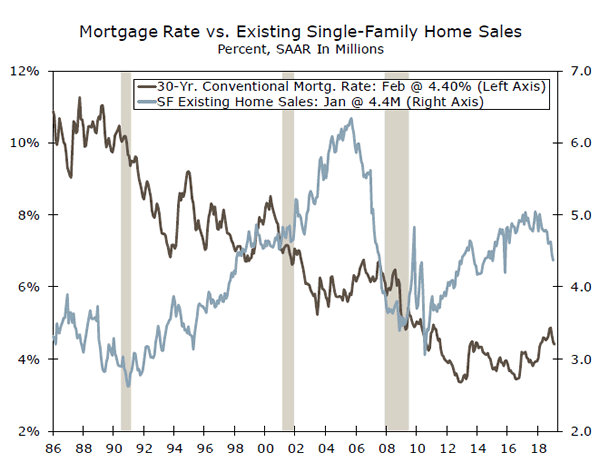
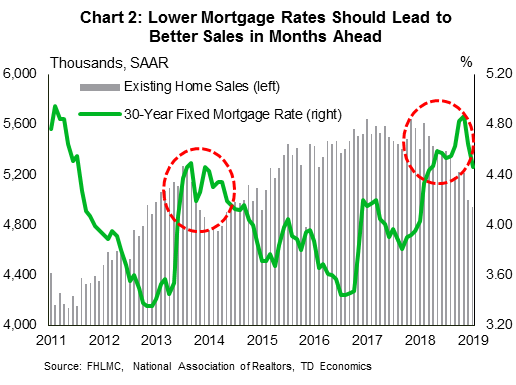
Deteriorating affordability has cut into housing demand over the past year, but mortgage rates have dropped about 60 basis points since late 2018, which should show up in improved sales in the months to come (Chart 2). Homebuilder confidence also improved in February, supporting a more positive housing narrative ahead.
Finally, on the data front, the delayed fourth quarter GDP report is released next week. We expect growth moderated to 2.2% in Q4, after running above 3 ½% through the middle of the year. With the government shutdown and the continued phenomenon of residual seasonality, the first quarter of 2019 is likely to be even weaker at 1.6%.
For now, this lackluster data affirms that the Fed made the right choice to shift off of gradual rate increases, and wait patiently to see if the U.S. economy remains resilient in the face of global weakness. The minutes from the January FOMC meeting showed members debating whether further rate hikes will be necessary, but not contemplating cuts. Members continued to view sustained expansion strong labor market conditions, and inflation near 2% as the most likely path ahead. We too expect economic momentum to improve in the spring, and remain modestly above trend through the remainder of 2019. As long as there are no curve balls, the Fed is likely to raise rates once more in the latter half of the year.
Canada - A Reminder on the Limits of Monetary Policy
Oil prices firmed this week and, when taken together with a broader U.S. dollar sell off, helped lift the loonie a touch. Overall, the few tidbits of economic data received this week did not change our view on the outlook for the Canadian economy.
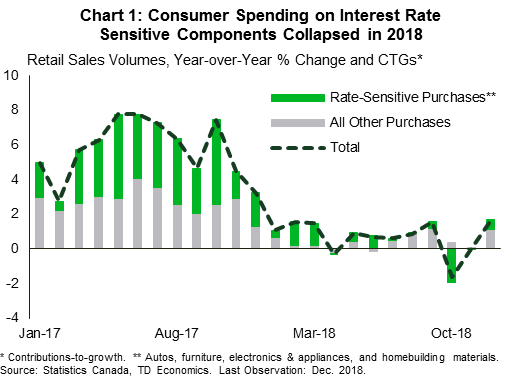
As expected, consumers have been feeling the pinch of higher interest rates. Retail sales volumes were flat for much of 2018, with the most interest rate-sensitive components of household spending taking a hit (Chart 1). Retail sales volumes rebounded in December, but growth in the fourth quarter of 2018 was non-existent, consistent with our view of subdued consumer spending at the end of the year.
Government budget season began this week, with British Columbia kicking things off (see commentary). In its second full budget, the NDP government took care not to upend existing plans. Notable spending initiatives include a new childcare benefit program, $900 million allocated to the CleanBC plan, and a plan to eliminate interest on student loans. An incremental $24 million was allocated to the Homes for BC plan, aimed at eliminating homelessness.
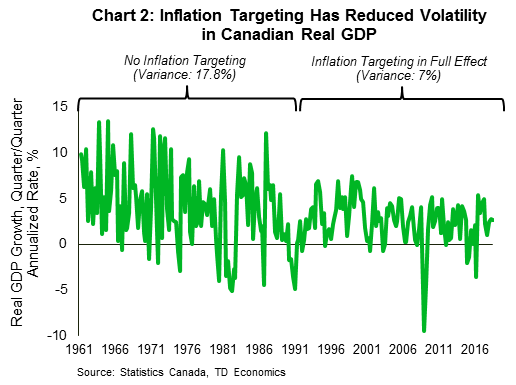
Capping off the week was a speech by Bank of Canada Governor Stephen Poloz. In addition to reaffirming that his goal remains further rate increases, but that the timing is data dependent, the speech stayed true to its title: "Toward 2021: the Power and Limitations of Policy". Governor Poloz remarked about the success and limitations of the central bank's inflation targeting regime. While low and stable inflation has provided numerous benefits to Canada's economy, such as lower nominal interest rates and more stable income growth, there are limits to this framework. Inflation targeting is essentially a one-trick pony, achieving price stability at the expense of other possible mandates such as full employment or a stable exchange rate. Moreover, the limitation of one instrument does little to combat excesses, such as the bingeing of households and firms on debt due to low interest rates. Lastly, the forward looking nature of monetary policy requires setting interest rates in order to achieve objectives a year or more away, making it an exercise in risk management.
Overall, this speech helped provide an update on the Bank's thinking as it heads toward the renewal of the inflation-control target set for 2021. Those expecting an expansion in its mandate are likely to be disappointed. The message this week seems to be that the Bank wants to stick to its current focused mandate, highlighting the macroeconomic stability that inflation targeting delivers (Chart 2). Governor Poloz also appears content to leave financial and housing market regulation to other government agencies, given the limited power of monetary policy to address financial imbalances.
US: Upcoming Key Economic Releases
U.S. Real GDP - Q4 Initial
Release Date: February 28, 2019
Previous: 3.4%
TD Forecast: 2.2%
Consensus: 2.5%
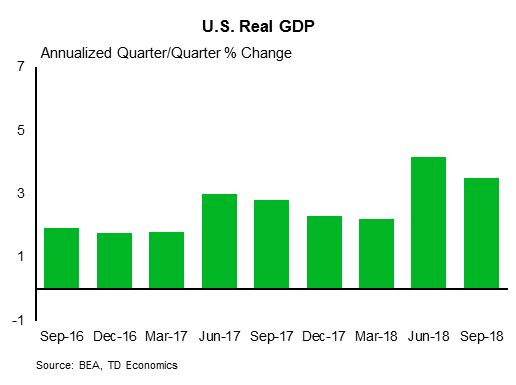
Following weak December retail sales and core capital goods data, we look for Q4 GDP growth to slow to 2.2%, down from Q3's solid burst of 3.4%. While consumption expenditures should be respectable (upper 2% range), housing and business inventories are likely to subtract from growth. The more measured expansion rate reflects the economy's normalization as fiscal stimulus wanes and past interest rate hikes bite. As a final note, due to the shutdown, this report will be a combination of the advance and second releases; there will only be one subsequent revision.
Canada: Upcoming Key Economic Releases
Canadian Consumer Price Index - January
Release Date: February 27, 2019
Previous: -0.1% m/m, 2.0% y/y
TD Forecast: 0.2% m/m, 1.5% y/y
Consensus: 0.2% m/m, 1.5% y/y
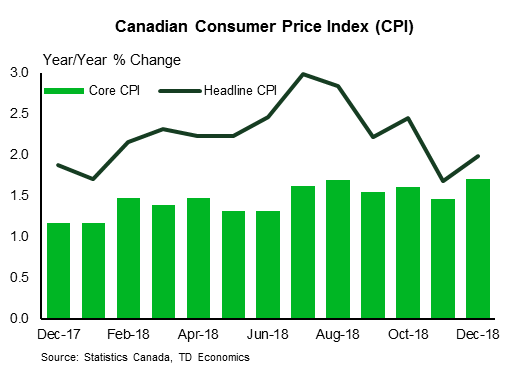
We expect inflation to slip back to 1.5% in January, largely driven by the partial reversal in airfares. This is a key source of uncertainty, which on balance skew risks to the downside. Since the methodological changes in March 2018, airfares have recorded significant m/m swings and bounced 22% m/m in December. While it is tempting to assume a large correction, we note that seasonal patterns in January point to a further increase while past performance indicates that large swings don't always fully reverse in the next month. On the other hand, January airline deals point to a partial correction, especially with the new, more expansive methodology which may make the index more sensitive to discounts. Taken together we expect airfares to decline m/m, bucking the seasonal trend. We also eye marginal upside risks in energy, owing to carbon pricing rules and higher Ontario hydro costs. Note however the bulk of the carbon tax impact will be in April, when a fuel charge is implemented on four provinces, comprising roughly half of CPI. Finally, we flag that the January release will incorporate methodological changes to the rent index.
Canadian Real GDP - Q4 & December
Release Date: March 1, 2019
Previous: 2.0% q/q, -0.1% m/m
TD Forecast: 0.9% q/q, 0.0% m/m
Consensus: N/A
We expect a soft close to 2018, with slowing economic momentum and the impact of energy sector developments the main culprits holding economic growth to just 0.9% (q/q, annualized). Consumer spending is expected to remain soft at just 1.3% with spending on durable goods forecast to contract for a second quarter. Similarly, residential investment is expected to subtract from growth again on the back of falling resale activity, muted construction, and a soft reading for renovation. This leaves non-residential investment to do the heavy lifting where an expected pop-back in equipment spending following the prior quarter's unusual drop should lead the way (early indicators suggest little contribution from non-residential structures). The wildcard is net trade. Due to the U.S. government shutdown, we don't yet know how December shaped up, but based on the data in hand we anticipate a modest positive contribution, largely due to flat import growth. Weak commodity prices are expected to have kept nominal GDP effectively unchanged in the fourth quarter.
Industry-level GDP is also forecast to remain unchanged in December as a contraction in the goods-producing sector offsets a modest increase in services. Manufacturing output will weigh on the goods sector due to weaker petroleum output while residential construction and utilities should also act as a headwind to growth. This will leave services as the primary driver, underpinned by stronger retail and wholesale trade. A flat print for industry-level GDP in December provides a muted handoff to Q1, where crude oil curtailments will weigh heavily on January.
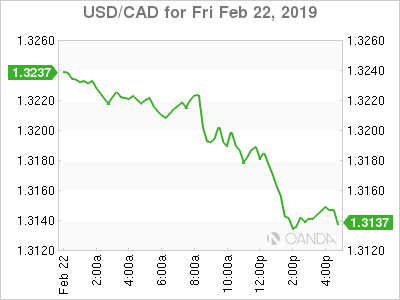
Canadian Dollar Higher on Stronger Oil and Softer Dollar
Canadian Dollar rose 0.47 percent on Friday despite retail sales falling unexpectedly in December. Trade optimism offset the data miss as the US dollar remains on the back foot following lower than expected manufacturing data points published on Thursday.
The softness of the US dollar boosted oil prices which in turn supported the loonie. The Bank of Canada (BoC) remains hawkish in the near term, setting it apart from the Fed which had to make a sudden stop to reassess its monetary policy going forward.
Next week will be busy for CAD traders as inflation data will be published on Wednesday, the current account on Thursday and monthly GDP data on Friday. Analyst forecast are for a mixed bag as the momentum is lacking on Canadian growth, but with steady inflationary pressures the central bank could step in before the first half of the year.
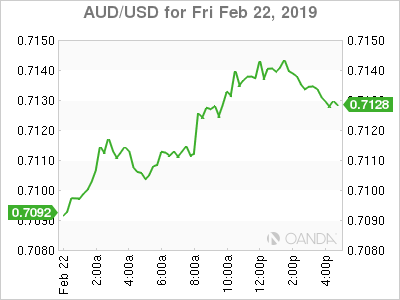
The US dollar is lower across the board against major pairs on Friday. The greenback was higher on Thursday despite disappointing data and positive news regarding trade talks between the US and China, but as more information is being reported the market has moved back to a risk on mode putting downward pressure on the dollar. Stocks and commodities have moved up on dollar softness and the optimism that even if the March 1 deadline approaches it will not immediately trigger new tariffs.
Financial headlines will be full of trade talk and Brexit speculation as negotiations continue on both fronts. Fundamentals will be released at the same time with Inflation hearings in the United Kingdom and Fed Chair Jerome Powell two testimonies in Washington. The US central bank paused its tightening monetary policy and investors will be following what Powell says to lawmakers this week.
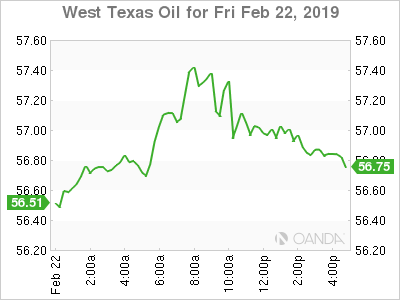
OIL – Crude Rises as Energy Demand Boosted by Trade Optimism
Oil prices rose on Friday as the US and China appear to be close to an agreement ending a tariff spat that had a negative impact on global energy demand. Although there might not be a huge announcement even as the March 1 deadline is a week away, the US has signalled that the date is not a hard deadline leaving more room for negotiations.
The market remains caught in a tug of war between the OPEC+ supply cuts and the rising output from the US. Disappointing US economic data has offset the balance with a softer dollar pushing the price of crude higher.
Saudi Arabia remains committed to cutting production, but it remains to be seen how long the other major producers could agree to limit their revenue specially as their market share is threatened by the rise of US and Brazilian production.
GOLD – Gold Higher on Soft Dollar and Risk Events on the Horizon
Gold bounced back on Friday and is on track to a 1 percent gain on a weekly basis. The yellow metal fell close to 1.5 percent on Thursday after global disappointing data points were taken as a good signal to take profits by investors resulting in a stronger dollar as assets were liquidated.
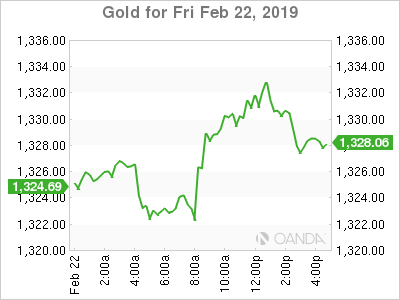
The Fed was seen as less dovish on the minutes released this week, but the fact remains that with mixed data a rate hike could be pushed to the second half of the year putting less pressure on gold. Risk events will continue to keep gold on investors’ portfolios as breakthroughs and possible breakdowns in the US-China and Brexit negotiations are still plausible.
STOCKS – Global Stocks Rise as US-China Close to an Understanding
The meeting between US President Donald Trump and Chinese Vice Premier Liu He is seen as another important signal that talks are headed in the right direction a week away from the deadline set during the G20 meeting.
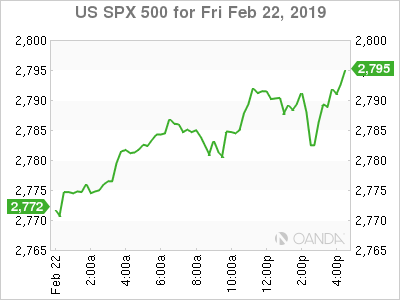
The market quickly digested the disappointing US data and is moving on to the potential positive impact to global growth if the two largest economies sort out their trade dispute.
Markets around the globe rose as the US and China could give more details on their negotiations, although as per the comments from high level US officials it doesn’t have to be ahead of March 1, as they are now treating it as a very soft deadline.
Australia & New Zealand Weekly: RBA to Cut the Cash Rate by 25bps in August and November
Week beginning 25 February 2019
- Westpac expects the RBA to cut the Cash Rate 25bps in August and November.
- Australia: dwelling prices, capex survey, construction work, credit.
- NZ: retail trade, business confidence, building consents, terms of trade.
- China: NBS PMI's.
- Europe: CPI, EC business surveys.
- US: GDP, PCE deflator, Fed Chair Powell semi-annual testimony.
- Key economic & financial forecasts.
Information contained in this report current as at 22 February 2019.
Westpac Expects the RBA to Cut the Cash Rate by 25bps in August and November
Westpac now expects the Reserve Bank to cut the cash rate by 25bps in both August and November this year.
We have revised down our GDP growth forecasts for 2019 and 2020 from 2.6% to 2.2%. With the slower growth profile we now expect to see the unemployment rate lift to 5.5% by late 2019. That makes a strong case for official rate cuts to cushion the downturn and, in turn, meet the RBA's medium term objectives.
The Reserve Bank recently revised down its growth forecasts for 2019 and 2020 from 3.25% and 3.0% to 3.0% and 2.75% respectively. It also cut its estimate for 2018 from 3.5% to 2.75%.
Momentum in 2018 slowed dramatically through the year. The annualised growth rate in the first half was 4% whereas in the second half we estimate that the pace slowed to 1.5%.
Moving from a 1.5% pace to a 3% pace in 2019 seems to be a very large stretch.
Westpac's growth forecast in 2019 and 2020 has been a much weaker 2.6% in each year but even that number now appears too high.
Our new forecast for GDP growth in 2019 and 2020 is 2.2%. In particular, we have been expecting only a modest impact on consumer spending from the likely negative wealth effect associated with falling house prices in Sydney and Melbourne.
Our growth forecasts have assumed a lift in the savings rate across 2019 from 2.4% to 2.9%. That would be consistent with consumption growth of 2.4%. Note that we expect momentum in consumption growth in the second half of 2018 to be closer to 1.5%.
A more reasonable assessment of the lift in the savings rate in 2019 is from 2.4% to 3.5% with a lift towards 5.0% expected in 2020. Those savings rates imply consumer spending growth around 2%.
That lift assumes that house prices in Sydney and Melbourne will continue to fall through 2019. Our estimates of the need to restore affordability and the impact of tighter lending standards on prices point to falls of around 5%–10% in Sydney and Melbourne over the course of 2019 complemented by softness in other markets.
Absent any policy response from the RBA we expect that further falls will be necessary in 2020 before stability in these markets will be achieved.
These headwinds for the housing market and activity are also apparent in developments around credit. In the second half of 2018 new lending for housing fell by 14.9% with both investors (–15.5%) and owner occupiers (–14.7%) being affected. This is a sharper correction than we had anticipated. These falls are a combination of both demand (concerns around falling prices and stretched affordability) and supply (new regulations and caution from some lenders in a falling market).
We expect these falls, albeit at a much slower pace, to continue through 2019 representing a negative feedback loop to prices.
That negative wealth effect is therefore likely to persist through 2020 with a further extension of the soft profile for consumer spending.
Other important dynamics will be around the sharp downturn in residential housing construction. We have revised down our forecast for residential housing construction in 2019 to –10% from –7% and –5% in 2020 from –3%. We also envisage a weaker profile for business equipment investment as businesses adjust their plans to a softening growth environment.
Overall we have revised down our GDP growth rates in 2019 and 2020 from 2.6% in both years to 2.2% respectively.
Consumer spending; residential housing construction and equipment investment are all key to the outlook for jobs growth. With reasonable estimates for the participation rate our weaker jobs growth profile has the unemployment rate lifting to 5.5% in the second half of 2019 and further by end 2020.
Our process for forecasting monetary policy has always been to assume that the economy will evolve as we expect and then to anticipate the policy response once the authorities react to the new reality.
The decision by the Reserve Bank Board to accept the possibility that interest rates could fall further, despite the current record low levels, is profoundly important.
We can now be confident that if our growth profile does evolve the Reserve Bank will be prepared to act. Prior to this more balanced approach to rates it was reasonable to assume that it was most reluctant to lower rates. The view seemed to be that the adjustment in the housing market was a necessary development with limited spill over effects on the rest of the economy.
Lowering rates, as we last saw in 2016, would only disrupt that adjustment while the rest of the economy was not in need of further stimulus.
The approach now seems to be that the spill over effects to the rest of the economy are real and the "adjustment" process may be more substantial than earlier anticipated. Certainly the collapse in new lending and sharp falls in house prices would be attracting considerable attention.
Note that the current view of the Reserve Bank is GDP growth of 3% in 2019; and 2.75% in 2020. That profile is, in their view, consistent with a gradual fall in the unemployment rate from 5.0% to 4.75% by end 2020.
The rise in the unemployment rate which we envisage through 2019 will not be severe since unit labour costs are contained and labour enjoys a relative cost advantage over capital. However it will be contrary to the Reserve Bank's expectations and prompt a significant revision to the 4.75% forecast for 2020.
When might this decision be taken?
The forces around a slowing economy, falling house prices, and weak consumer spending are already apparent. However the current forecasts do not indicate that the Bank expects these conditions to persist.
Recognition of this persistence is likely to take some time, but not too much time. Our preferred estimate would be the August Board meeting. A full explanation of the reasons behind the decision can be set out in the August Statement on Monetary Policy.
That timing will also allow two more inflation prints to confirm that the further widening of the output gap, as growth remains stuck well below trend, is constraining inflation with little likelihood of achieving the current forecast of 2.25% inflation in 2020.
A second cut at the November Board meeting is likely to follow. Unlike the response of the markets in 2016 to two rate cuts we do not expect that these two cuts will immediately stabilise housing markets. However there will be sufficient progress for the Reserve Bank to resume its cautious stance.
Adjustments will also be accommodated by the Australian dollar, possibly in lieu of even lower rates.
Partially offsetting our weaker profile for the AUD will be more "patience" on the part of the Federal Reserve with the federal funds rate. Following my trip to the US over the last few weeks where I met with a number of officials and market participants it is clear that even if the Federal Reserve decides that higher rates will be necessary it will take considerable time to make the case.
Accordingly we have eliminated our forecast for hikes in the federal funds rate in June and September leaving one more hike in December to recognise the need to finally settle on the neutral rate setting.
The net impact of these forecast changes is for a further 25bp deterioration in the overnight cash rate differential. That puts downside risks to our current target of USD 0.68 for the AUD in the second half of 2019 particularly if the expected cuts from the Reserve Bank are ineffective in settling markets.
The Risks to This Rate Outlook
Housing markets may stabilise more quickly than we anticipate and the extended negative wealth effect may not materialise.
The labour market may hold up more strongly than we expect. (note the January Employment Report showing 39,000 new jobs). Certainly evidence from other countries points to unusually strong labour markets despite other less constructive developments in these countries. A relative improvement in the cost of labour may hold up labour markets despite soft demand conditions. Unit labour costs in Australia have been flat for many years.
We may be overestimating the appetite of the RBA to respond to the environment we are describing.
Wages growth may lift more quickly than we expect, boosting household incomes and supporting spending despite a negative wealth effect. That lift may be supplemented by unexpected increases in the terms of trade as China boosts its own growth through housing and infrastructure. On the other hand while this is a perfectly reasonable scenario, there is still likely to be little flow through from higher commodity prices to household incomes as mining companies remain cautious. Mining wages continue to languish highlighting the limited effect a strong terms of trade has on the broader economy.
There is mixed evidence around wealth effects in other countries although the scale of the adjustment in house prices in Sydney and Melbourne is too large to downplay.
Conclusion
Since the last rate cut in August 2016 Westpac has consistently held the line that the RBA cash rate would remain on hold for the foreseeable future (a standard 2–3 year window). That has been despite markets, the RBA and most economists expecting higher rates.
To an extent this view was influenced by the perception that the Bank welcomed the adjustment in the housing markets and saw insignificant spill over effects to the rest of the economy.
The recent change of rhetoric from the Bank on that issue is important.
Our revised growth, inflation and unemployment forecasts now make a convincing case for lower rates.
The week that was
Following a marked deceleration in GDP growth in the second half of 2018, and with domestic and global risks pressing, Westpac Economics this week changed its RBA call to two 25bp cuts in 2019.
As outlined by our Chief Economist Bill Evans is his weekly essay, Westpac had previously anticipated growth of 2.6%yr in 2019 and 2020, but we are now forecasting growth of just 2.2%yr for both years. This contrasts with the RBA's around 3.0%yr central scenario for 2019 and 2.75%yr in 2020.
Key to our view is the belief that the ongoing decline in house prices will have a much more significant impact on consumption than the RBA currently believe. Also material is a larger decline in dwelling investment (down 10% in 2019 and 5% in 2020) than the RBA forecast in their February Statement on Monetary Policy.
With respect to the labour market, whereas the RBA anticipates a decline in the unemployment rate to 4.75% at end-2020, we expect the unemployment rate to rise to "5.5% in the second half of 2019 and further by end 2020". In terms of the timing of the rate cuts, we look to the August meeting for the first cut, followed by a second in November.
The key risk to our weaker growth forecast and call for two rate cuts is the labour market. This week, 39k new jobs were reported for January, more than twice the market estimate and enough to keep annual employment growth at 2.2%yr. Though this pace of growth was above population growth, the unemployment rate remained unchanged in January as participation lifted further. If this pace of job creation were to persist through 2019, broadly as the RBA anticipate, then it could provide offsetting support to household finances and spending against declining house prices. In line with the recent deceleration in leading indicators of employment, such as the NAB business survey, and given our view on growth, we do not anticipate this will occur.
In addition to job growth, wage gains are also critical for household incomes and spending. For the December quarter, the wage price index came in as anticipated at 0.6% for both public and private wages. For the private sector, annual growth lifted to 2.3%yr; for the public sector though, it edged lower to 2.5%yr. While there has been solid evidence in the state detail for Victoria of an acceleration in wages growth as labour market slack has been reduced, elsewhere the response of wages growth remains very tepid. As an example, in NSW, the state with the lowest unemployment rate, wages growth should be above 3.0%yr based on underutilisation (the combination of unemployed and those who would like to work more, the underemployed). However, at December, wage inflation in the state was just 2.4%yr. To our mind, the very gradual improvement in wages growth to December, which we expect will persist in 2019, is unlikely to counterbalance material declines in wealth and the uncertainty it creates.
Offshore, minutes from the FOMC's January meeting and additional speeches by members further confirmed at least a temporary pause in federal funds rate hikes (see chart of the week below).
For Europe, the minutes of the ECB's January meeting were also released. Here there was a very clear signal that growth has disappointed of late and that this trend was likely to continue in coming quarters. These remarks signal that the current growth forecasts of the ECB will be revised down at their March meeting, and that this will set the scene for a discussion over the need for further policy support for the economy. If additional accommodation is deemed necessary, it is most likely to come in the form of fresh liquidity for the banking system, to promote the free availability of credit at a low cost.
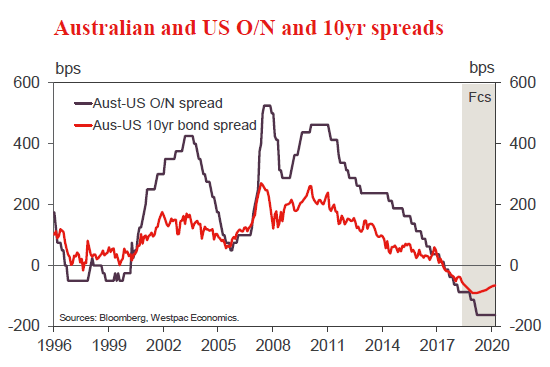
Chart of the week: Aus-US 10 year bond yield spead
In the FOMC's January meeting minutes, patience was emphasised as the way to manage the many and varied risks the US faces. Seemingly, only if risks abate, and inflation proves underlying strength in the economy dominant, will the FOMC look to tighten further.
While we have removed the June and September FOMC rate hikes that we previously anticipated, we still see a hike in December 2019 as most likely. Continued strength in the consumer through 2019, as wages growth strengthens further and current global risks dissipate, would justify such an action.
The consequence of a rate hike from the FOMC in December following two cuts from the RBA in August and November will be a cash rate differential of 163bps. We believe this is likely to see the spread betwen the Australian and US 10-year Treasury yields widen to around 90bps in the second half of 2019. For the Australian dollar, our USD0.68 low of September is retained, though downside risks are clear.
New Zealand: week ahead & data wrap
Extraordinarily ordinary
This week we released our latest Economic Overview.1 In it we point out that the New Zealand economy clearly lost some steam in late-2018. However, we expect that the economy will regain some of its earlier momentum over 2019, with annual GDP growth set to reaccelerate to 3.1% by year's end. In part that's due to the 20% fall in petrol prices since October, which has put money back into households' wallets. The coming year will also see increases in government spending, a lift in construction activity, and firmness in farm incomes. On top of those factors, labour incomes are also set to rise over the coming year supported by large planned increases in the minimum wage and gains associated with collective bargaining.
But while the above factors are helping to boost demand for now, the firming in economic growth we expect over 2019 will be temporary. Several of the other factors that have supported growth in recent years are now moving into new phases, and going forward they won't provide the same support for demand that they once did. As we head into the early 2020s this will see growth slowing to low levels of around 2% per annum – a sharper slowdown than previously expected.
A key reason why we expect GDP growth to cool, and also the major contributor to our lower longer-term growth forecasts, is slower population growth. Annual population growth rose to 2% in recent years underpinned by record levels of net migration. However, population growth has already slowed to around 1.5%, and we expect that it will slow to around 1% in 2021. That signals a substantial reduction in the economy's rate of potential GDP growth.
This decline in population growth has been starker than we previously anticipated and comes on the back of a marked slowdown in long-term migration. Stats NZ's recent updates have revealed that net migration actually peaked back in 2016 and is now down 20% from its peak (previous estimates indicated that migration had continued to climb through 2017). We expect this decline will continue over the next few years.
Slower population growth will reduce the need to build houses. That comes atop of the continuing wind-down in post-earthquake reconstruction in Canterbury and Kaikoura. The combination of those factors means the peak in the construction cycle is now clearly in sight.
The coming years will also see much slower growth in household spending (which accounts for around 60% of GDP). After solid gains of 5% to 6% per annum in recent years, we expect that spending growth will drop to 2% in the early part of next decade. In part, that's because of the slowdown in population growth discussed above. In addition, a weak outlook for house price growth over the coming years also signals a significant drag on spending. While recent falls in mortgage rates and an easing in borrowing restrictions will boost house prices in the very near term, policy changes (including those affecting the tax system) are likely to see modest price declines over the coming years.
With firm growth in recent years and the economy now running around trend, inflation is sitting just slightly below the midpoint of the Reserve Bank's target band. We expect to see a temporary dip in inflation this year as a result of the pull-back in petrol prices. Beyond that, tight labour markets and rising business costs will lead to a gradual rise in domestic inflation. But with economic growth set to slow again next decade, we still expect overall inflation to remain well contained around 2%. Importantly, the pick-up in inflation over the coming year isn't expected to be strong enough to prompt an RBNZ response. We're forecasting no change in the OCR for the coming three years, with the risks around that profile evenly balanced.
Taxing times
The other big news this week was the final report from the Government's Tax Working Group (TWG) which has been looking at possible reforms to New Zealand's tax system. The TWG's findings were largely as expected. The key recommendation was the introduction of a broad-based capital gains tax excluding the family home. The Group also recommended offsetting reductions to income taxes at the lower end of the scale.
We believe the benefits of introducing a capital gains tax outweigh the costs. New Zealand currently suffers from a heavy skew towards investments that yield capital gain, such as farms and property. Meanwhile, we tend to underinvest in other productive assets such as factories and service firms, which yield income. A CGT would help to right this imbalance in the country's investments. That should lead to a more diverse national balance sheet and a more efficient economy. We also expect CGT to make home ownership more affordable, leading to a higher rate of home ownership.
When it is first introduced, a CGT would dampen economic growth for a period. That's because of its impact on house prices. A CGT would erode the incentives for investors to purchase residential property, and that would flow through to lower house price inflation. Ups and downs in the economy tend to follow the swings in the housing market, so we'd expect the introduction of a CGT would also result in a period of softer household spending. This would be a transitional slowdown, and the impact could partially be offset if there is a related reduction in income tax (which would also improve the incentives to engage in paid work).
The Government will decide in April which (if any) of the TWG's recommendations it will pursue. The required legislation will be passed before the 2020 election, but will not take effect until 2021. This sets the 2020 election up as a referendum on whatever version of a capital gains tax is proposed, as the incoming Government could cancel the tax. Of the partners that make up the current government, the Labour Party and Green Party are both in favour of capital gains tax, but the New Zealand First Party is generally thought to be opposed. Consequently, we expect the TWG's recommendations to be watered down substantially. Our forecast for roughly 3% house price decline in 2021 assumes some mild version of a capital gains tax is introduced. Should the TWG's full recommendation be introduced instead, we would forecast greater house price decline than that. Alternatively, if CGT gets cancelled, house prices would hold up.
Data Previews
Aus Q4 construction work
- Feb 27, Last: -2.8%, WBC f/c: 0.4%
- Mkt f/c: x%, Range: x% to x%
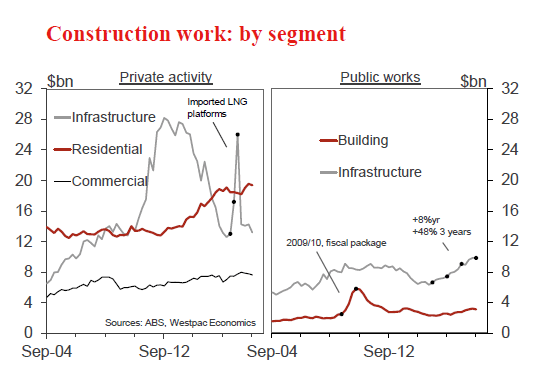
Construction work weakened in Q3, contracting by 2.8%. Falls were widespread, across new home building, commercial building, private infrastructure and public works.
For the December quarter, we anticipate a consolidation, with activity to edge 0.4% higher.
Public works likely resumed its upward trend, following the Q3 dip, supported by a sizeable and growing work pipeline.
Private infrastructure activity is expected to stabilise after a sharp fall in Q3 - a decline which was over and above that associated with the finalisation of the major gas projects. • The new home building downturn, which emerged in Q3, likely extended in to Q4 and beyond.
Aus Q4 private business capex
- Feb 28, Last: -0.5%, WBC f/c: flat
- Mkt f/c: x%, Range: x% to x%
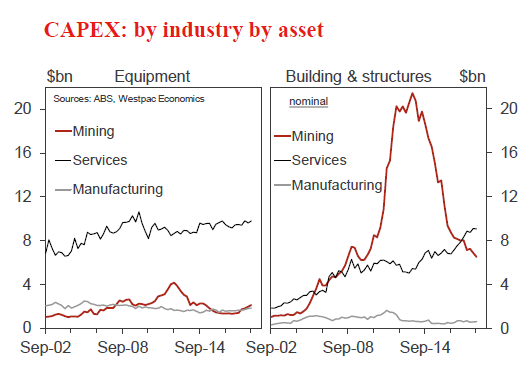
Private business spending on capex trended lower over the past year, with a Q3 outcome of -0.5%qtr, -0.6%yr. Weakness was in building & structures (-2.8%qtr, -6.9%yr), more than offsetting a lift in equipment (+2.2%qtr, 7.7%yr).
For Q4, we anticipate a flat result.
Building & structures is expected to move lower still, -0.5%qtr, with underlying softness in both commercial building and infrastructure (with gas projects being completed).
Equipment spending is forecast to rise by 0.8% with gains across the sectors (mining, services and manufacturing). Spare capacity has been reduced over recent years, hence the need to add new capacity. In mining, spending on maintenance is up associated with the new projects.
Aus 2018/19 & 2019/20 capex plans
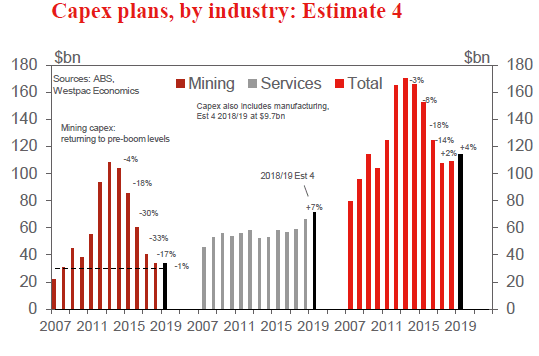
- Feb 28, Last: Est 4 for 2018/19: $114bn, +4.4%
This survey, conducted in January and February, includes the 5th estimate of capex spending plans for 2018/19 and the initial estimate for 2019/20 plans.
Recall Est 4, of $114bn, was a positive one, some 4.4% above Est 4 a year earlier. By industry Est 4 on Est 4 was: mining, -1%; services +7%; and manufacturing +7% - while by asset, equipment, +8%; and building & structures, +2%.
Historically, Est 5 is a 2% upgrade on Est 4, although the past 2 years saw an upgrade of 4.5% - adjustments which point to a figure this year between $116 to $119bn.
This update may be less upbeat, but not substantially so. Business conditions have weakened, so too global growth. However, services investment strength is in transport (spillovers from public infrastructure) and power generation (renewable energy) - and these are largely locked-in. Also, mining is benefitting from higher commodity prices.
As to Est 1 for 2019/20, we caution that often the initial two estimates are unreliable guides to actual spending.
Aus Jan private credit
- Feb 28, Last: 0.2%, WBC f/c: 0.2%
- Mkt f/c: 0.5%, Range: -1.0% to 2.5%
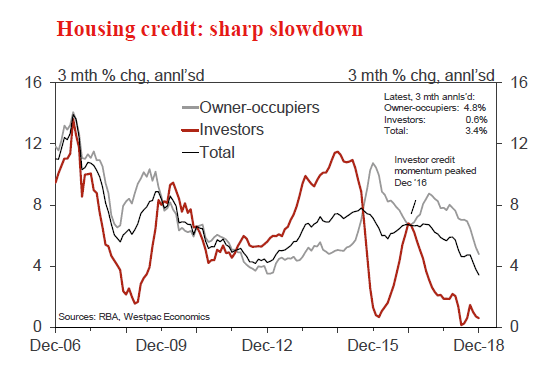
Private sector credit growth has moderated to a slow pace as the housing sector weakens.
In December, credit grew by only 0.2% to be 4.3% above the level of a year ago (the 3 month annualised pace is 3.6%). For January, we anticipate another rise of only 0.2%.
Housing credit also grew by 0.2% in December, to be 4.7% higher over the year. The 3 month annualised pace is 3.4% (0.6% for investors and 4.8% for owner-occupiers). Tighter lending conditions and weaker demand (across both investors and owner-occupiers) is weighing on the sector.
Business credit, 4.8% above the level of a year ago, is volatile around a modest uptrend as businesses increase investment in the real economy. December saw a rise of 0.3%, while the January update may be a little softer than this with commercial finance weakening late in 2018..
Aus Feb CoreLogic home value index
- Mar 1, Last: –1.2%, WBC f/c: –0.6%
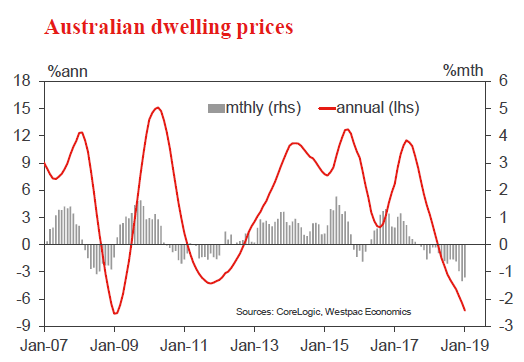
The Australian housing market's very weak finish to 2018 carried into early 2019 with the CoreLogic home value index recording a 1.2% fall in January. Given the low levels of activity over the holiday period, the result speaks more to the weakness through late last year.
The February update will have a similar skew with the market effectively only reopening in the final week of the month. The daily index points to a 0.6% decline for the month taking the cumulative fall since the late 2017 peak to –8.4% nationally.
NZ Q4 real retail sales
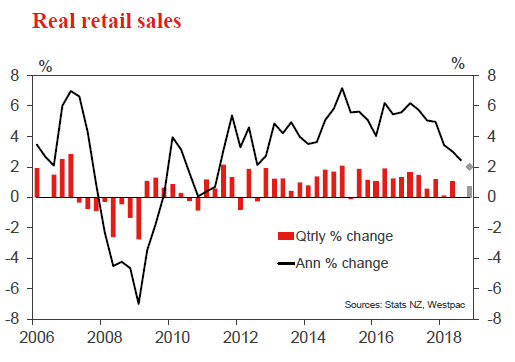
- Feb 25, Last: flat, WBC f/c: +0.7%, Mkt f/c: +0.5%
Retail spending was weaker than expected in the September quarter. While increases in petrol prices pushed up spending on fuel, this crowded out spending in other areas, leaving overall spending volumes flat for the quarter.
The sharp falls in petrol prices through November and December will have put money back into households' wallets. Combined with the earlier increase in government transfer payments to households, we expect to see a 0.7% rise in volumes, underpinned by a solid lift in core (ex-fuel) categories.
Monthly spending gauges posted unusually large swings in December and January (potentially due to delays with data processing). If that volatility is captured in the quarterly figures, it could tilt the Q4 result to the downside.
NZ Feb ANZ business confidence
- Feb 28, Last: -24.1
With no January survey, it's been a while since we've had an update on how business confidence is faring. Back in December, we saw an improvement in both the headline measure and own-activity expectations of this survey.
Concern about the downside risks to growth posed by very weak business confidence have eased in recent months as confidence has improved and the economy has trundled along. However, confidence still remains at historically low levels and out of step with the pace of growth we're seeing in the economy.
There was some easing in price measures in the last survey following sharp falls in petrol prices however, pricing intentions remain elevated relative to history. Inflation expectations have continued to linger a little above 2%.

NZ Jan dwelling consents
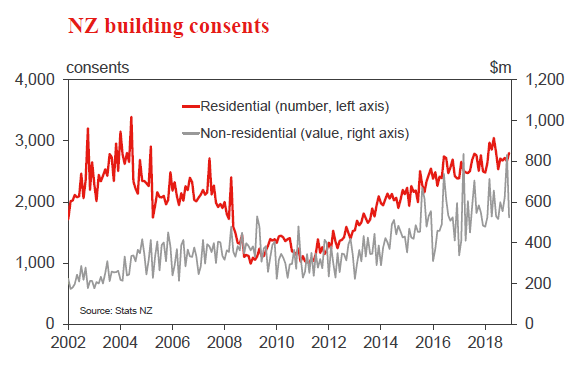
- Mar 1, Last: +5.1%, WBC f/c: -2.0%
Dwelling consent issuance rose by 5.1% in December, buoyed by a gain in the apartments/multiples category. On an annual basis, consent numbers have risen to a high level, with 33,000 new dwellings consented over 2018 (the highest level since 2004). However, it's not obvious that issuance will continue to push higher over the coming year. In fact, after picking up in late 2017, consent numbers have essentially been flat, with numbers in Auckland (which drove much of the earlier increase) easing back a little.
We expect January's report will record a 2% drop following last month's rise in the volatile multiples category. That will leave the annual consents count largely unchanged.
NZ Q4 terms of trade
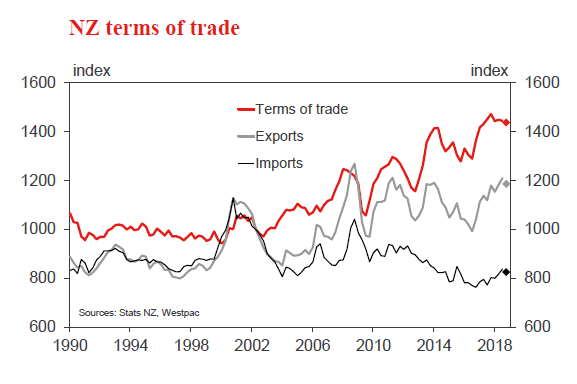
- Mar 1, Last: -0.3%, WBC f/c: -0.5%, Mkt f/c: -1.0%
New Zealand's terms of trade edged back slightly over 2018 after reaching an all-time high in 2017. There were mixed results for export commodity prices over the year, while rising oil prices added to the import bill.
We estimate that the terms of trade fell by 0.5% in the December quarter. This comprises a 2% drop in export prices and a 1.5% drop in import prices, with the higher New Zealand dollar acting as a drag on both sides.
Dairy export prices fell about 6%, reversing a jump in the previous quarter. Other export prices look to be little changed. World oil prices fell sharply in late 2018, though due to the timing of shipments this will likely have more impact on the March quarter trade figures.
US Q4 GDP
- Feb 28, Last: 3.5% annls'd, WBC f/c 2.5%, Mkt f/c: 2.5%
The long-delayed first release for Q4 GDP is now due February 28.
Through 2018, growth remained strong, particularly midyear as it averaged close to 4.0% annualised. Central to these outcomes has been strength in the consumer, with annualised consumption growth over the six months to September an outsized 4.0%.
Following this strength and the significant downside surprise for retail sales in December, the consumer is arguably the most significant risk to our and the market's forecast for Q4. If a downside surprise in this category of spending is seen, it will likely prove fleeting given labour market strength.
Elsewhere in the accounts, business and residential investment are softening. However, government spending remains strong, and will do so till late-2019.