Sample Category Title
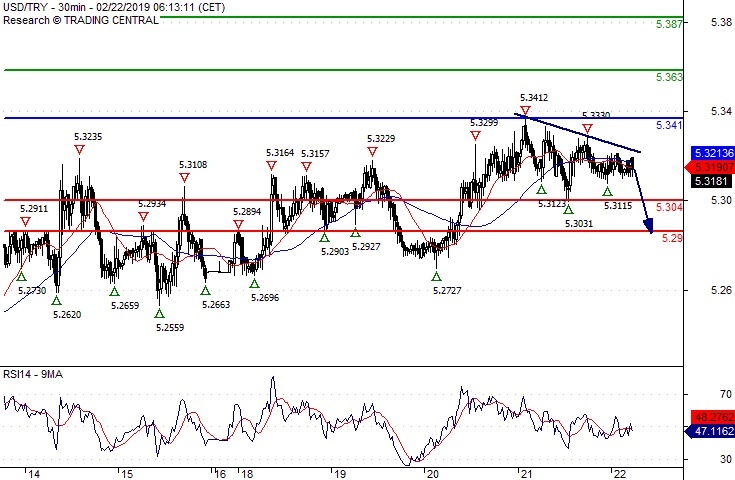
USD/TRY Under Pressure
Pivot (invalidation): 5.3410
Our preference Short positions below 5.3410 with targets at 5.3040 & 5.2900 in extension.
Alternative scenario Above 5.3410 look for further upside with 5.3630 & 5.3870 as targets.
Comment The RSI lacks upward momentum.
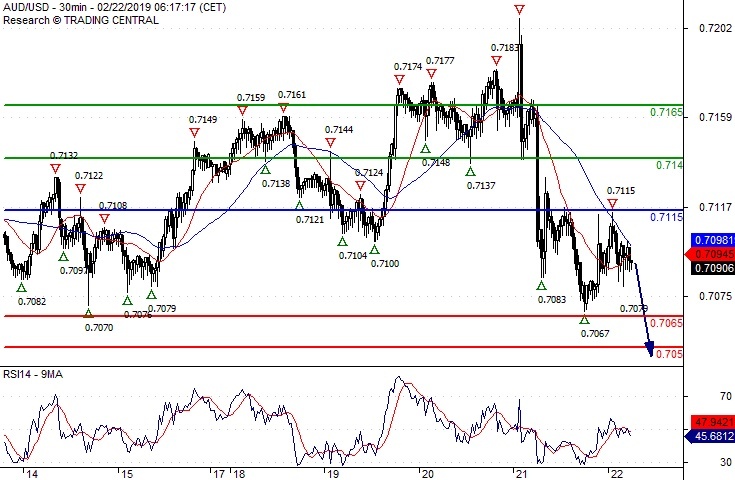
AUD/USD Turning Down
Pivot (invalidation): 0.7115
Our preference Short positions below 0.7115 with targets at 0.7065 & 0.7050 in extension.
Alternative scenario Above 0.7115 look for further upside with 0.7140 & 0.7165 as targets.
Comment As Long as the resistance at 0.7115 is not surpassed, the risk of the break below 0.7065 remains high.
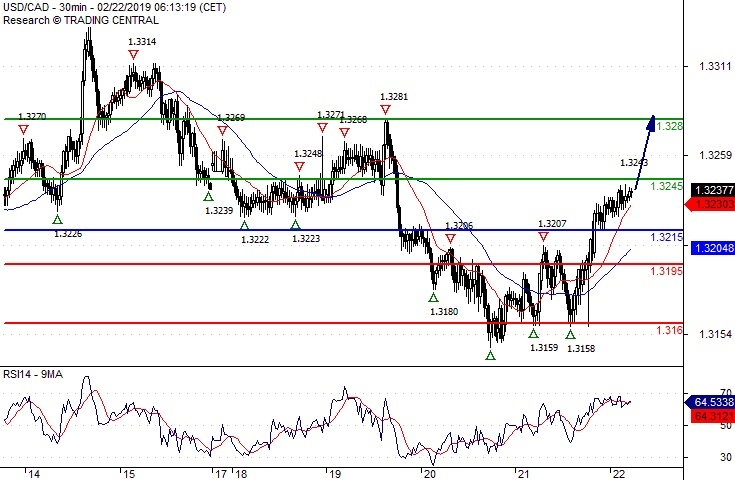
USD/CAD Target 1.3280
Pivot (invalidation): 1.3215
Our preference Long positions above 1.3215 with targets at 1.3245 & 1.3280 in extension.
Alternative scenario Below 1.3215 look for further downside with 1.3195 & 1.3160 as targets.
Comment The RSI is bullish and calls for further advance.
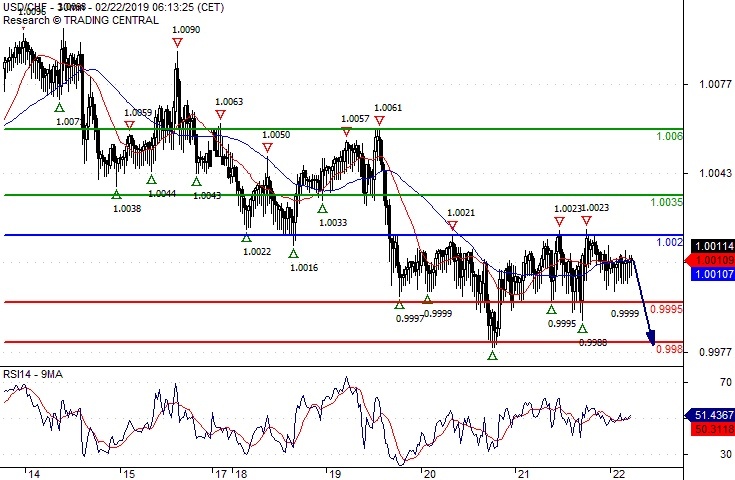
USD/CHF Key Resistance At 1.0020
Pivot (invalidation): 1.0020
Our preference Short positions below 1.0020 with targets at 0.9995 & 0.9980 in extension.
Alternative scenario Above 1.0020 look for further upside with 1.0035 & 1.0060 as targets.
Comment The upward potential is likely to be limited by the resistance at 1.0020.
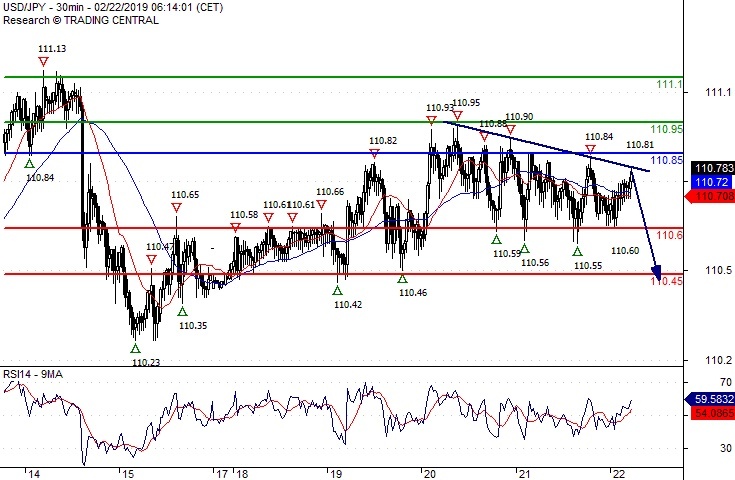
USD/JPY Caution
Pivot (invalidation): 110.85
Our preference Short positions below 110.85 with targets at 110.60 & 110.45 in extension.
Alternative scenario Above 110.85 look for further upside with 110.95 & 111.10 as targets.
Comment Intraday technical indicators are mixed and call for caution.
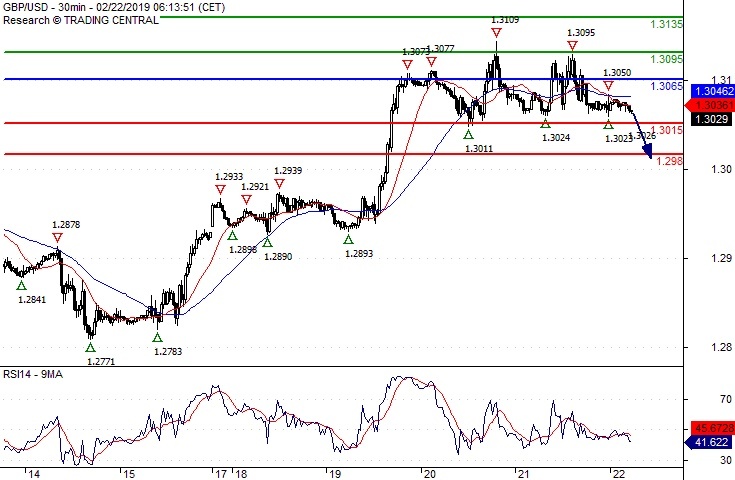
GBP/USD Towards 1.2980
Pivot (invalidation): 1.3065
Our preference Short positions below 1.3065 with targets at 1.3015 & 1.2980 in extension.
Alternative scenario Above 1.3065 look for further upside with 1.3095 & 1.3135 as targets.
Comment The RSI is bearish and calls for further downside
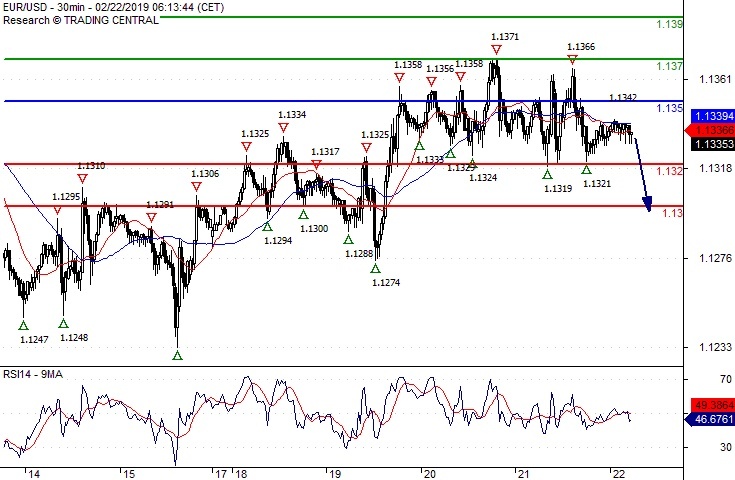
EUR/USD Watch 1.1300
Pivot (invalidation): 1.1350
Our preference Short positions below 1.1350 with targets at 1.1320 & 1.1300 in extension.
Alternative scenario Above 1.1350 look for further upside with 1.1370 & 1.1390 as targets.
Comment A break below 1.1320 would trigger a drop towards 1.1300.
USD/CAD Daily Outlook
Daily Pivots: (S1) 1.3181; (P) 1.3210; (R1) 1.3258; More...
USD/CAD's break of 1.3225 minor resistance suggests that pull back from 1.3340 has completed at 1.3150. Intraday bias is turned back to the upside for for 1.3340 first. Break of 1.3340 will resume the rebound from 1.3068 towards 1.3664 high. On the downside, below 1.3150 will turn focus to 1.3068 low.
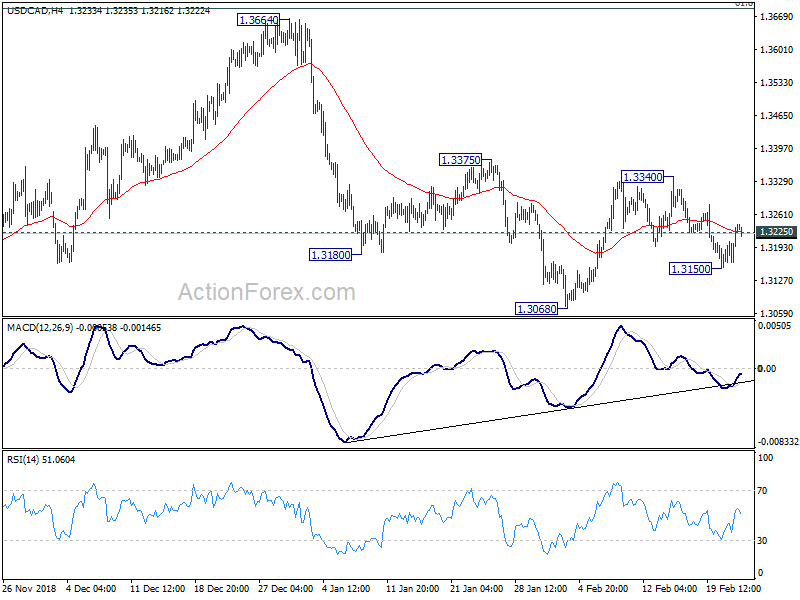
In the bigger picture, structure of the medium term rise from 1.2061 (2017 low) to 1.3664 is not clearly impulsive. Hence, we'd stay cautious on strong resistance from 61.8% retracement of 1.4689 (2016 high) to 1.2061 at 1.3685 and 1.3793 resistance to limit upside, and bring medium term topping. But in any case, medium term outlook will stay bullish as long as channel support (now at 1.3109) holds. Sustained break of 1.3793 will pave the way to retest 1.4689 (2015 high). Firm break of the channel support should confirm reversal target 1.2061 low again.
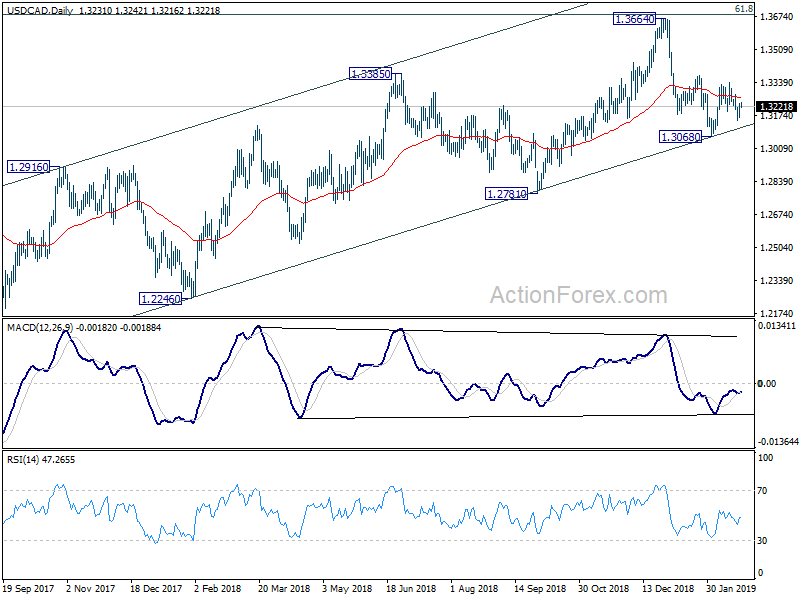
GBPJPY Consolidates After Reaching 11-Month High Of 145.00
GBPJPY failed to post more gains above the fresh 11-month high of 145.00 that it posted earlier this week and is moving sideways within a narrow range of 144.05 – 145.00 in the 4-hour chart. Currently, the price is developing around the red Tenkan-sen line suggesting a possible bearish retracement, while it still stands above the 20- and 40-simple moving averages (SMAs).
Technically, the stochastic oscillator continues to improve above the oversold zone and is posting a bullish cross within the %K and %D lines, while the RSI indicator is flattening in the positive territory, confirming the recent neutral bias.
Should the market head north again and surpasses the 145.00 strong psychological level,the 146.00 handle would be closely watched, taken from the high on November 22, as there is not any significant area before this level.
On the flipside, the 144.05 support has been halting downside pressure this week and if bearish pressures resume, the 143.25 barrier, which coincides with the 40-SMA, could come into focus. If the bears drive the price even lower it would be interesting to see whether the pair could cross below the bottom of the Ichimoku cloud and the 23.6% Fibonacci retracement level of the upleg 132.50 to 145.00, around 142.05.
Overall, in the short-term picture, GBPJPY is looking bullish and should remain positive as long as the market holds above the 2-year low of 132.50.
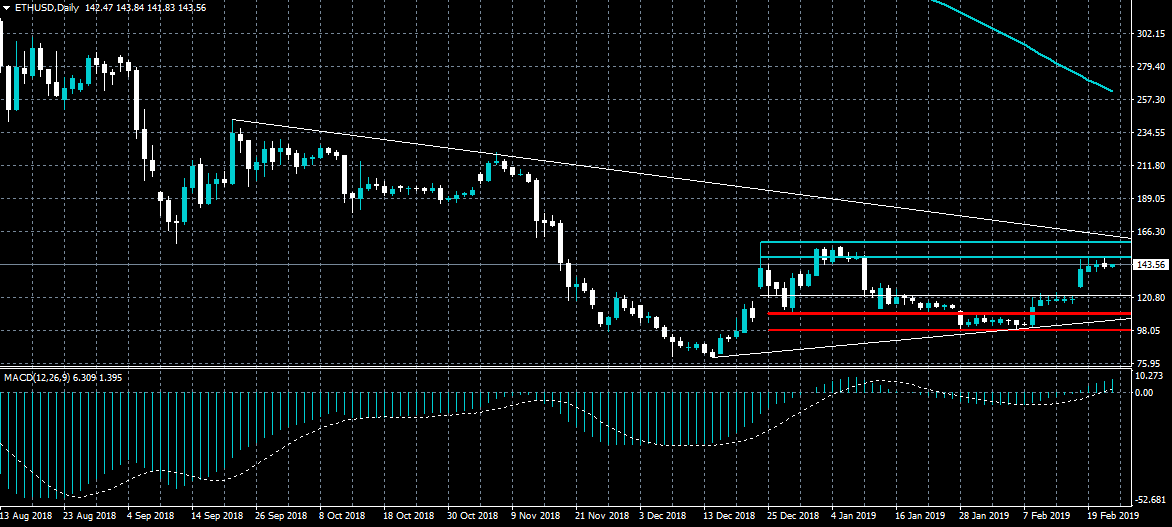
ETHUSD Awaiting Triangle Break
Ethereum continues to hold a bullish short-term bias on Friday, with the second largest cryptocurrency trading well above the $140.00 level. If the ETHUSD pair can break above the $160.00, the cryptocurrency will perform a major technical breakout above a triangle pattern. If sellers force price back under the $140.00 level, a technical correction back towards the $120.00 level may occur.
The ETHUSD pair is bullish while trading above the $120.00 level, key resistance is found at the $145.00 and $160.00 levels.
If the ETHUSD pair trades below the $140.00 level, key support is found at the $130.00 and $120.00 levels.