

Sample Category Title
Switzerland’s M3 Money Supply Climbed In January
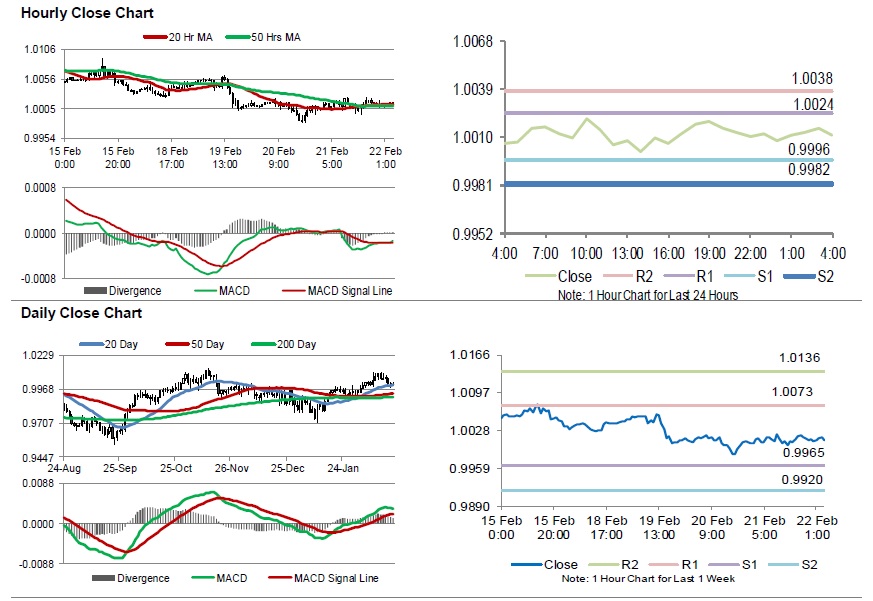
For the 24 hours to 23:00 GMT, the USD rose 0.05% against the CHF and closed at 1.0012.
In economic news Switzerland's M3 money supply advanced 3.4% on an annual basis in January, compared to a climb of 3.1% in the preceding month.
In the Asian session, at GMT0400, the pair is trading at 1.0011, with the USD trading a tad lower against the CHF from yesterday's close.
The pair is expected to find support at 0.9996, and a fall through could take it to the next support level of 0.9982. The pair is expected to find its first resistance at 1.0024, and a rise through could take it to the next resistance level of 1.0038.
With no macroeconomic releases in Switzerland today, investors would look forward to global macroeconomic releases for further directions.
The currency pair is showing convergence with its 20 Hr and 50 Hr moving averages.
Loonie Extends Its Losses In The Morning Session
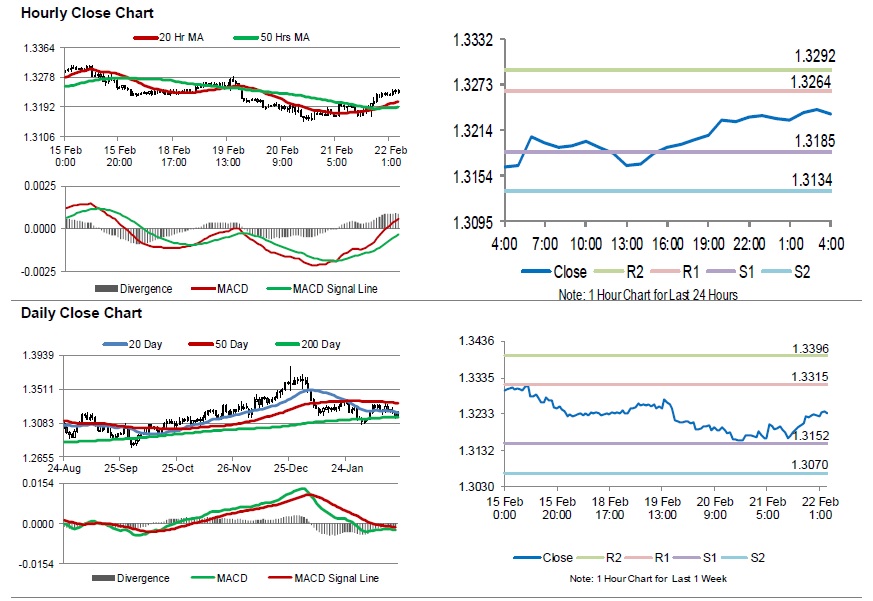
For the 24 hours to 23:00 GMT, the USD rose 0.44% against the CAD and closed at 1.3233.
The Canadian dollar declined against the US dollar, following Bank of Canada’s Governor, Stephen Poloz’s comments.
Yesterday, the BoC Governor, Stephen Poloz, stated that the central bank was in no rush to resume monetary tightening and expressed uncertainty over the pace of future rate hikes. He cautioned that given the high levels of debt, raising rates would impact the overall economy more than in the past.
In the Asian session, at GMT0400, the pair is trading at 1.3235, with the USD trading marginally higher against the CAD from yesterday’s close.
The pair is expected to find support at 1.3185, and a fall through could take it to the next support level of 1.3134. The pair is expected to find its first resistance at 1.3264, and a rise through could take it to the next resistance level of 1.3292.
Trading trend in the Loonie today, is expected to be determined by Canada’s retail sales for December, scheduled to release later in the day.
The currency pair is trading above its 20 Hr and 50 Hr moving averages.
Aussie Extends Its Losses In The Asian Session
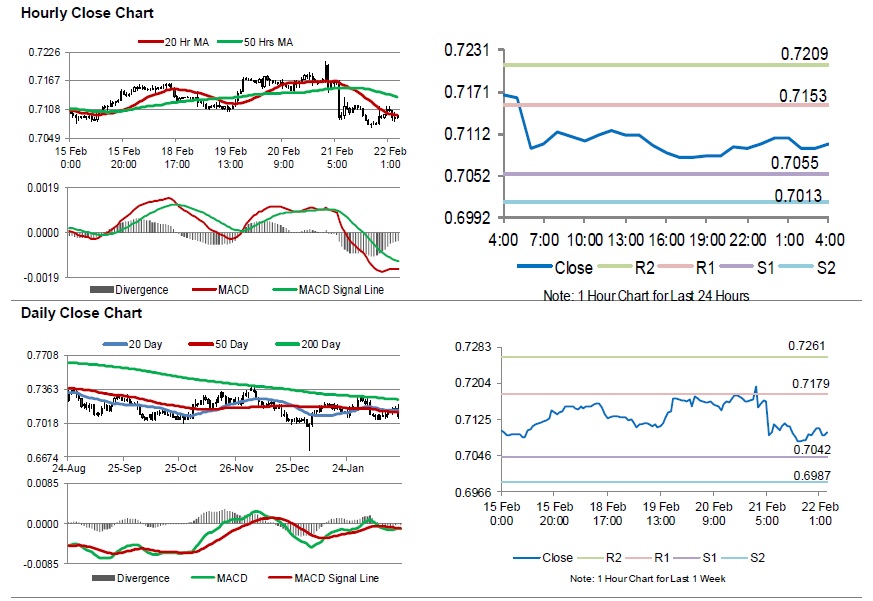
For the 24 hours to 23:00 GMT, the AUD declined 0.98% against the USD and closed at 0.7097.
LME Copper prices rose 0.6% or $39.5/MT to $6391.0/MT. Aluminium prices rose 1.6% or $29.0/MT to $1858.5/MT.
In the Asian session, at GMT0400, the pair is trading at 0.7096, with the AUD trading slightly lower against the USD from yesterday’s close.
Elsewhere in China, Australia’s largest trading partner, new home prices rose at its weakest
pace since April 2018 by 0.6% on a monthly basis in January, compared to reading of 0.8% in the prior month.
The pair is expected to find support at 0.7055, and a fall through could take it to the next support level of 0.7013. The pair is expected to find its first resistance at 0.7153, and a rise through could take it to the next resistance level of 0.7209.
The currency pair is showing convergence with its 20 Hr moving average and trading below its 50 Hr moving average.
Gold: Yellow Metal Reverses Its Losses In The Asian Session
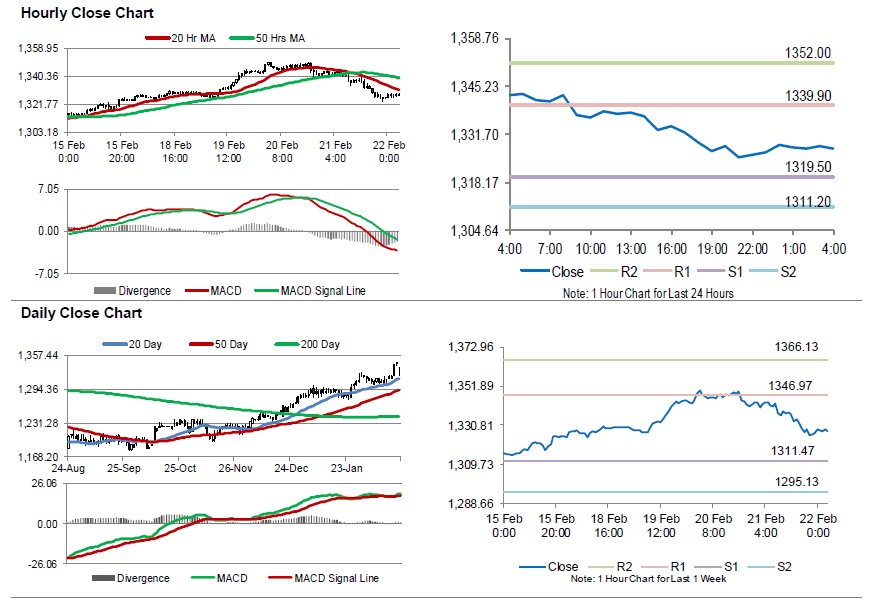
For the 24 hours to 23:00 GMT, Gold declined 1.20% against the USD and closed at USD1326.00 per ounce, amid broad strength in the greenback.
In the Asian session, at GMT0400, the pair is trading at 1327.80, with gold trading 0.14% higher against the USD from yesterday’s close.
The pair is expected to find support at 1319.50, and a fall through could take it to the next support level of 1311.20. The pair is expected to find its first resistance at 1339.90, and a rise through could take it to the next resistance level of 1352.00.
The yellow metal is trading below its 20 Hr and 50 Hr moving averages.
Silver: White Metal Trading On A Stronger Footing This Morning
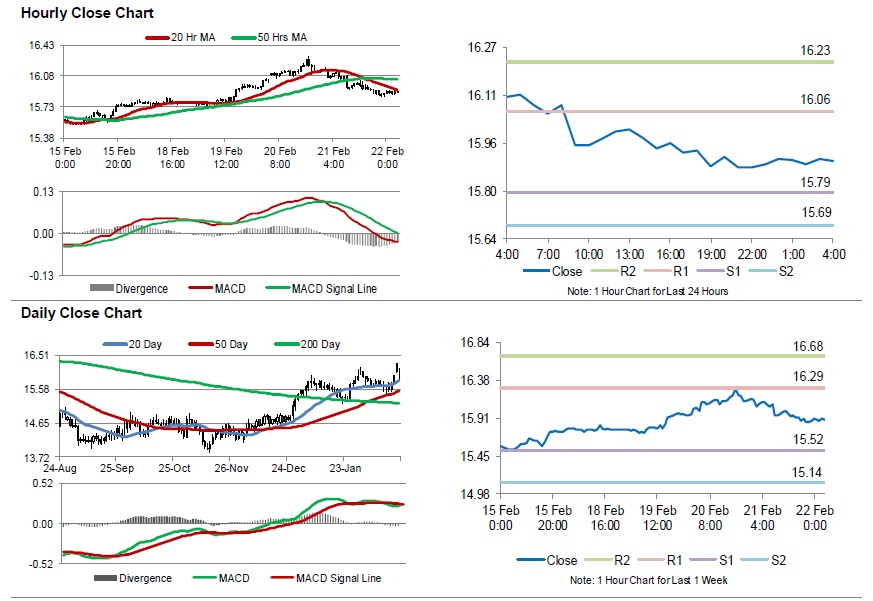
For the 24 hours to 23:00 GMT, Silver declined 1.58% against the USD and closed at USD15.89 per ounce, tracking losses in gold prices.
In the Asian session, at GMT0400, the pair is trading at 15.89, with silver trading 0.06% higher against the USD from yesterday’s close.
The pair is expected to find support at 15.79, and a fall through could take it to the next support level of 15.69. The pair is expected to find its first resistance at 16.06, and a rise through could take it to the next resistance level of 16.23.
The white metal is showing convergence with its 20 Hr moving average and trading below its 50 Hr moving average.
Crude Oil: Oil Trading Higher, Ahead Of Baker Hughes Weekly Rig Count Data
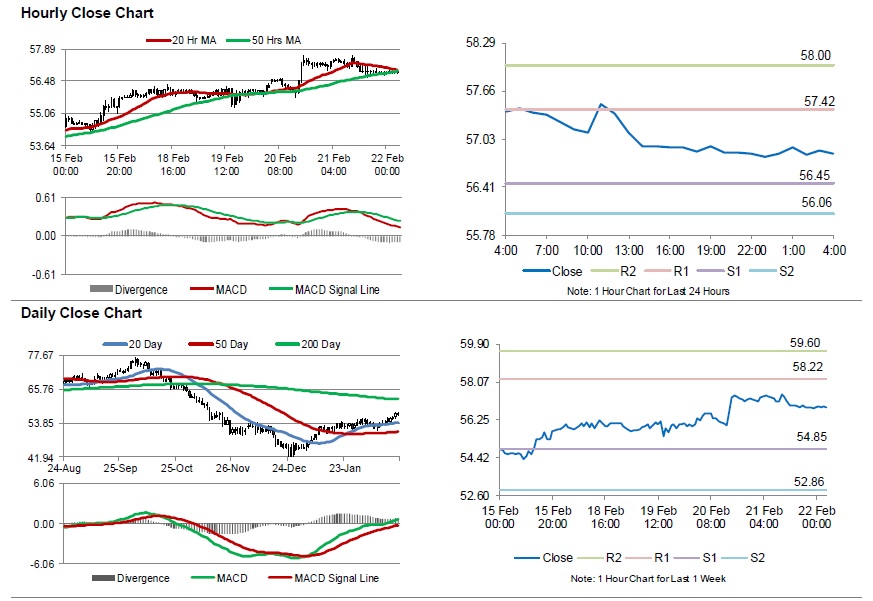
For the 24 hours to 23:00 GMT, Crude Oil declined 0.80% against the USD and closed at USD56.80 per barrel, after the Energy Information Administration (EIA) report indicated that US crude oil stockpiles rose by 3.7 million barrels to 454.0 million in the week ended 15 February 2019.
In the Asian session, at GMT0400, the pair is trading at 56.84, with oil trading 0.07% higher against the USD from yesterday’s close.
The pair is expected to find support at 56.45, and a fall through could take it to the next support level of 56.06. The pair is expected to find its first resistance at 57.42, and a rise through could take it to the next resistance level of 58.00.
Crude oil is showing convergence with its 20 Hr and 50 Hr moving averages.
Market Morning Briefing: Dollar-Yuan Dipped Below 6.70 Yesterday
STOCKS
The rally in the global indices seem to be losing steam. A near-term corrective fall looks likely in Dow, Nikkei and Shanghai on the back of some profit-taking. On the Indian front, the Sensex and Nifty have moved up closer to their key resistances. Whether the indices breaks the resistance or not will decide the next move.
The psychological resistance level of 26,000 is holding well on the Dow Jones (25,850.63, -103.81, -0.40%). A corrective fall to 25,600 and 25,500 is possible in the near-term before the uptrend resumes.
DAX (11,423.28, +21.31, +0.19%) has key resistances at 11,470 and 11,500 which can cap the upside. A pull-back from this resistance can take the index lower to 10,400 and 10,300.
Nikkei (21,387.20, -77.03, -0.36%) can dip to test is intermediate support at 21,230 before we see a fresh rally towards 21,650.
Shanghai (2,738.06, -13.75, -0.50%) has come-off sharply from the day's high of 2,794. A test of 2,710 and 2,700 looks possible in the near-term before the overall uptrend resumes.
Sensex (35,898.35, +142.09, +0.40%) and the Nifty 50 (10,789.85, 54.40, 0.51%) tested their respective resistance levels of 36,000 and 10,800 yesterday as expected. If the indices breaks above these resistances then sensex can move further higher to 36,450 and the Nifty 50 can test 10,860-10,880. But while below 36,000 sensex can dip to 35,680 and Nifty 50 can 10,720 on a failure to breach 10,800.
COMMODITIES
The upmove in gold, silver and copper have paused yesterday as expected. While gold can bounce and remain range-bound, silver and copper can dip further before reversing higher. Outlook for oil continues to remain positive although it is inching higher at a slower pace.
Gold (1325) fell sharply as expected. It has bounced slightly from the support level of 1320. While above 1320, a bounce to 1340 is possible in the near term. Cluster of supports are poised between 1320 and 1310 which can restrict the downside and also the pace of fall if gold breaks below 1320.
Silver (15.82) has declined below the psychological level of 16 and looks vulnerable to dip further towards 15.7 and 15.65 in the coming sessions.
Copper (2.90) has come-off from a high of 2.925. A break below 2.89 can take it further lower to 2.85 and 2.83 before a fresh leg of upmove begins. However, a double bottom the medium-term outlook remains bullish for a test of 3.2 and 3.25
WTI (56.9), though remains bullish, looks to be lacking strength at the moment. It could remain range bound between 55 and 58 for sometime before we see a fresh rally to 60.
Brent (67) is cotinuing to hold higher and remains bullish in the short-term for a test of 68-70. A key near-term support is at 65.55 (100-day moving average)
FOREX
The Support at 96.25-00 on Dollar Index (96.62) continues to hold well keeping chances of a longer term rise towards 98 alive, but we also have to reckon with nearer Resistance at 97.25. So, the outlook is indecisive/ ranged. Similary, the Euro (1.1337) remains below Resistance at 1.1375, but also has immediate intra-day Support at 1.1330, which can yet produce a rally towards 1.1450 next week.
We have German IFO and EU CPI data being released today. Both are expected to be soft. But that is not a guarantee that the Euro will be pushed lower.
Dollar-Yen (110.72) has traded narrowly sideways between 110.60-90 since yesterday, in line with expectation. There are two-way chances of either a fall towards 109 or a rise towards 112 in the medium term. The Euro-Yen(125.58) saw rejection from Resistance at 126 yesterday, but has been finding Support at 125.30 through yesterday. SO, we have to wait to watch both 126 (Resistance) and 125.30 (Support). Of these, the Resistance at 126 might be a little stronger.
The failure to build on its bounce to 0.7206 yesterday seems to be pushing the Aussie (0.7098) lower with chances of a decline towards 0.7025 or lower.
Dollar-Yuan (6.7220) dipped below 6.70 yesterday but has been bought back well, suggesting a possible near term rally towards 6.74-75. Dollar-Rupee (71.25) also got bought on the dip to 70.91 yesterday. We have to see if it tries rise towards 71.50-60 now.
INTEREST RATES
European CPI and German IFO data to be released today. Both are expected to be soft. These could push German Yields (2Yr -0.547%, 5Yr -0.32%, 10Yr 0.129% and 30Yr 0.744%) down a bit, especially since there is Resistance at 0.1350% and 0.75% on the 10Yr and 30Yr Bunds respectively.
While the German-US 2Yr Spread (-3.07%) remains well below -3.05%, the German-US 10Yr Spread (-2.56%) has Support near current levels and has some chances of moving up towards -2.53% in th4e near term. We need to see how these impact the Euro.
Importantly, in the USA, the yield (3.05%) has seen a sharp rally up from 3.01%, possibly breaking the downtrend that was in place since 3.45% (Nov-18). Correspondingly, the 10Yr (2.68%) and 5Yr (2.51%) have also risen, challenging their downtrends since Nov-18. Good Support is available at 2.44% on the 5Yr, suggesting chances of a further pick up in Yields, in line with the outlook in our Feb-19 monthly forecast on US Treasuries.
The RBI's MPC Minutes were released yesterday, which were dovish. The 10Yr GOI ended a tad lower at 7.5439% yesterday. With the further rise in US yields yesterday, the Indo-US 10Yr Spread (4.8799% yesterday) may well dip towards 4.85% or lower today.
AU FM Cormann: Dalian coal ban unrelated to bilateral relationship between Australia and China
Australian Dollar tumbles broadly yesterday on news that China's Dalian port banned the countries' coal import. But Australian offices are quick to talk down the implication. Mathias Cormann, Minister for Finance, said "when decisions like this have been made in the past at local port level, it was related to domestic supply related issues, environmental issues at a local level". Cormann emphasized "it was unrelated with anything to do with the bilateral relationship between Australia and China."
RBA Governor Philip Low said "I wouldn't jump yet to the conclusion that this is something directed to Australia". And, "It may well turn out to be that it's being driven by concerns about the environment in China and the profitability of the coking coal industry in China."
RBA Lowe: What’s of concern is accumulation of downside risks
RBA Governor Philip Lowe said today that the central scenario for 2019 is for growth of around 3%, inflation of around 2%and unemployment of around 5. And "this is not a bad set of numbers". However, what is more of concern is the "accumulation of downside risks".
The first major area of risks globally is "political risks" including US-China trade and technology tensions, Brexit, rise of populism and strains in some wester European countries. Second area of international risk is China slowdown. Domestically, RBA board has recently been paying "particularly close attention" to household spending and housing market. Lowe noted that " underlying trend in consumption is softer than it earlier looked to be". Decline housing prices could also affect overall spending.
On monetary policy, Lowe reiterated that "the probability that the next move is up and the probability that it is down are more evenly balanced than they were six months ago."
USD/JPY Remains In Uptrend Above 110.20
Key Highlights
- The US Dollar traded higher recently and broke the 110.80 resistance against the Japanese Yen.
- There is a strong support and bullish trend line formed near 110.20 on the 4-hours chart of USD/JPY.
- The US Initial Jobless Claims for the week ending Feb 17, 2019 declined from 239K to 216K.
- The Euro Zone CPI for Jan 2019 will be released today, which could increase 0.2% (MoM).
USDJPY Technical Analysis
After trading as high as 111.12, the US Dollar corrected lower against the Japanese Yen. The USD/JPY pair corrected below 110.50, but the 110.25 level acted as a strong support and the pair bounced back.
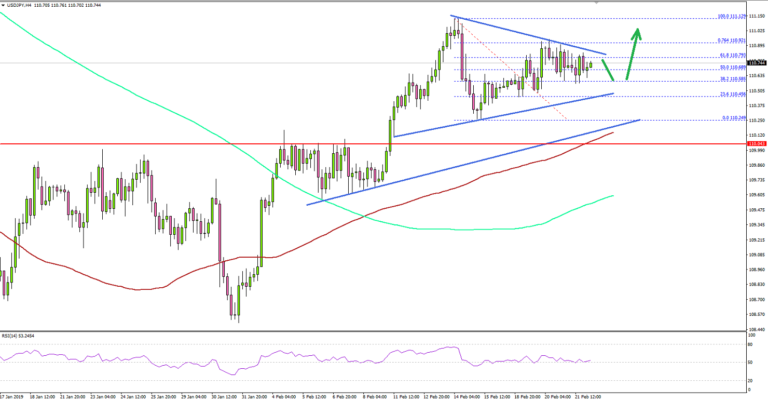
Looking at the 4-hours chart, the pair recovered above the 110.50 resistance remained well positioned above the 100 (red) simple moving average (4-hours). There was a break above the 50% Fib retracement level of the last decline from the 111.12 high to 110.24 low.
However, the upside move faced sellers near the 111.00 level and the 76.4% Fib retracement level of the last decline from the 111.12 high to 110.24 low.
Later, the pair started consolidating gains above a strong support and bullish trend line near 110.20 on the same chart. On the upside, the pair must gain momentum above the 111.00 and 111.20 resistance levels to stage further gains. The next resistance levels are 111.50 and 111.80.
On the downside, the mains supports are 110.25 and 110.20, below which the pair could test the 100 (red) simple moving average (4-hours). If there is a daily close below 110.00, the pair could move back in the bearish zone, with next targets as 109.60 and 109.20.
Fundamentally, the US Initial Jobless Claims figure for the week ending Feb 17, 2019 was released recently. The market was looking for a decline from 239K to 229K.
However, the result was better than the forecast as the Initial Jobless Claims declined from 239K to 216K. The report added that:
The 4-week moving average was 235,750, an increase of 4,000 from the previous week’s unrevised average of 231,750. This is the highest level for this average since January 20, 2018 when it was 237,500.
Overall, there was short-term weakness in the US Dollar and pairs like EUR/USD and GBP/USD recovered recently. However, USD/JPY remains well supported for more gains as long as it is above 110.20.
Economic Releases to Watch Today
- German Gross Domestic Product for Q4 2018 (YoY) – Forecast 0.9%, versus 0.9% previous.
- German Gross Domestic Product for Q4 2018 (QoQ) – Forecast 0%, versus 0% previous.
- Euro Zone CPI for Jan 2019 (YoY) – Forecast +1.4, versus +1.4% previous.
- Euro Zone CPI for Jan 2019 (MoM) – Forecast +0.2%, versus 0% previous.