Sample Category Title
Dollar Stronger As Global Headwinds Trigger Anxiety
The US dollar is higher across the board across major pairs as US disappointing data triggered anxiety that lead to a drop in stock markets. As positions were liquidated there was demand for the greenback. US durable goods came in under the forecast but the a more forward-looking indicator the Philly Fed manufacturing Index fell to a negative reading highlighting worsening conditions.
The US central bank has already stressed patience after holding rates unchanged and pausing its balance sheet normalization program. Mixed data has validated their view on the economy, the stock market took the negative indicators as a signal that darkening clouds are more prevalent in the horizon and sought refuge in the US dollar.
GBP – Pound Lower With no Brexit Breakthrough
The British pound fell 0.11 percent as there was no breakthrough in the talks between PM Theresa May and European Commission chief Jean-Claude Juncker. Talks are ongoing and there will be a parliamentary vote next week. May will work through the weekend meeting with more EU leaders to get a better sense of where they stand. There is still plenty of optimism floating about as spokespersons from both sides stress that a successful deal as soon as possible is the common goal.
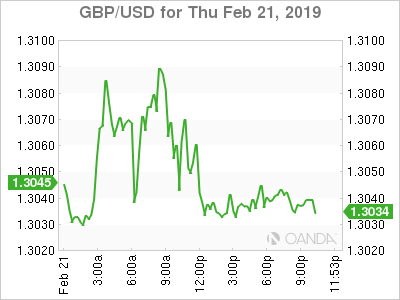
Despite the goodwill there hasn’t been much progress as the Irish backstop remains a hurdle keeping the two sides from moving forward. There has been some lateral motion regarding what the backstop is and could be, but so far, no major announcements have been made.
The currency will remain sensitive to Brexit headlines as without details, the comments from policy makers will influence the direction of the market.
USD/CAD – Loonie Lower Despite Hawkish Poloz
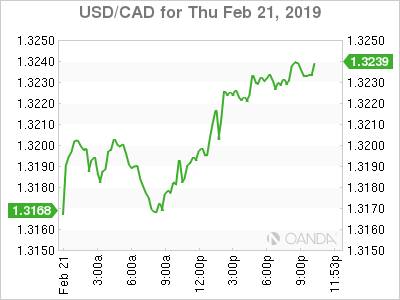
The Canadian dollar fell 0.38 percent on Thursday despite the hawkish rhetoric from Bank of Canada (BoC) Governor Stephen Poloz and wholesale sales data beating expectations. Analysts are looking beyond a potential rate hike by the BoC and economic headwinds beating down on the loonie.
Oil prices have remained stable thanks to the efforts of the OPEC+ by limiting production. The rise of US production has been kept in check, but it remains to be seen for how long those major producers will be able to curb their much-needed revenue to keep prices
US-China trade talks remain on track, but with little details on what the next moves are as the March 1 deadline approaches, the market paid more attention to the lower than expected US data on Thursday.
OIL – Stronger Dollar Puts Pressure on Oil Prices
Oil prices were lower on Thursday as the balance between OPEC+ cuts and rising US production was disrupted by the rising US dollar. Demand for the greenback rose economic headwinds were evident as manufacturing data was softer than expected in the US.
Weekly US crude inventories reported by the EIA came in higher than forecasted at 3.7 million barrels also putting pressure on prices.
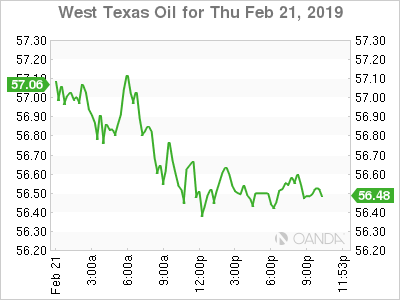
The US-China trade talks boosted prices with the promise of higher energy demand if global growth gets back on track, but data this week out of China, Europe and the United States still points to continued weakness and unless there is a major announcement soon the headwinds could push energy prices lower.
GOLD – Gold Drops as USD Soaks Safe Haven Flows
Gold fell 1.42 percent on Thursday as a strong dollar put pressure on the yellow metal. Gold is still 0.50 higher on a weekly basis, but lower than expected data and positive trade talks between the US and China did not add to a rise in the value of the metal.
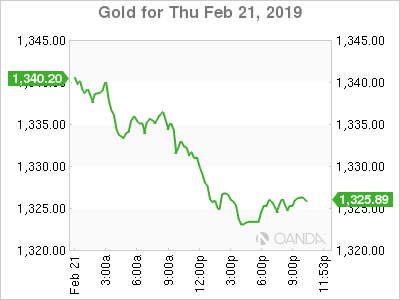
The $1,350 price level proved too strong and gold lacked the momentum ahead of the end of the week to go above it. With Brexit and US-China trade talks reaching the final stages as deadlines approach the metal will remain part of investors portfolio as a safe haven. Until there are major breakthroughs or breakdowns in both negotiations gold could remain in consolidation mode.
STOCKS – Market Sells News After Weaker US Indicators
Major stock indices were lower on Thursday despite US-China trade talks still remain on track after rumours of imminent agreements in principle are being prepared. Economic data has been weaker, putting a more short-term effect as future risk events have lacked details.
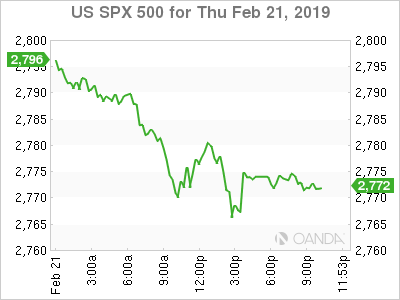
The market sold on the news of disappointing data in the major economies, while trade talks will continue for at least two weeks and could be extended further.
UK Barclay, Cox to meet EU Barnier again next week
There appears to be no breakthrough on Brexit for now. Brexit Minister Stephen Barclay and Attorney General Geoffrey Cox met EU chief Brexit negotiator Michel Barnier yesterday. They had "productive meeting" and discussed the "positions of both ides". And it's agreed that "talks should now continue urgently at a technical level". Cox will explore "legal options" with the commission's team. The trio will discuss again next week.
UK is seeking legal binding assurance that the Irish border backstop would be temporary if triggered. It's believed that once this issue is solved, especially with the endorsement of Cox, the Brexit deal would get through the Commons. However, European Commission President Jean-Claude Juncker was "not very optimistic". He noted that "in the British parliament every time they are voting, there is a majority against something, there is no majority in favor of something."
US Crude Oil Inventory Increased Less than Expected. Refined Stocks Declined
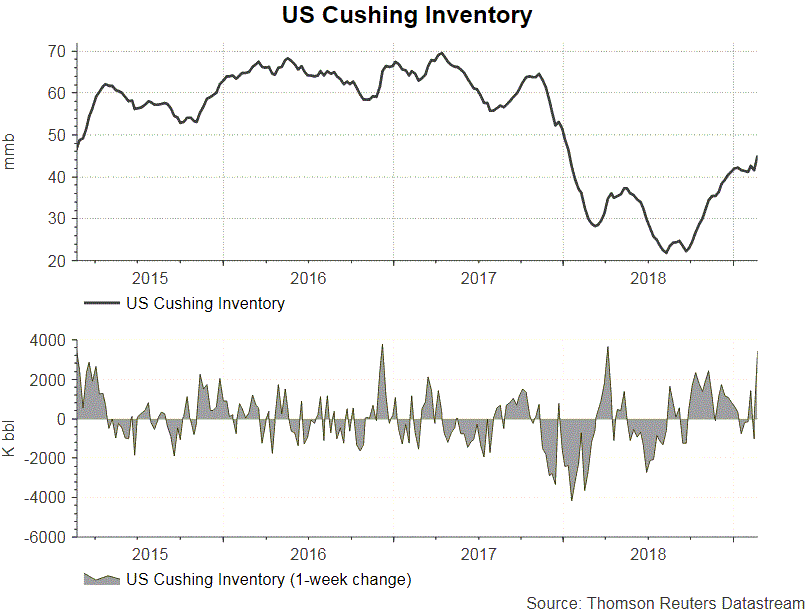
The report from the US Energy Information Administration (EIA) shows that total crude oil and petroleum products (ex. SPR) stocks fell -2.49 mmb to 1263.03 mmb in the week ended February 15 Crude oil inventory added +3.67 mmb to 454.51 mmb (consensus: +3.08 mmb). Inventories jumped +3.39 mmb in PADD2 (Midwest) and +1.67 mmb in PADD3 (Gulf Coast). Meanwhile, Cushing stock soared +3.41 mmb to 45.02 mmb. Utilization rate steadied at 85.9% and crude production climbed +0.1 mmb higher to 12M bpd for the week. Crude oil imports gained +1.31M bpd to 7.52M bpd in the prior week.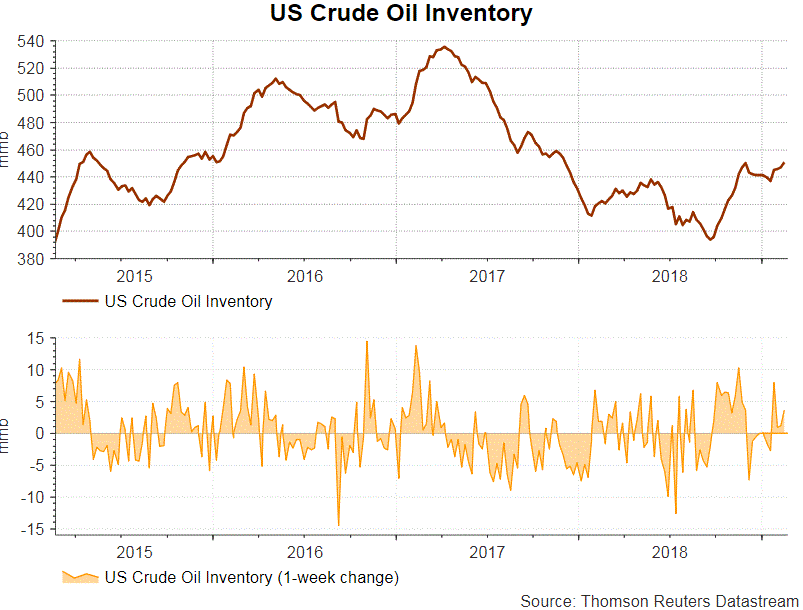
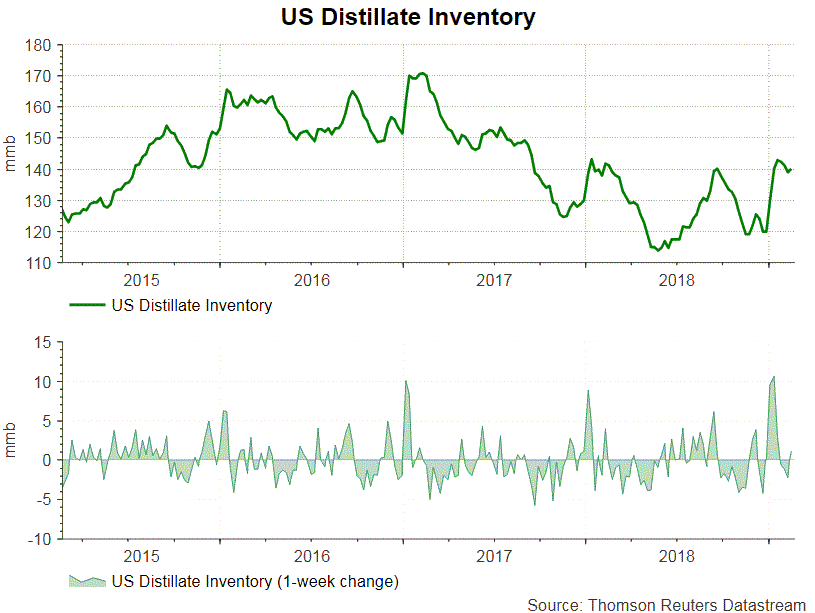
 Concerning refined oil product inventories, gasoline inventory declined +1.45 mmb to 256.85 mmb as demand added +1.76% to 8.8M bpd. The market had anticipated a -0.35 mmb drop in stockpile. Production slipped -1.35% to 9.49 bpd while imports plunged -8.1% to 0.42M bpd during the week. Distillate inventory fell -1.52 mmb to 138.68 mmb. Demand soared +11.92% to 4.22M bpd. The market had anticipated a -1.69 mmb decline in inventory. Production dipped -0.1% to 4.76M bpd while imports dropped -1.6% to 0.43M bpd during the week.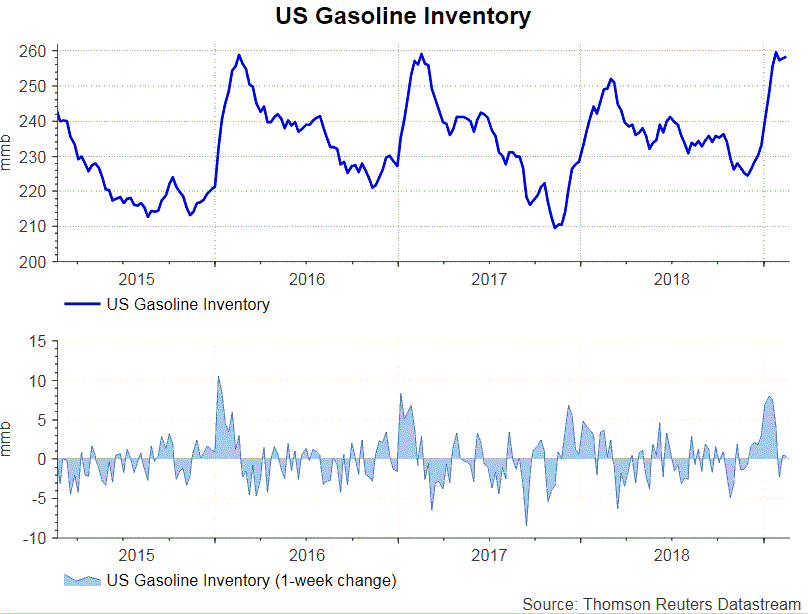
 Released after market close on Wednesday, the industry- sponsored API estimated that crude oil inventory gained +1.26 mmb during the week. For refined oil products, gasoline stockpile drew -1.55 mmb while distillate decreased -0.76 mmb.
Eco Data 2/22/19
[php_everywhere instance="1"]
US 100 Index Still Positive, But Correction May Be Looming
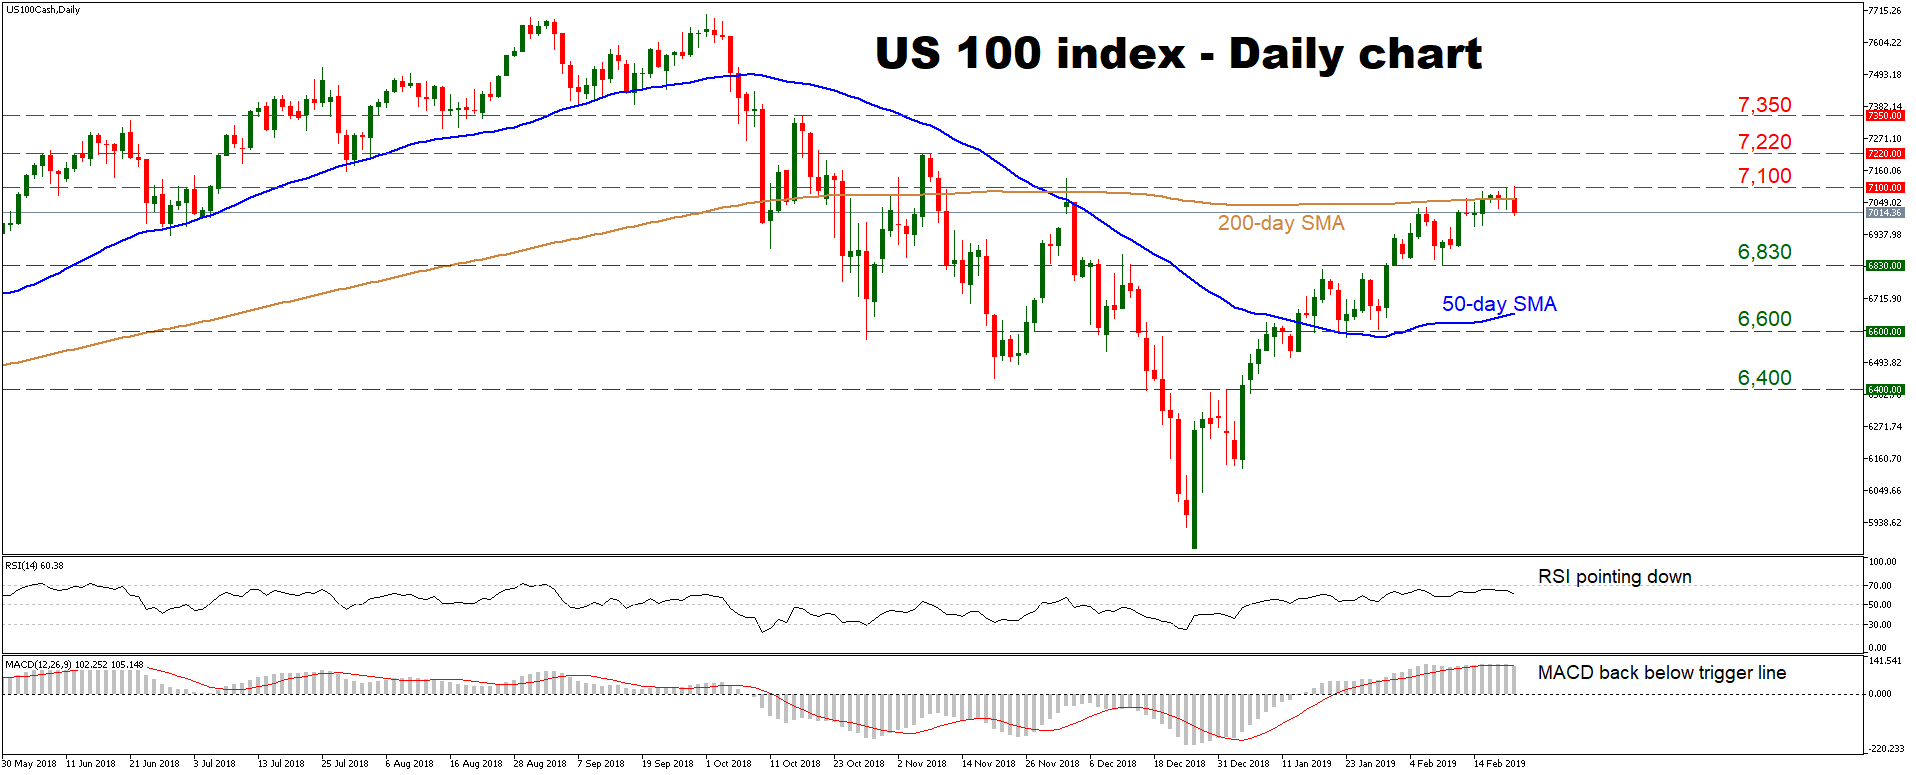
The US 100 index continues to print higher lows and higher highs on the daily chart, after it bottomed on December 26. The short-term picture thus remains somewhat positive, though the inability of the bulls to pierce above the 200-day simple moving average (SMA) is worrisome and suggests some cause for caution.
Indeed, short-term oscillators also imply a pullback may be on the cards in the immediate term, as the RSI found resistance near 70 and is pointing lower, while the MACD just crossed back below its red trigger line.
A downward correction could stall initially near 6,830, the February 8 low. A move below that could see sellers challenge the 50-day SMA, currently at 6,665. Another bearish violation would turn the bias to a more neutral one, opening the way for a test of 6,600.
On the other hand, if the bulls retake control, they may push towards the 7,100 zone, which capped the rally on February 15. Notice that the 200-day SMA – at 7,061 – can also be considered part of the same area. An upside break of that territory could see buyers aiming for the November peak of 7,220.
Summing up, the near-term picture remains cautiously positive, though a corrective pullback may be on the cards in the immediate term.
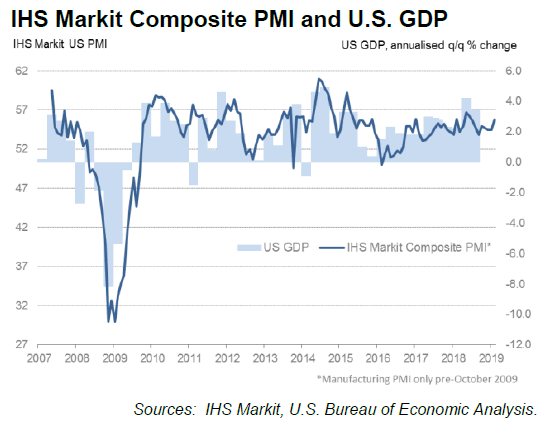
US PMI composite rose to 8-month high, point to 2.5% annualized GDP growth
US PMI manufacturing dropped to 53.7 in February, down from 54.9 and missed expectation of 55.0. That's the lowest in 17 months. PMI services, on the other hand, rose to 56.2, up from 54.2 and beat expectation of 54.3. That's also the highest in 8-month. PMI composite rose to 55.8, up from 54.4, 8-month high.
Commenting on the flash PMI data, Tim Moore, Associate Director at IHS Markit said:
"February data provides a positive signal for first quarter economic growth, with US businesses reporting the fastest output expansion since the middle of 2018. Service sector firms led the way, supported by solid improvements in business and consumer spending. Private sector payroll numbers increased to the greatest extent for five months, which adds to hopes that robust domestic demand will act as a growth tailwind over the near-term.
"Historical comparisons suggest the latest survey data are indicative of an underlying economic growth rate of around 2.5% annualized, although the PMI is designed to monitor private sector companies so the impact of the government shutdown may not be fully captured.
"The main worrying development was the loss of momentum reported by manufacturing companies in February. Businesses that experienced a soft patch for production cited a range of factors holding back growth, including adverse weather, worries about the global economic outlook and ongoing international supply chain uncertainty.
"Nonetheless, relatively strong domestic business conditions mean that US manufacturers remain on a much more positive trajectory than the recent downbeat production trends signalled by IHS Markit's Manufacturing PMI surveys across Europe and Asia."
Also from the US, leading indicator dropped -0.1% in January. Existing home sales dropped to 4.94m annualized rate in January.
AUDJPY Trapped in a Narrow Range, Neutral in the Short-Run
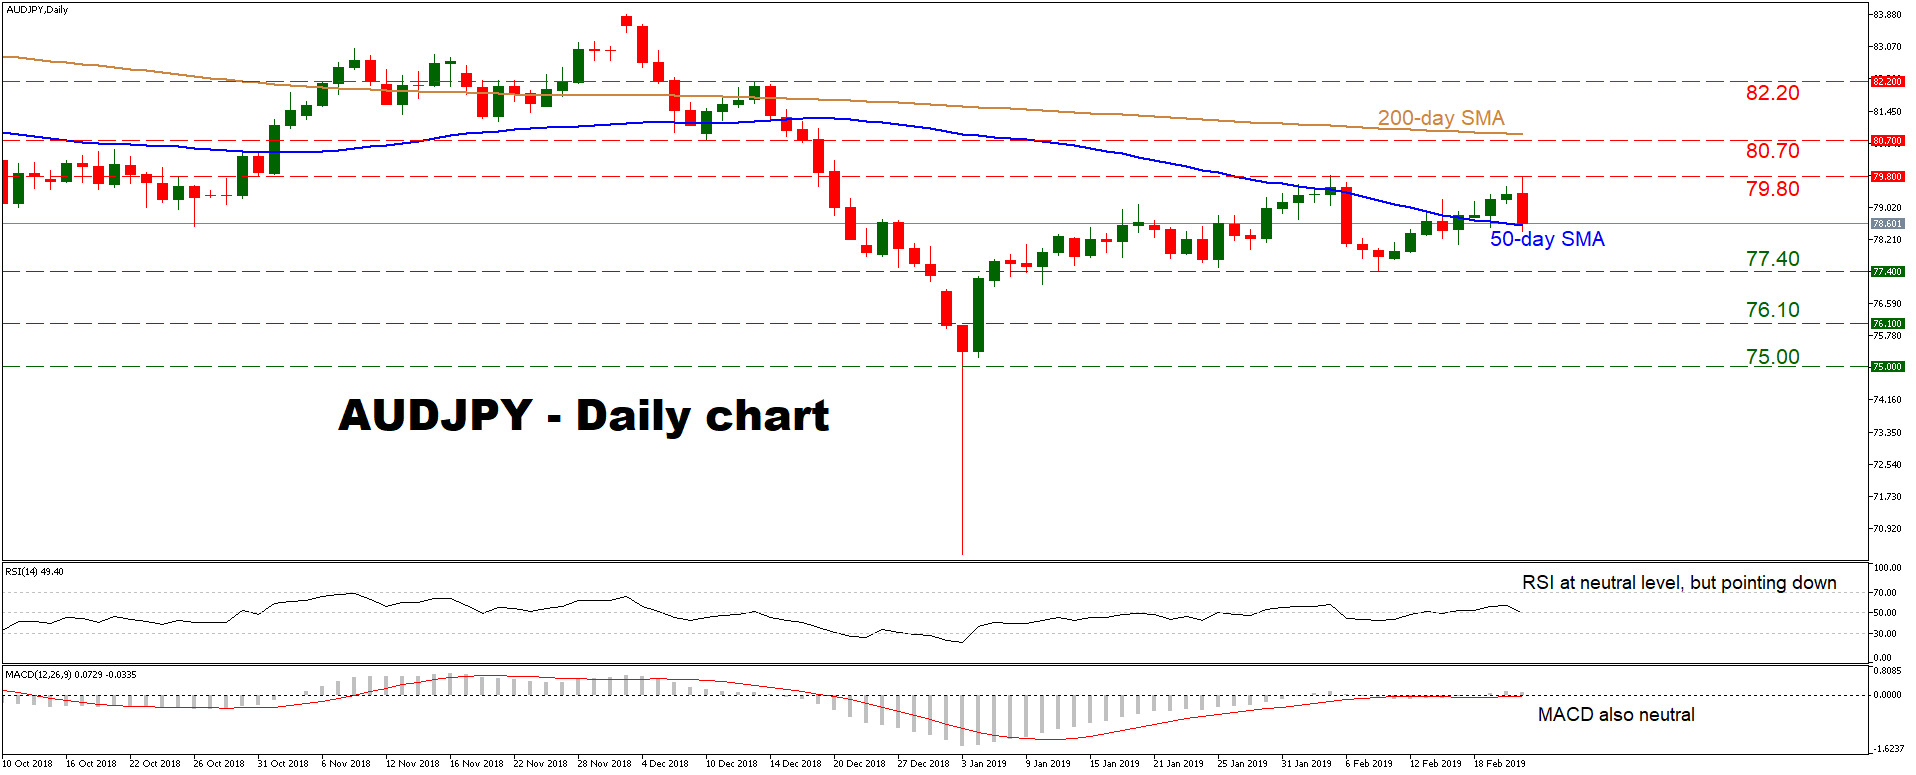
AUDJPY has been stuck in a narrow sideways range, with an upper bound at 79.80 and a lower bound at 77.40, since early January. In light of this, the short-term picture is neutral, with a break on either side of this range needed to provide the broader directional bias.
Both the RSI and the MACD are also hovering near their neutral levels, serving testament to the sideways tendency.
In case of further declines, support may be found near the lower end of the range, at 77.40. If the bears manage to violate that, it would mark a lower low, turning the short-term bias negative and opening the door for a test of 76.10 – a zone marked by the September 2016 lows.
If on the other hand the bulls take the reins, advances could stall initially at 79.80. A clear break above that area would turn the short-term outlook to positive, paving the way for buyers to challenge the crossroads of the 80.70 territory and the 200-day simple moving average (SMA), at 80.85.
In short, the picture is currently neutral, with a break above 79.80 needed to turn it positive, or a move below 77.40 to shift it to negative.
Silver Eases Below 7-Month High; Bullish in Near Term
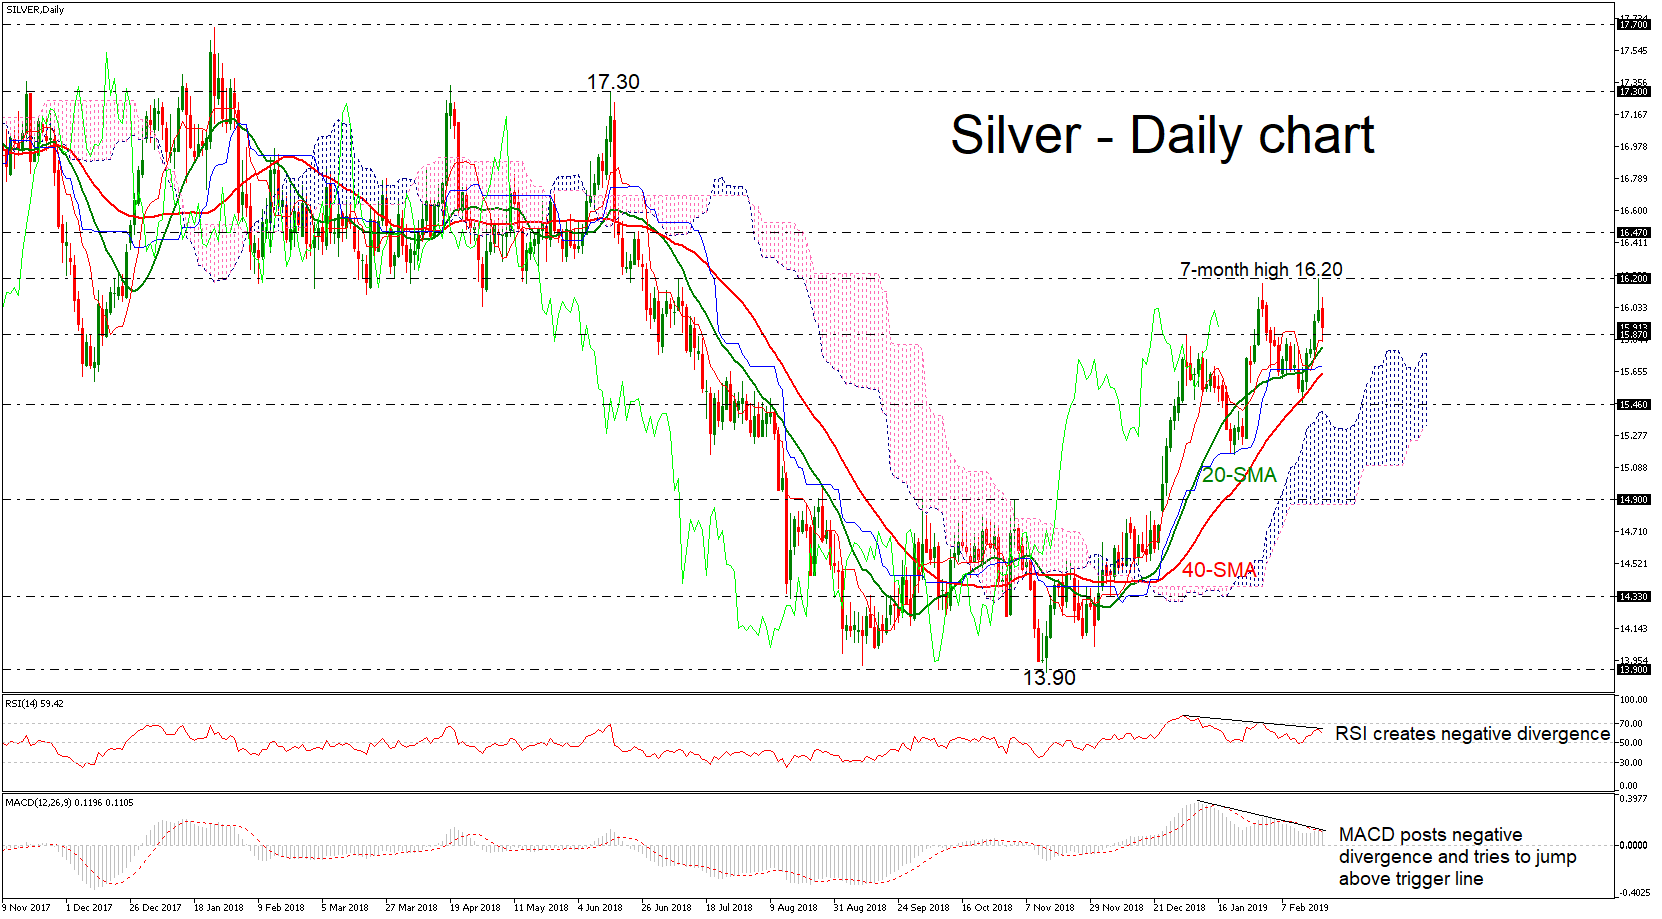
Silver retreated after jumping towards a new seven-month high of 16.20 during Wednesday’s session. The bullish picture in the very short-term looks to last for a while longer as prices remain above the 20- and 40-simple moving averages (SMAs). Also, the price failed to slip below the red Tenkan-sen line and is holding above the Ichimoku cloud.
Technically, in the daily timeframe, the RSI lies in positive area and is falling, however the MACD oscillator printed a bullish cross with its trigger line in the positive area as well. Both indicators are creating a negative divergence as the price is rising and the indexes are declining, signaling a possible weak movement.
In case of a continuation of the bullish move, traders could break the 16.20 resistance and send prices towards the 16.47 barrier. More advances could drive the market to the next stop which stands even high at 17.30, where it topped on June 14.
Alternatively, additional declines may drive the price towards the 20-day simple moving average (SMA) around 15.80 at the time of writing, before the price touches the 40-day SMA around 15.65. Beneath the latter, 15.46 could be another level in focus as well as the bottom of the lower band of the Ichimoku cloud near the 14.90 support.
Summarizing, in the long-term view, the white metal has remained in a downtrend since July 2016, without a significant bullish correction.
Japan 225 Stock Index Stands Tall at 9-Week Highs
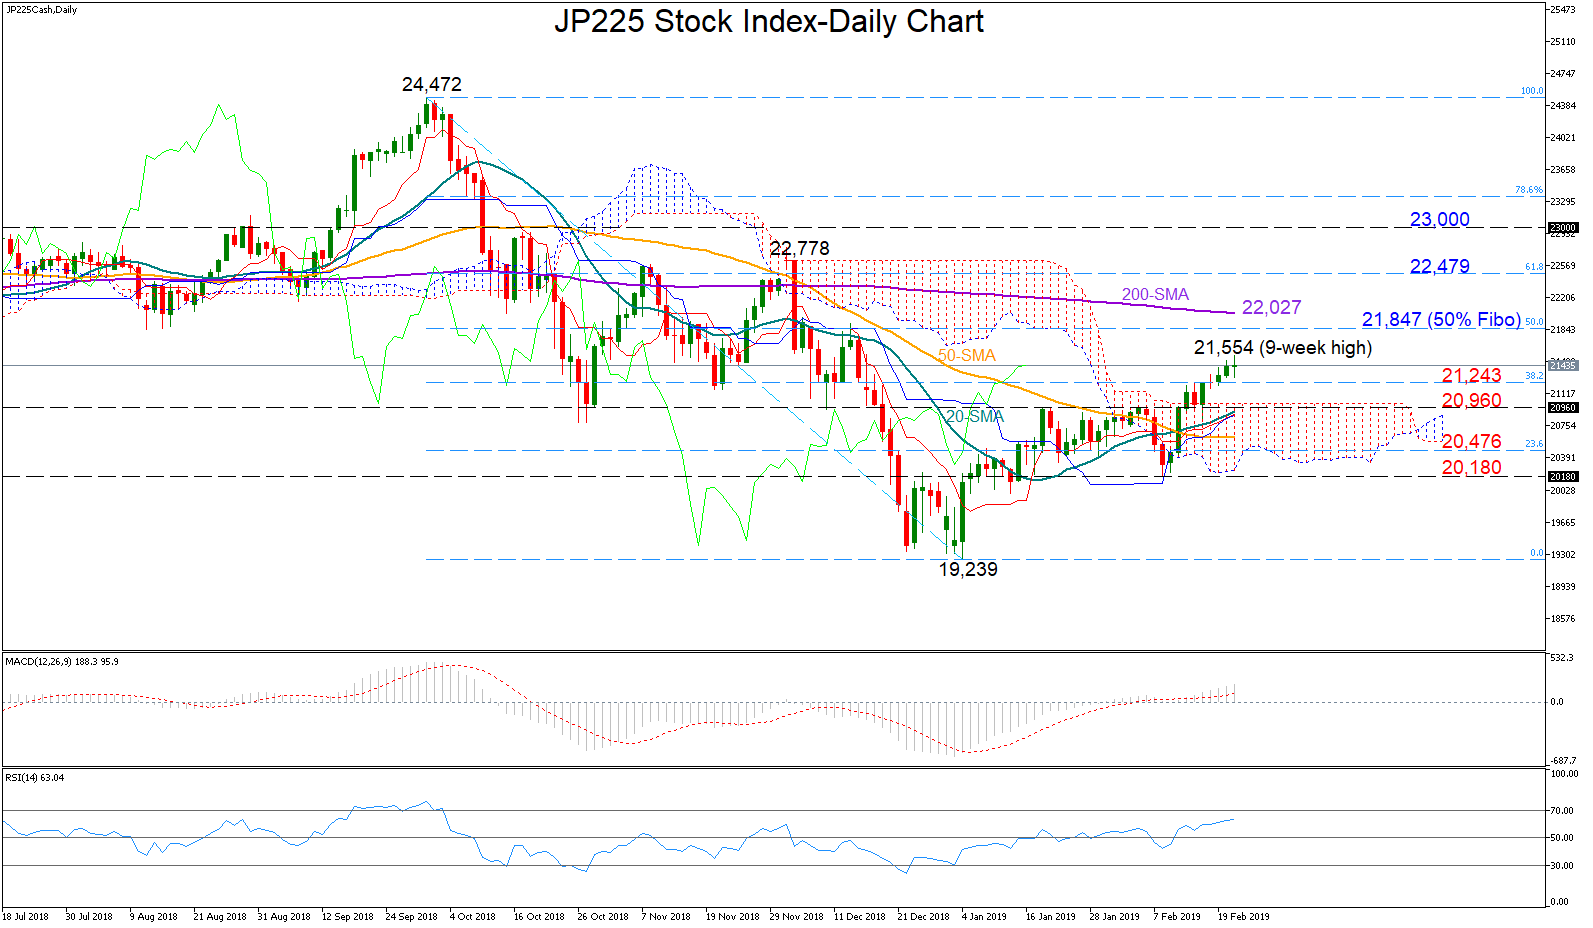
Japan’s 225 stock index has staged a 5% rise over the past two weeks to jump above the Ichimoku cloud and reach a nine-week high of 21,554 today. The MACD keeps stretching higher and above its red signal line, spreading hopes that there are more gains in store. The RSI is also in bullish territory (above 50) but seems to be losing steam, a sign that caution may soon return to the market.
If the rally continues, the 50% Fibonacci of 21,847 of the downleg from 24,472 to 19,239 could halt upside movements ahead of the 200-day moving average at 22,027. A significant step above the latter could reach the 61.8% Fibonacci of 22,479, while even higher a stronger resistance could be found near 23,000.
Moving south, the 38.2% Fibonacci of 21,243 could act as support as it did in previous sessions. Slightly lower the bears may find a wall near 20,960 before the 23.6% Fibonacci of 20,476 comes on the radar. If selling pressure strengthens even further, 20,180 could be the next level to watch.
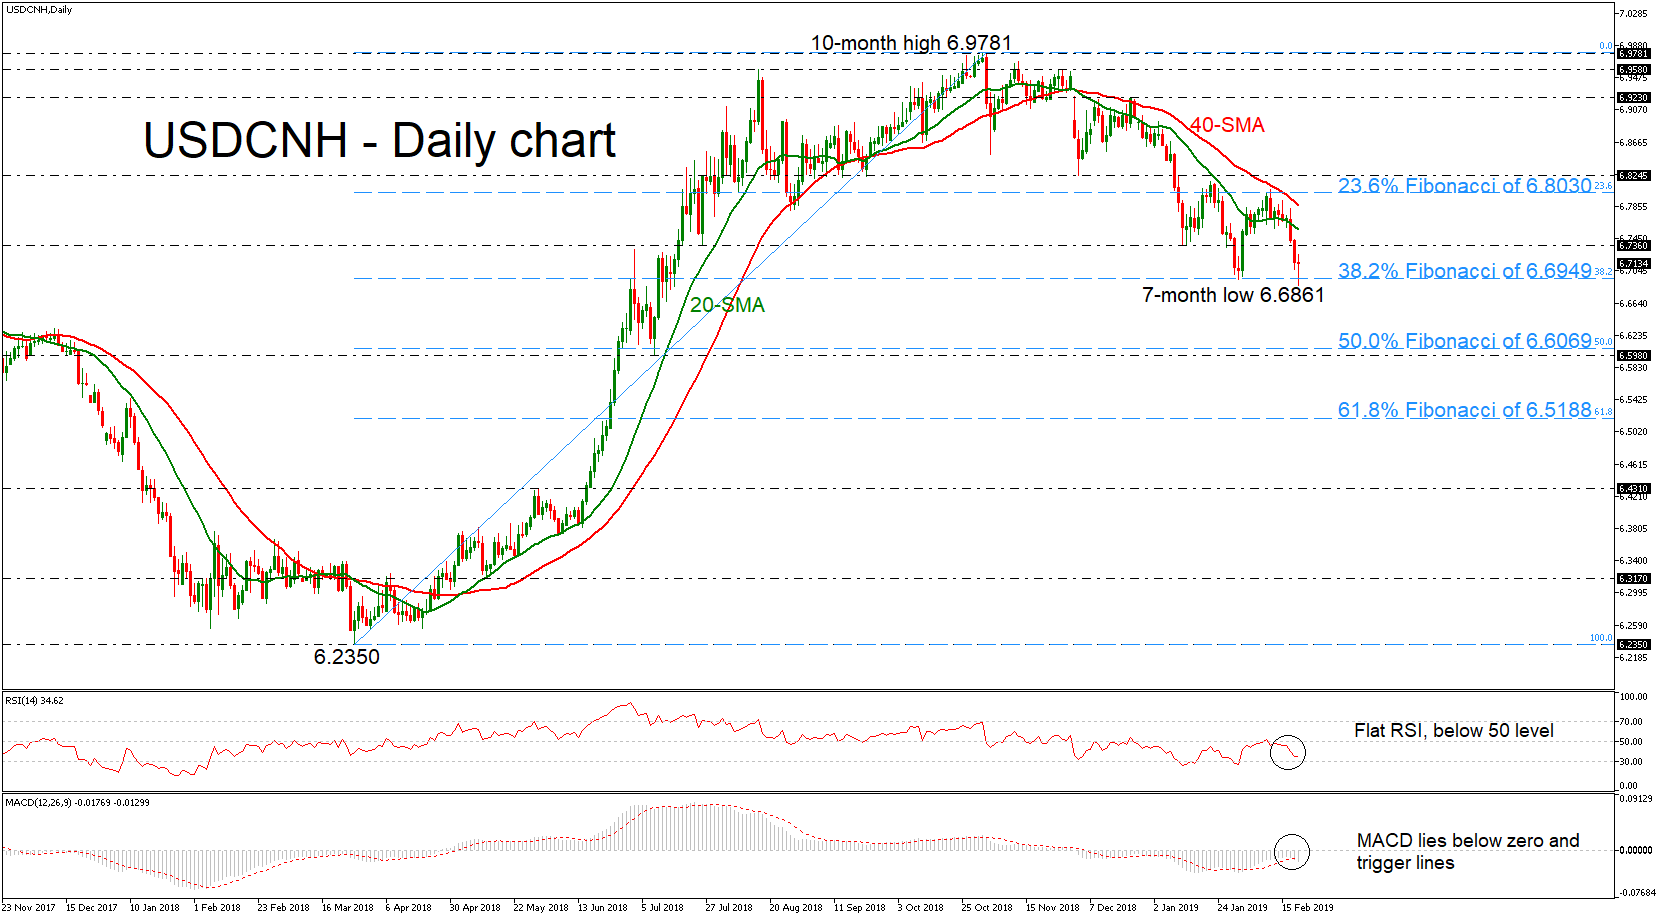
USDCNH Touches 7-Month Low; Turns Negative after Bouncing Off 10-Month High
USDCNH had a strong bearish start on Thursday, with the price falling below a crucial support of the 38.2%Fibonacci retracement level of the upleg from 6.2350 to 6.9781, near 6.6949, creating a fresh seven-month low of 6.6861.
From the technical point of view, the RSI is flattening in bearish territory, while the MACD also supports a bearish picture, since it continues to hold beneath the zero line and trigger lines.
Should prices drop below the seven-month low, they could hit the support area between6.5980 – 6.6061, which encapsulates the 50.0% Fibonacci region. An extension of the bearish structure would open the way towards the 61.8% Fibonacci of 6.5188.
If the market manages to pick up speed, the 6.7360 resistance and the 20-day simple moving average (SMA), currently at 6.7553 could offer nearby resistance ahead of the 40-day SMA, which stands near 6.7854. Slightly above this line, the 23.6% Fibonacci of 6.8030 could act as strong resistance as well before turning the focus at the 6.8245 barrier.
In the medium-term, the outlook remains negative since prices hold below all the moving average lines and have been creating lower lows and lower highs following the pullback from the 10-month high of 6.9781.