Sample Category Title
USD/CAD Likely To Decline
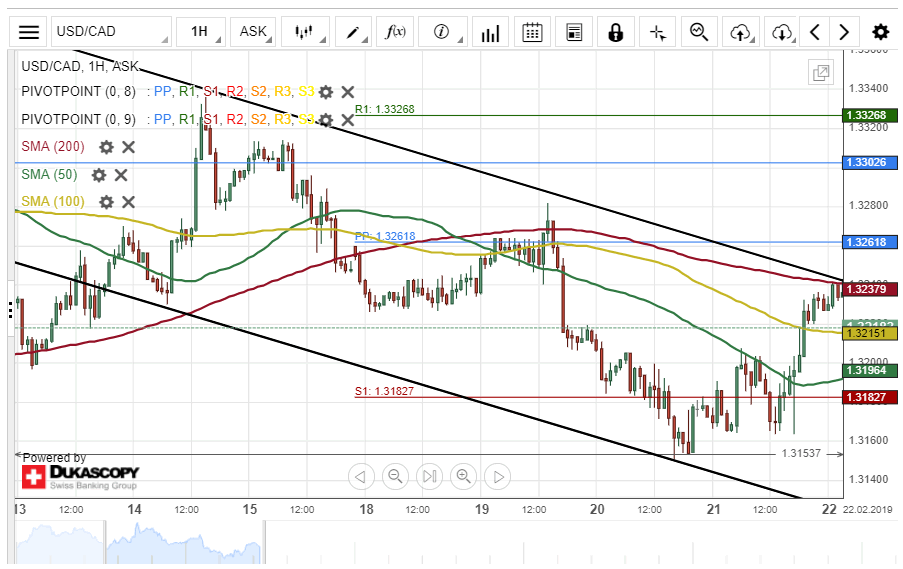
The US Dollar appreciated about 78 base points against the Canadian Dollar on Thursday. The surged was stopped by a resistance level formed by the 200-hour simple moving average at 1.3238.
As for the near future, it is likely that the currency exchange rate will edge lower towards a support level at 1.3182.
A potential upside movement could be expected from the support level as mentioned above.
However, technical indicators demonstrate that the USD/CAD exchange rate will end this week's trading session with a decline.
NZD/USD Bounces Off Support Level
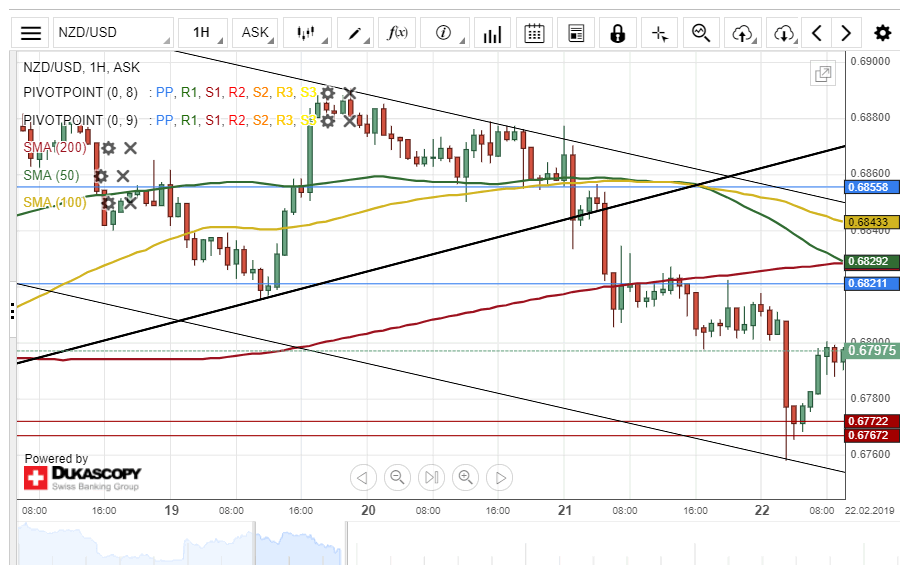
The New Zealand Dollar depreciated about 118 base points against the US Dollar on Thursday. The currency pair revealed a new junior descending channel pattern during yesterday's trading session.
The exchange rate bounced off the bottom border of the channel pattern at 0.6760 during the Asian trading session on Friday.
Everything being equal, it is likely that bullish traders could target a resistance cluster formed by the combination of the weekly and the monthly PPs near the 0.6816 area.
A potential downside movement is likely to occur, if the cluster holds within this session.
EUR/USD Is Supported By 100-Hour SMA
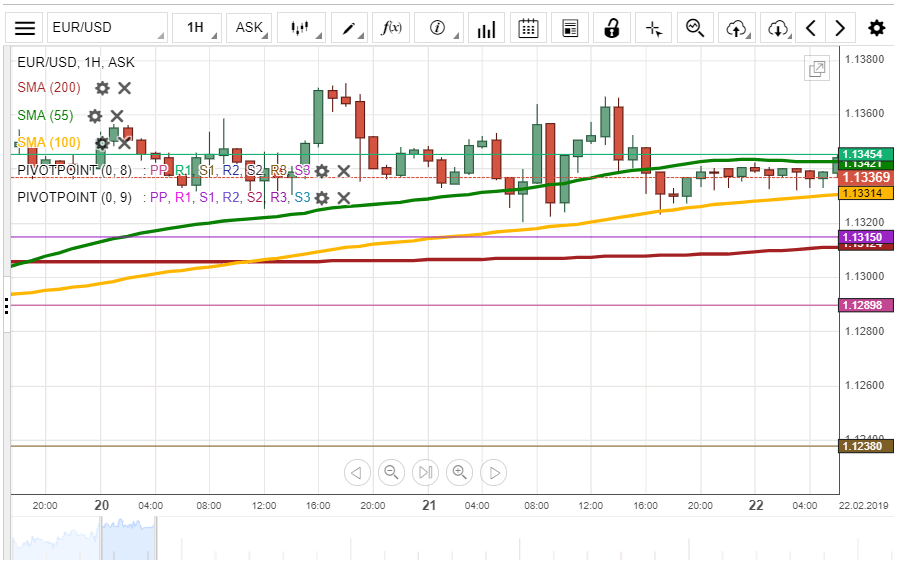
On Friday, the European Single Currency was trading between the 55-hour and the 100-hour simple moving average at the 1,1340 mark.
In regards to the near-term future, most likely, the 100-hour simple moving average will support the rate to push it to the 1,1360 level.
On the other hand, the resistance level of the weekly R1 at 1,1345 could resist the currency exchange rate to pass through the SMAs to the 1,1300 level.
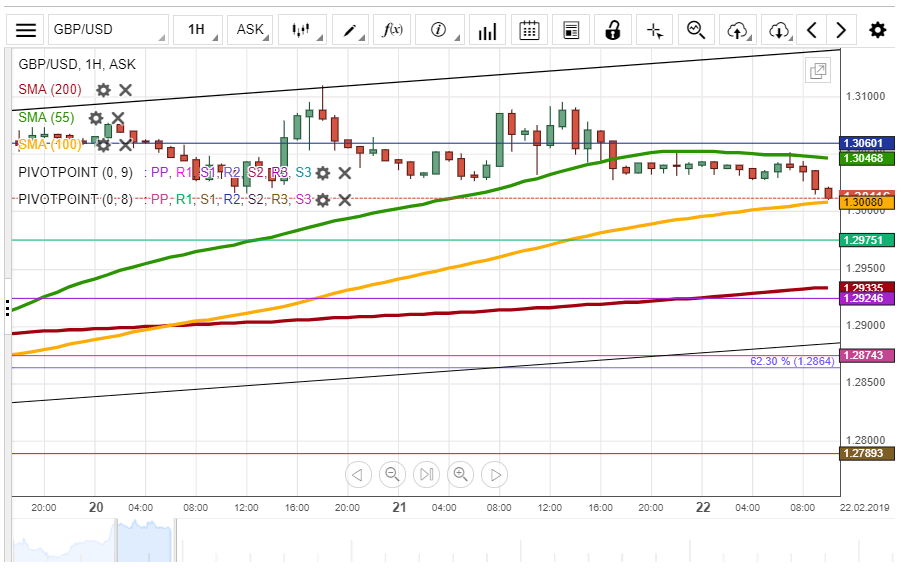
GBP/USD Surges To 1,3100
During the previous trading session, the rate passed through the 55-hour simple moving average to end the trading session at the 1,3000 as it was expected. On Friday morning, the British Pound was trading between the 55-hour and the 100-hour simple moving averages at the 1,3022 mark.
In regards to the near-term future, most likely, the currency exchange rate will get the support of the 100-hour SMA to surge towards the resistance of the weekly R2 at 1,3060.
On the other hand, the 55-hour simple moving average could resist the British Pound to push the rate to trade sideways at the 1,3000 level.
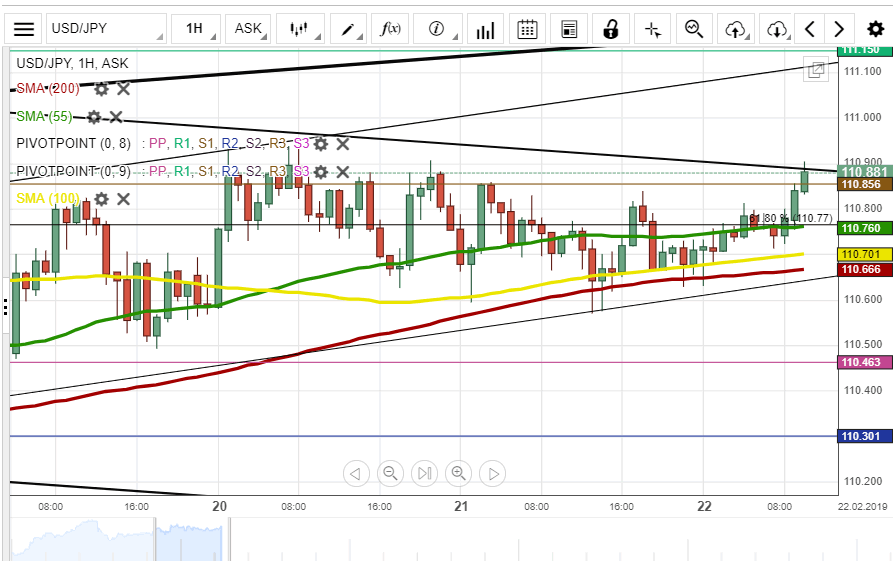
USD/JPY Will Squeeze To Break-Out
During the previous trading session, the currency exchange rate was trading sideways below the 61,80% Fibo at 110.60. On Friday morning, the rate was located at the 110.87 mark.
In regards to the near-term future, most likely, the US Dollar will bounce off the upper boundary of the freshly drawn medium pattern line at 110.90 to trade sideways during the trading session.
On the other hand, the rate could break the resistance of the freshly drawn medium pattern line at 110.90 to trade at the 111.00 level.
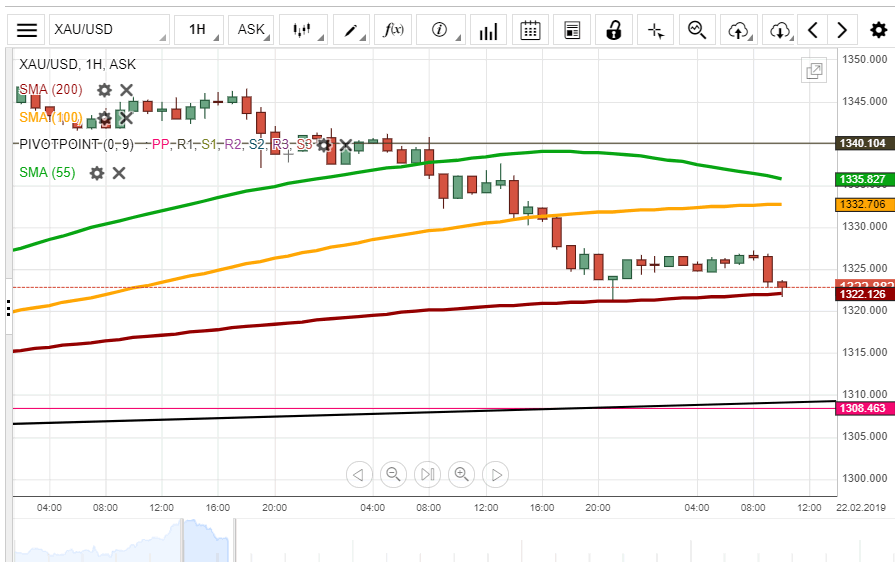
XAU/USD Passes Small Pattern Line
During the previous trading session, the yellow metal depreciated against the US Dollar by 1529 pips or 1.14%. On Friday morning, the rate was supported by the 200-hour simple moving average at the 1,322.12 mark.
In regards to the near-term future, most likely, the 200-hour simple moving average will keep supporting the rate during the day. It is expected that the rate will stay at the 1,325.00 level.
However, the gold could pass through the 200-hour simple moving average at 1322.12 to depreciate towards the medium pattern line at the 1,310.00 level.
The Analytical Overview Of The Main Currency Pairs
The EUR/USD currency pair
Technical indicators of the currency pair:
Prev Open: 1.13362
Open: 1.13330
% chg. over the last day: +0.02
Day's range: 1.13301 – 1.13492
52 wk range: 1.1214 – 1.2557
USD index (#DX) keeps recovering. The investors are waiting for additional drivers. Yesterday the US published ambigous economic reports. At the same time, the American currency was supported by the growth of the 10-year government bonds yield to the weekly maximum. The negotations between the Washington and Beijing remain in the spotlight. Keep an eye on this issue and open positions from the key levels of 1.13250-1.13500.
The Economic News Feed for 22.02.2019:
IFO Business Index (GER) – 11:00 (GMT+2:00);
Consumer Price Index (EU) – 12:00 (GMT+2:00);
Federal Reserve Monetary Policy Report (US) – 18:00 (GMT+2:00);
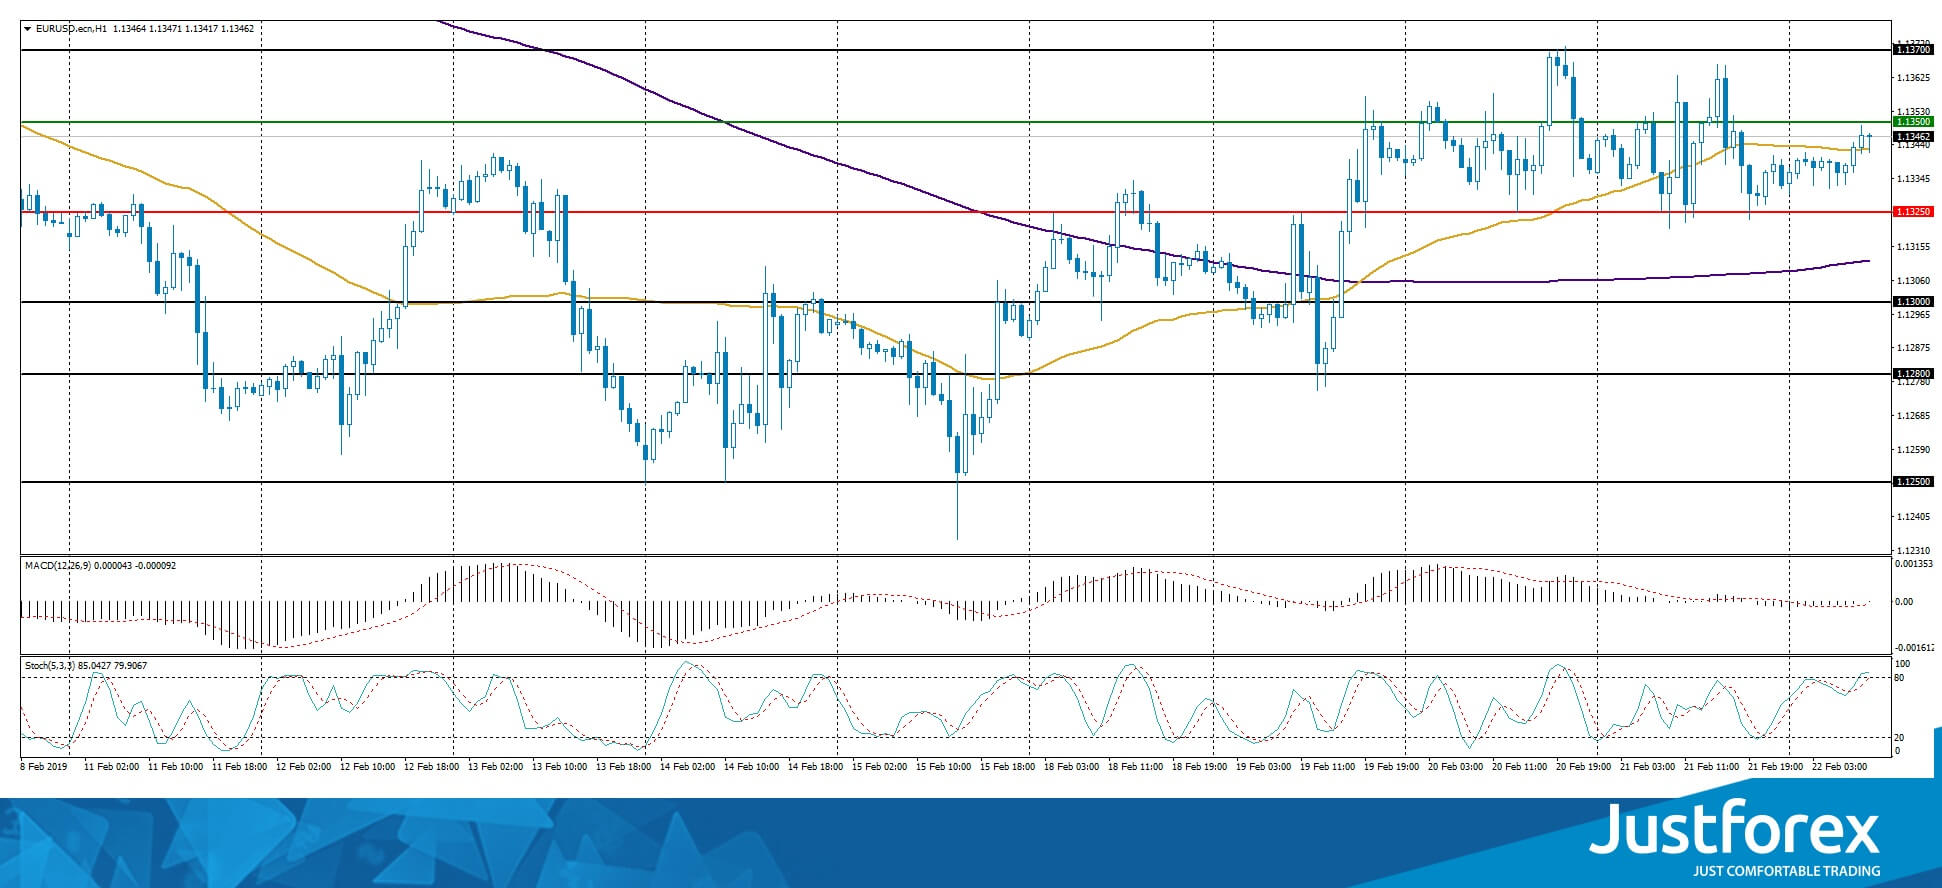
Indincators do not provide precise data, the price has crossed 50 MA.
The MACD histogram is close to 0.
The Stochastic Oscillator is near the overbought zone, the %K line is above the %D line, which gives a weak signal to buy EUR/USD.
Trading recommendations
Support levels: 1.13250, 1.13000, 1.12800
Resistance levels: 1.13500, 1.13700, 1.14000
If the price fixes above 1.13500, expect the quotes to grow toward 1.13700-1.14000.
Alternatively, the quotes can fall toward 1.13000-1.12800.
The GBP/USD currency pair
Technical indicators of the currency pair:
Prev Open: 1.30503
Open: 1.30251
% chg. over the last day: -0.08
Day's range: 1.30244 – 1.30513
52 wk range: 1.2438 – 1.4378
GBP/USD keeps being traded in a flat. There is no single defined trend. The ambiguousness around Brexit remains, which puts addtional pressure on the GBP. Keep an eye on the relevant data on this subject. The local support and resistance levels are 1.30250 and 1.30750. You should open positions from these levels.
The Economic News Feed for 22.02.2019 is calm.
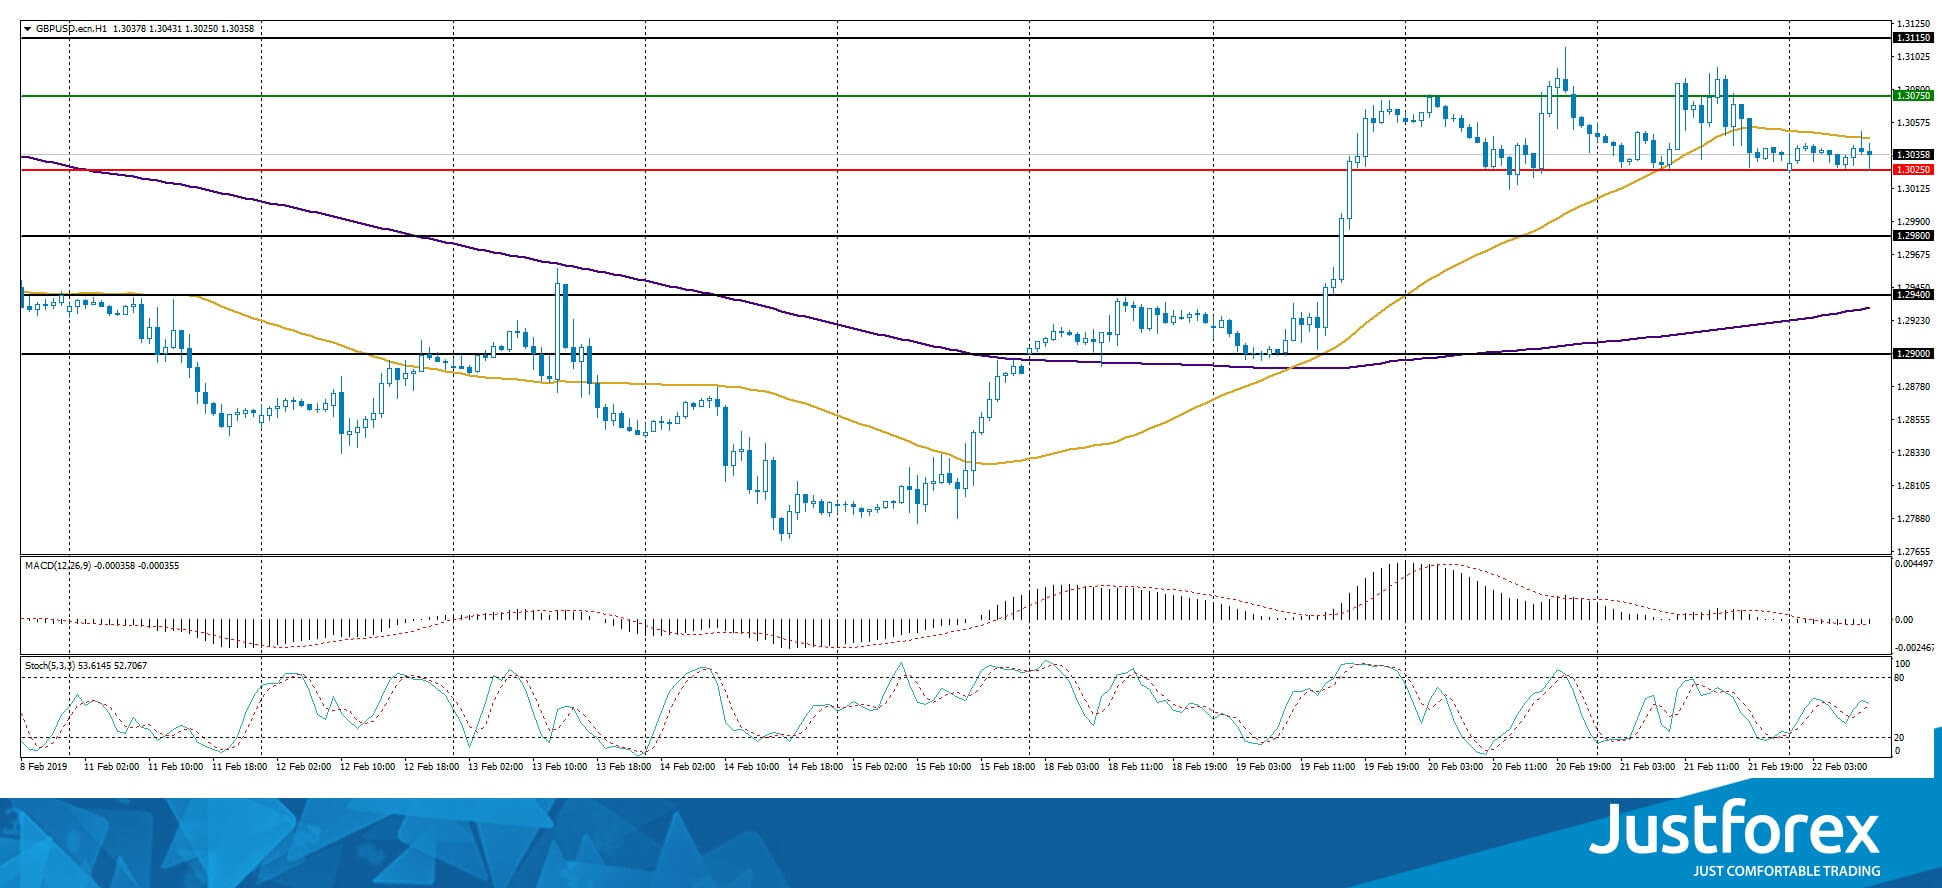
The indicators do not provide precise signals, the price has crossed 50 MA.
The MACD histogram is close to 0.
The Stochastic Oscillator is in the neutral zone, the %K line is crossing the %D line. There are no signals at the moment.
Trading recommendations
Support levels: 1.30250, 1.29800, 1.29400
Resistance levels: 1.30750, 1.31150, 1.31500
If the price fixes above 1.30750, expect the quotes to grow toward 1.31150-1.31400.
Alternatively, the quotes can correct toward 1.29800-1.28600.
The USD/CAD currency pair
Technical indicators of the currency pair:
Prev Open: 1.31752
Open: 1.32252
% chg. over the last day: +0.38
Day's range: 1.32160 – 1.32419
52 wk range: 1.2248 – 1.3664
Yesterday USD/CAD quotes retreated from the local minimums. The CAD is consolidating around 1.32100-1.32400 with an ambiguous technical picture. The investors are waiting for the retail sales report from Canada. Keep an eye on the oil quotes dynamics. You should open positions from the key levels.
The Economic News Feed for 22.02.2019:
Retail Sales Report (CAD) – 15:30 (GMT+2:00);
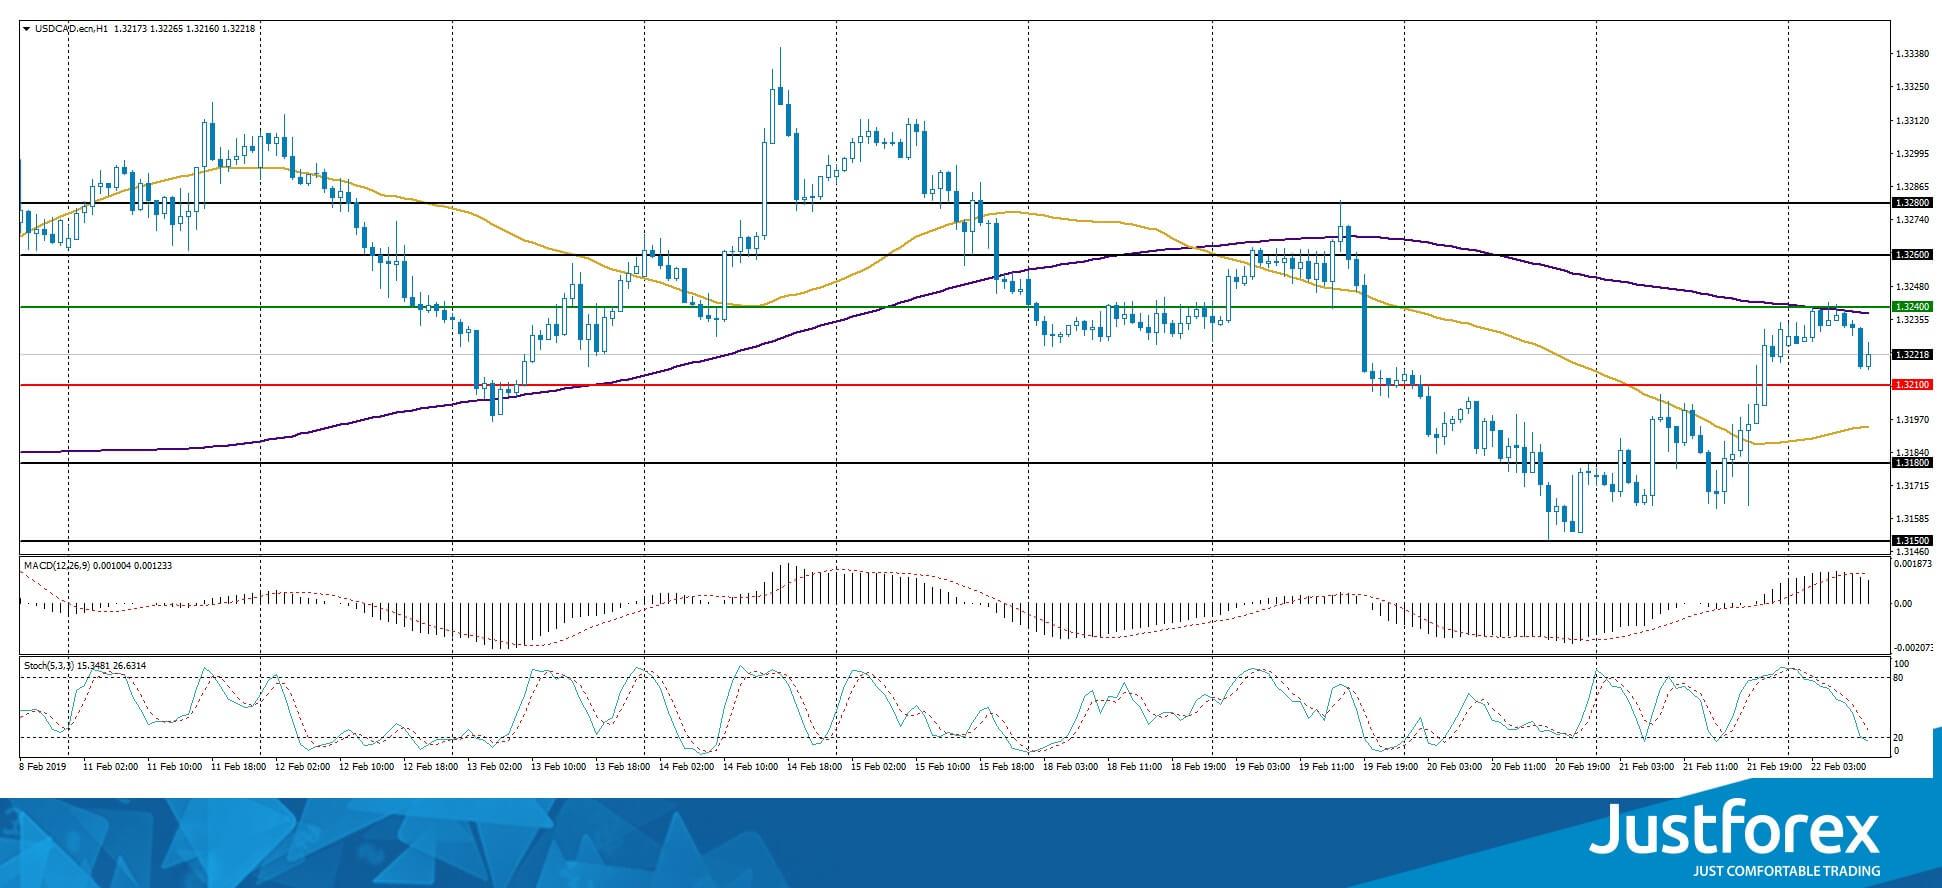
The indicators do not provide precise signals, the price fixed between 50 MA and 200 MA.
The MACD histogram is in the positive zone but below the signal line, which gives a weak signal to buy USD/CAD.
The Stochastic Oscillator is in the neutral zone, the %K line is below the %D line, which points to a bearish mood.
Trading recommendations
Support levels: 1.2248 – 1.3664
Resistance levels: 1.32400, 1.32600, 1.32800
If the price fixes below 1.32100, look for the market entry points to open short positions. The movement will tend toward 1.31800-1.31600.
Alternatively, the quotes can grow toward 1.32600-1.32800.
The USD/JPY currency pair
Technical indicators of the currency pair:
Prev Open: 110.828
Open: 110.689
% chg. over the last day: -0.14
Day's range: 110.620 – 110.808
52 wk range: 104.56 – 114.56
The safe haven currency keeps trading in a long flat. The technical picture is ambiguous. The USD/JPY quotes are testing the local support and resistance levels at 110.650 and 110.900. Keep an eye on the US Treasury bonds yield. The financial market participants are waiting for news on the US/China trading negotiations.
In January, Japanese national basis index of consumer prices confirmed the forecasts and reached 0.8%
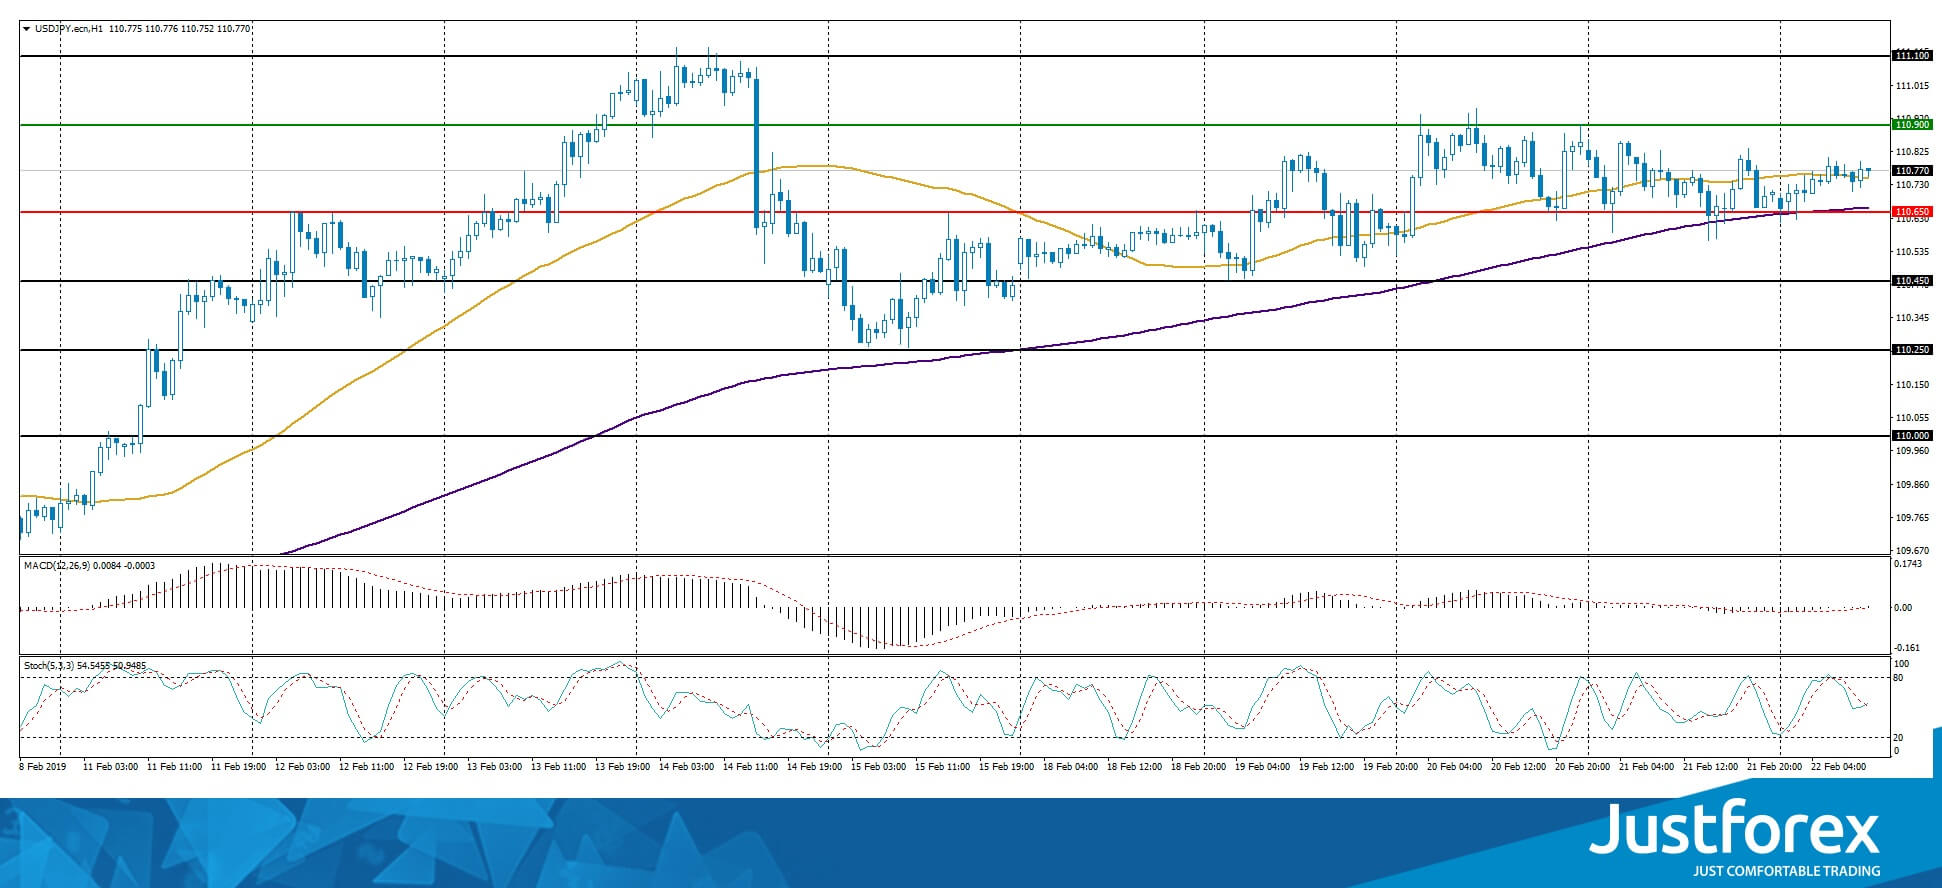
The indicators do not provide precise data, the price has crossed 50 MA and 200 MA.
The MACD histogram is close to 0.
The Stochastic Oscillator is in the neutral zone, the %K line is crossing the %D line. There are no signals at the moment.
Trading recommendations
Support levels: 110.650, 110.450, 110.250
Resistance levels: 110.900, 111.100, 111.500
If the price fixes below the support level of 110.650, expect the quotes to rise toward 110.400-110.200.
Alternatively, the quotes can grow toward 111.100-111.400.
Majors Are Consolidating. Investors Expect Additional Drivers
The US dollar is moving without a clear dynamic against the basket of major currencies. Yesterday, the dollar index (#DX) closed the trading session with a slight increase (+0.18%). The United States has published ambiguous statistics. Core durable goods orders rose by 0.1% in December instead of 0.2%. Philadelphia Fed manufacturing index declined significantly in February and counted to -4.1, while investors expected growth to 15.6. Existing home sales counted to 4.94M in January and were worse than market expectations at the level of 5.01M. At the same time, the American currency was supported by the growth in the US government bonds yield to a weekly maximum.
The ECB monetary policy meeting account did not have a significant impact on the euro. Regulator considers the possibility of launching the next round of targeted longer-term refinancing operations (TLTRO) for Eurozone banks. This means a likely increase in stimulation in the Eurozone. The regulator wants to sum whether the slowdown in economic growth in the Eurozone is enough to require the launch of a new round of TLTRO.
The British pound is being traded near monthly highs against the US dollar. Yesterday, European Commission President, Jean-Claude Juncker, said that he was not optimistic about the negotiations with the UK about avoiding the “tough” Brexit. It also became known that the country would not have time before March 29, the date of Brexit, to conclude new agreements on the conditions of cooperation with many countries outside the EU, which would significantly complicate Britain’s trade relations with partners.
The "black gold" prices became stable. At the moment, futures for the WTI crude oil are testing the mark of $57.10 per barrel. At 20:00 (GMT+2:00), a report on the US Baker Hughes total rig count will be published.
Market Indicators
- Yesterday, the bearish sentiment was observed in the US stock market: #SPY (-0.36%), #DIA (-0.37%), #QQQ (-0.37%).
- The 10-year US government bonds yield has been growing. Currently, the indicator is at the level of 2.68-2.69%.
The news feed on 22.02.2019:
- German IFO business climate index at 11:00 (GMT+2:00);
- Consumer price index in the Eurozone at 12:00 (GMT+2:00);
- Statistics on retail sales in Canada at 15:30 (GMT+2:00);
- Fed monetary policy report at 18:00 (GMT+2:00).
Gold ETFs Reducing Their Holdings
Fundamental Analysis
Looking at the ETF data, SPDR gold shares, the biggest-metals ETF, it becomes clear that the demand is still somewhat weak because the holdings of gold have gone down by 160,614 ounces. However, investors are increasing their holdings in other metals such as silver and platinum, both up by 117,343 and 18,003 troy ounces respectively.
Gold prices are likely to remain sensitive due to the ongoing trade war negotiations between the US and China. We are expecting higher volatility this afternoon when Trump will meet China’s top trade negotiator. Any strong optimism for an accord between the two superpowers is likely to restore confidence in the equity markets and this may push the price of gold a little lower.
Technical Analysis
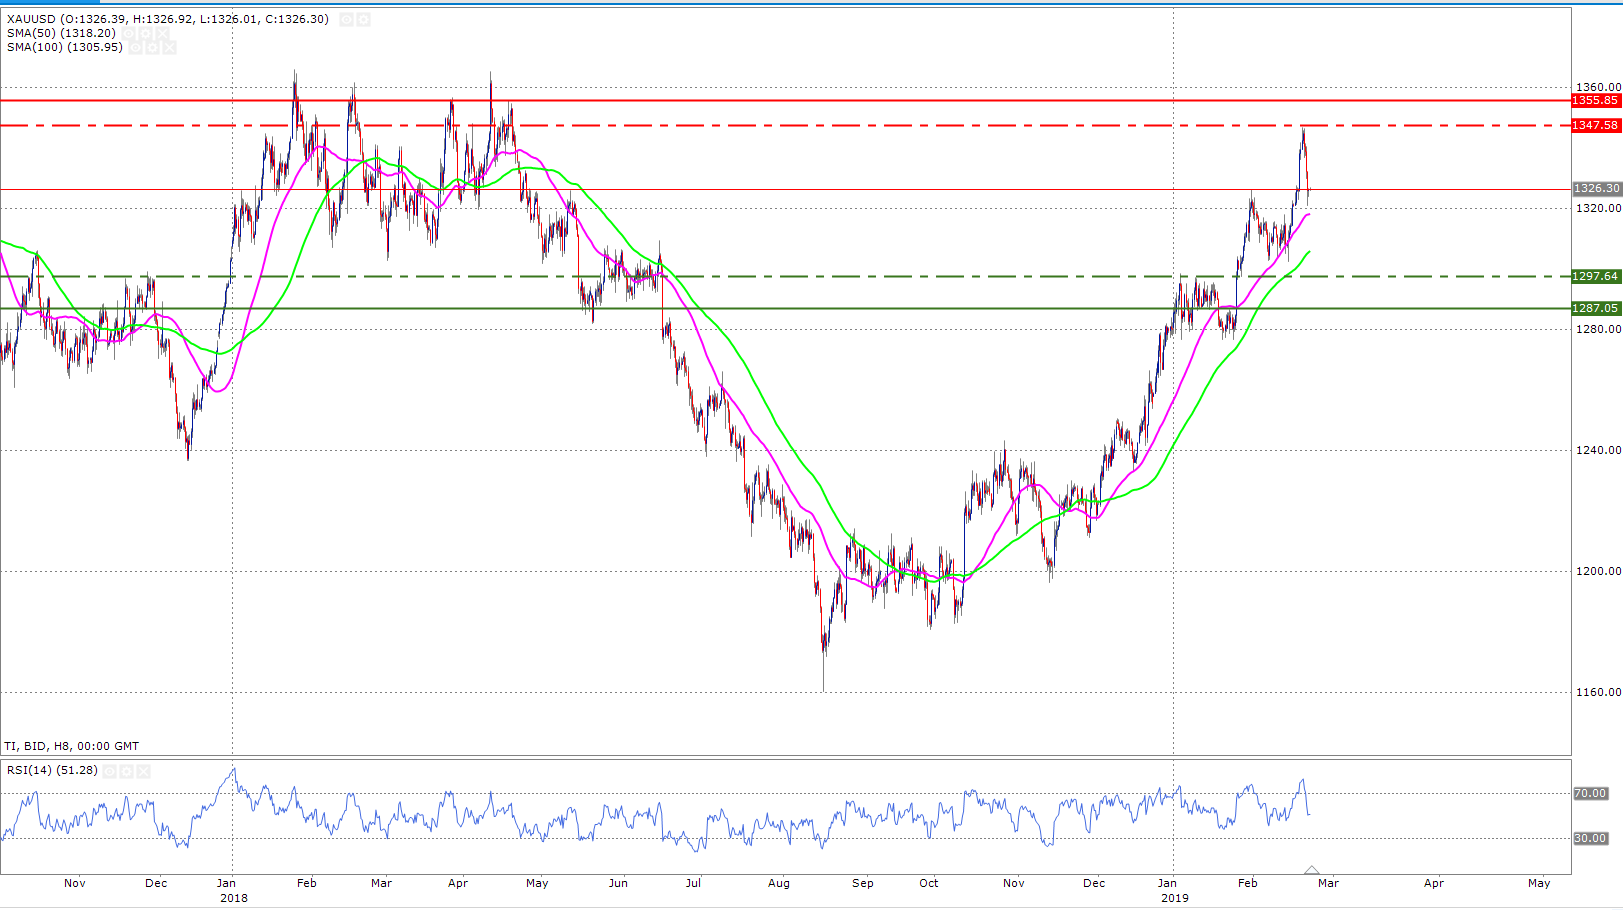
In terms of technical analysis, the RSI has eased off from its oversold region and this indicates that buyers may step in soon if the selling pressure continues at this pace. A reading near 30-mark represents a buying opportunity because the price is considered as oversold and it attracts new buyers. In terms of trend, the uptrend is still strongly intact because the price is still trading above the upward trend line. Also, the 50-day and 100-day moving averages are also below the price and this further strengthens the above argument.
The minor support is shown by the horizontal dotted line and the major by solid line. Similarly, the minor resistance is shown by the dotted line and major by solid.
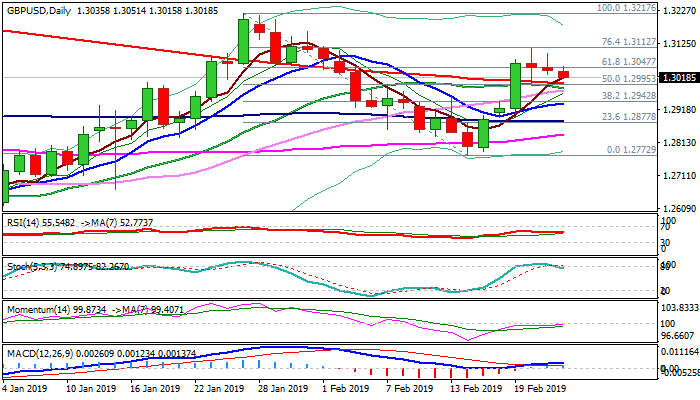
GBP/USD Outlook: Holding Above 200SMA Minimizes Risk Of Deeper Pullback
Strong indecision, signaled by Wednesday's spinning top and subsequent Doji on Thursday, so far did not result in more significant weakness, as dips hold above broken 100SMA (1.3000).
Near-term price action remains supported by strengthening momentum, which attempts to break into positive territory and daily MA's holding in bullish setup.
On the other side, daily stochastic reverses from overbought territory and weighs.
Positive signals come from weekly chart as the pair is on track for strong bullish weekly close and completion of hammer reversal pattern that underpins the action.
Bullish bias is expected to remain intact while the price holds above 200SMA, with initial positive signal expected on weekly close above it.
Weekly close above cracked 1.3047 Fibo barrier (61.8% of 1.3217/1.2772) would reinforce bullish signals and keep focus at 1.3217 peak (25 Jan).
Conversely, break and close below 200SMA on Friday would weaken near-term structure and risk deeper pullback.
Res: 1.3047, 1.3094, 1.3112, 1.3160
Sup: 1.3000, 1.2977, 1.2936, 1.2882