Sample Category Title
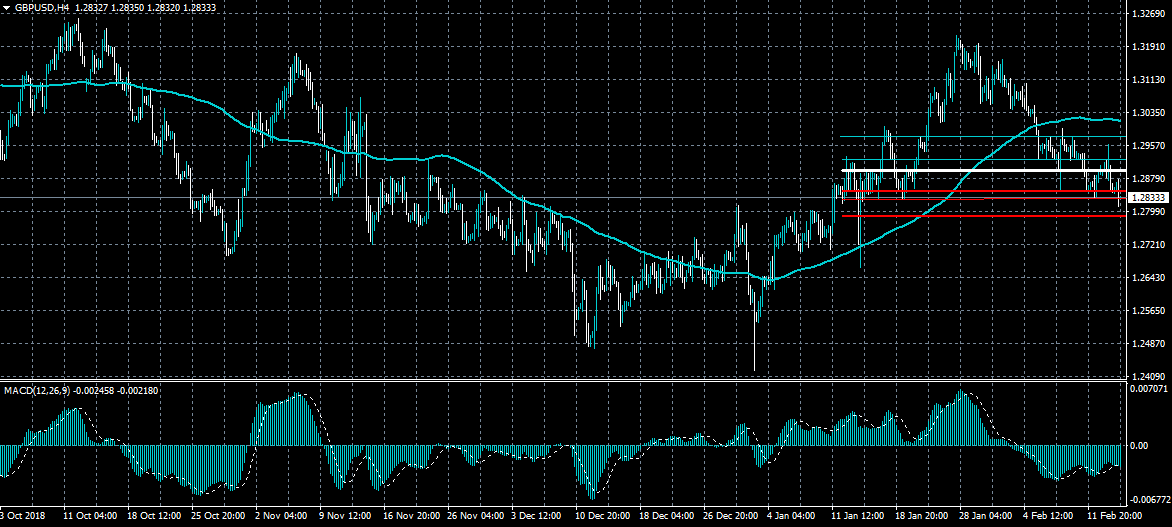
GBPUSD Heavily Bearish Below 1.2790
The British pound has continued to slide lower against the US dollar during the European trading session, as sentiment towards the pair turns increasingly negative. The GBPUSD pair is testing towards the 1.2800 support region, with a move below the 1.2790 level likely to accelerate technical selling towards the 1.2740 support level. Buyers need to move price back above the 1.2930 level to negate the bearish sentiment surrounding the pair in the short-term.
The GBPUSD pair bearish while trading below the 1.2790 level, key technical support is found at the 1.2740 and 1.2710 levels
If the GBPUSD pair moves above the 1.2880 level, buyers may test towards the 1.2900 and 1.2930 levels.
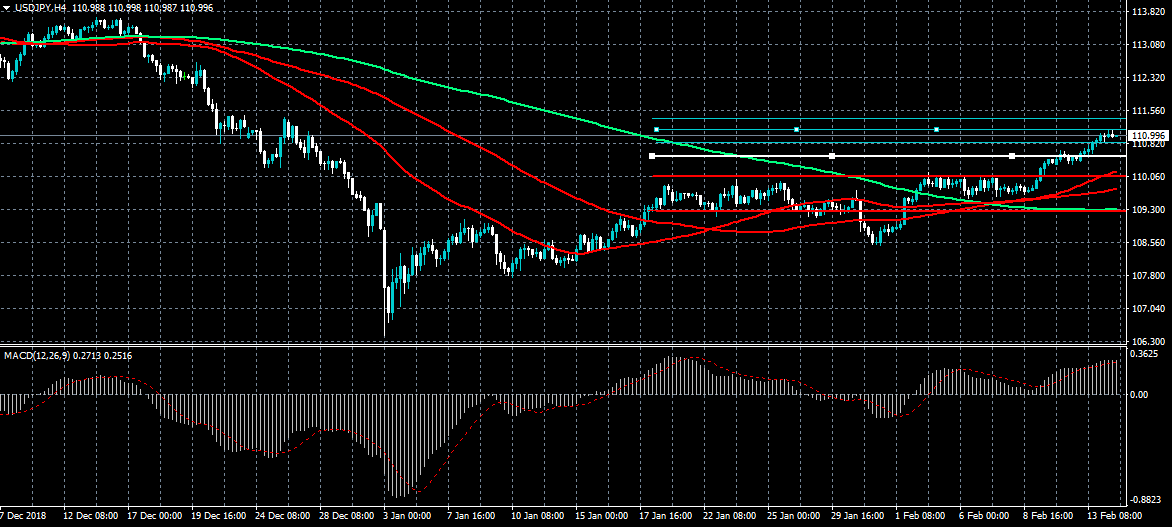
USDJPY Bullish Bias Still Intact
The US dollar has continued to move higher against the Japanese yen during the European trading session, with the risk-sensitive pair finding interim resistance from the 111.10 level. Technical indicators are still rising on the four-hour time frame, while the US dollar index retains a strong intraday bullish bias. The USDJPY pair is likely to be driven by any news coming from trade negotiations between US and Chinese negotiators.
The USDJPY pair is strongly bullish while trading above the 110.80 level, key technical resistance remains at the 111.10 and 111.40 levels.
If the USDJPY pair moves below the 110.80 level, sellers may test towards the 110.40 and 110.00 support levels.
The Analytical Overview Of The Main Currency Pairs
The EUR/USD currency pair
Technical indicators of the currency pair:
Prev Open: 1.13249
Open: 1.12602
% chg. over the last day: -0.53
Day's range: 1.12490 – 1.12948
52 wk range: 1.1214 – 1.2557
The EUR started to descend. Yesterday the quotes fell by 70 points. The trading instrument updated the new monthly minimums. The pressure on EUR is cause by the weak economic reports, the loss of profitability of the Germany government bonds and a high demand for USD. Right now the currency pair is testing the 1.12500 support. 1.12850 acts as the resistance. Keep an eye on the US/China negotiations and open positions from the key levels.
The Economic News Feed for 14.02.2019:
GDP report (EU) – 12:00 (GMT+2:00);
Retail Sales report (US) – 15:30 (GMT+2:00);
Manufacturer's Price Index (US) – 15:30 (GMT+2:00);
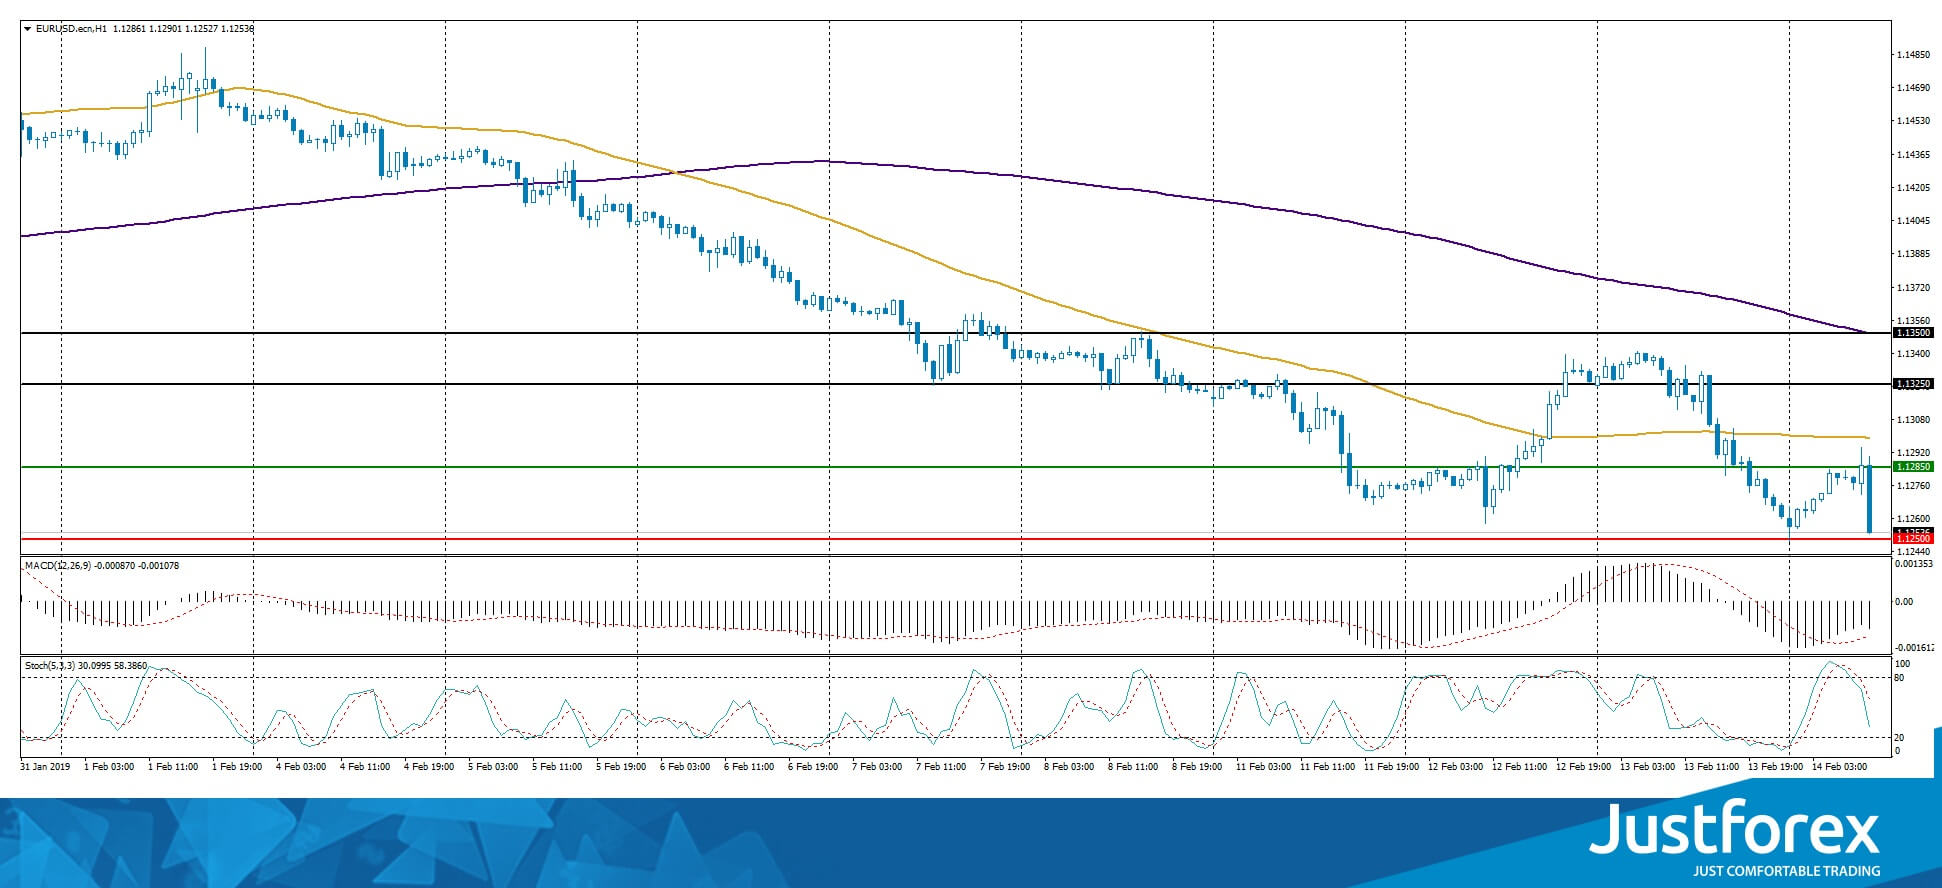
The indicators point to the power of the sellers, the price fixed below 50 MA and 200 MA.
The MACD histogram is in the negative zone and keeps falling, which points to the further descend of the EUR/USD quotes.
The Stochastic Oscillator is in the neutral zone, the %K line is below the %D line, which also suggests that you should sell EUR/USD.
Trading recommendations
Support levels: 1.12500, 1.12000
Resistance levels: 1.12850, 1.13250, 1.13500
If the price fixes below 1.12500, expect the quotes to fall toward 1.12000.
Alternatively, the quotes can rise toward 1.13200-1.13400.
The GBP/USD currency pair
Technical indicators of the currency pair:
Prev Open: 1.28910
Open: 1.28444
% chg. over the last day: -0.29
Day's range: 1.28132 – 1.28775
52 wk range: 1.2438 – 1.4378
The GBP/USD quotes keep showing a negative trend. Right now the trading instrument is testing the monthly minimums. The pressure on the pound is caused by the weak inflation report in the UK. The Brexit ambiguousness remains in the spotlight. The quotes have a tendency to descend further. The local support and resistance levels are 1.28200 and 1.28500. Open your positions from these marks.
The Economic News Feed for 14.02.2019 is calm.
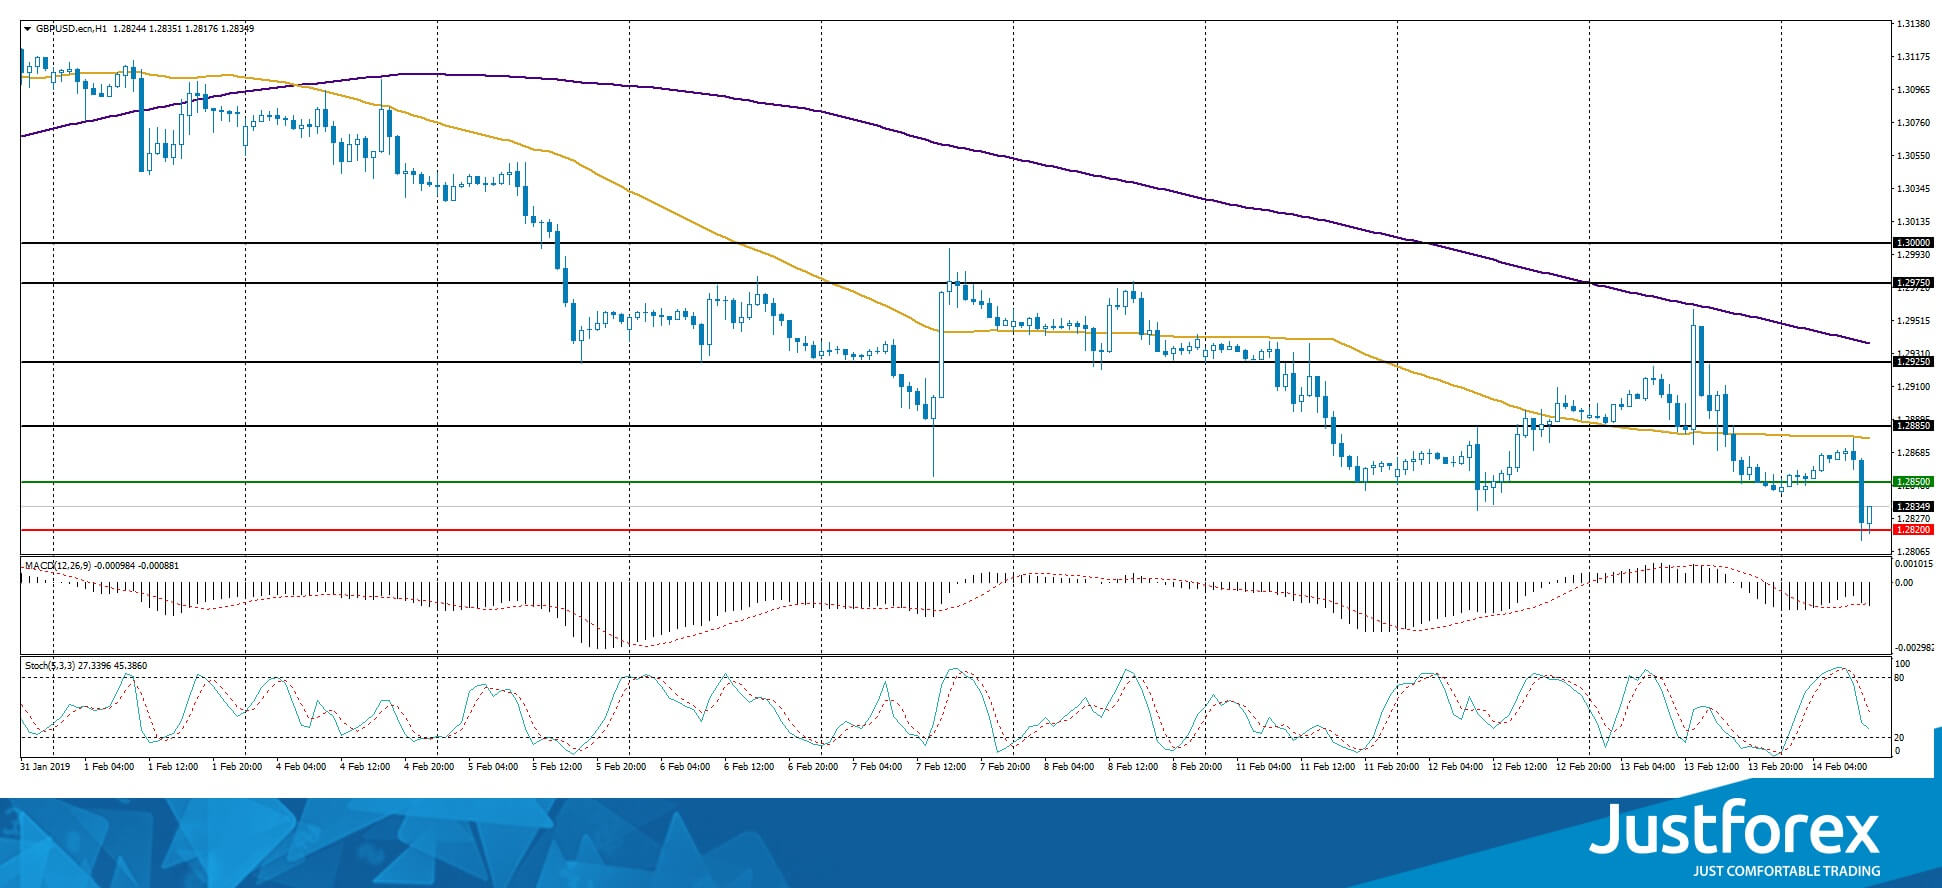
The indicators point to the power of the buyers, the price fixed below 50 MA and 200 MA.
The MACD histogram is in the negative zone and below the signal line which gives a strong signal to sell GBP/USD.
The Stochastic Oscillator is in the neutral zone, the %K line is below the %D line which also points to a bearish mood.
Trading recommendations
Support levels: 1.28200, 1.28000
Resistance levels: 1.28500, 1.28850, 1.29250
If the price fixes below 1.28200, expect the quotes to fall toward 1.27800-1.27500.
Alternatively, the quotes can correct toward 1.28850-1.29000.
The USD/CAD currency pair
Technical indicators of the currency pair:
Prev Open: 1.32360
Open: 1.32520
% chg. over the last day: +0.18
Day's range: 1.32288 – 1.32680
52 wk range: 1.2248 – 1.3664
USD/CAD is showing an ambiguous technical picture. Right now CAD is consolidating. The local support and resistance levels are 1.32300 and 1.32650. The trading instrument has prospects for future correction. CAD is supported by th epositive oil quotes dynamics. You should open positions from the key levels.
The Economic News Feed for 14.02.2019 is calm.
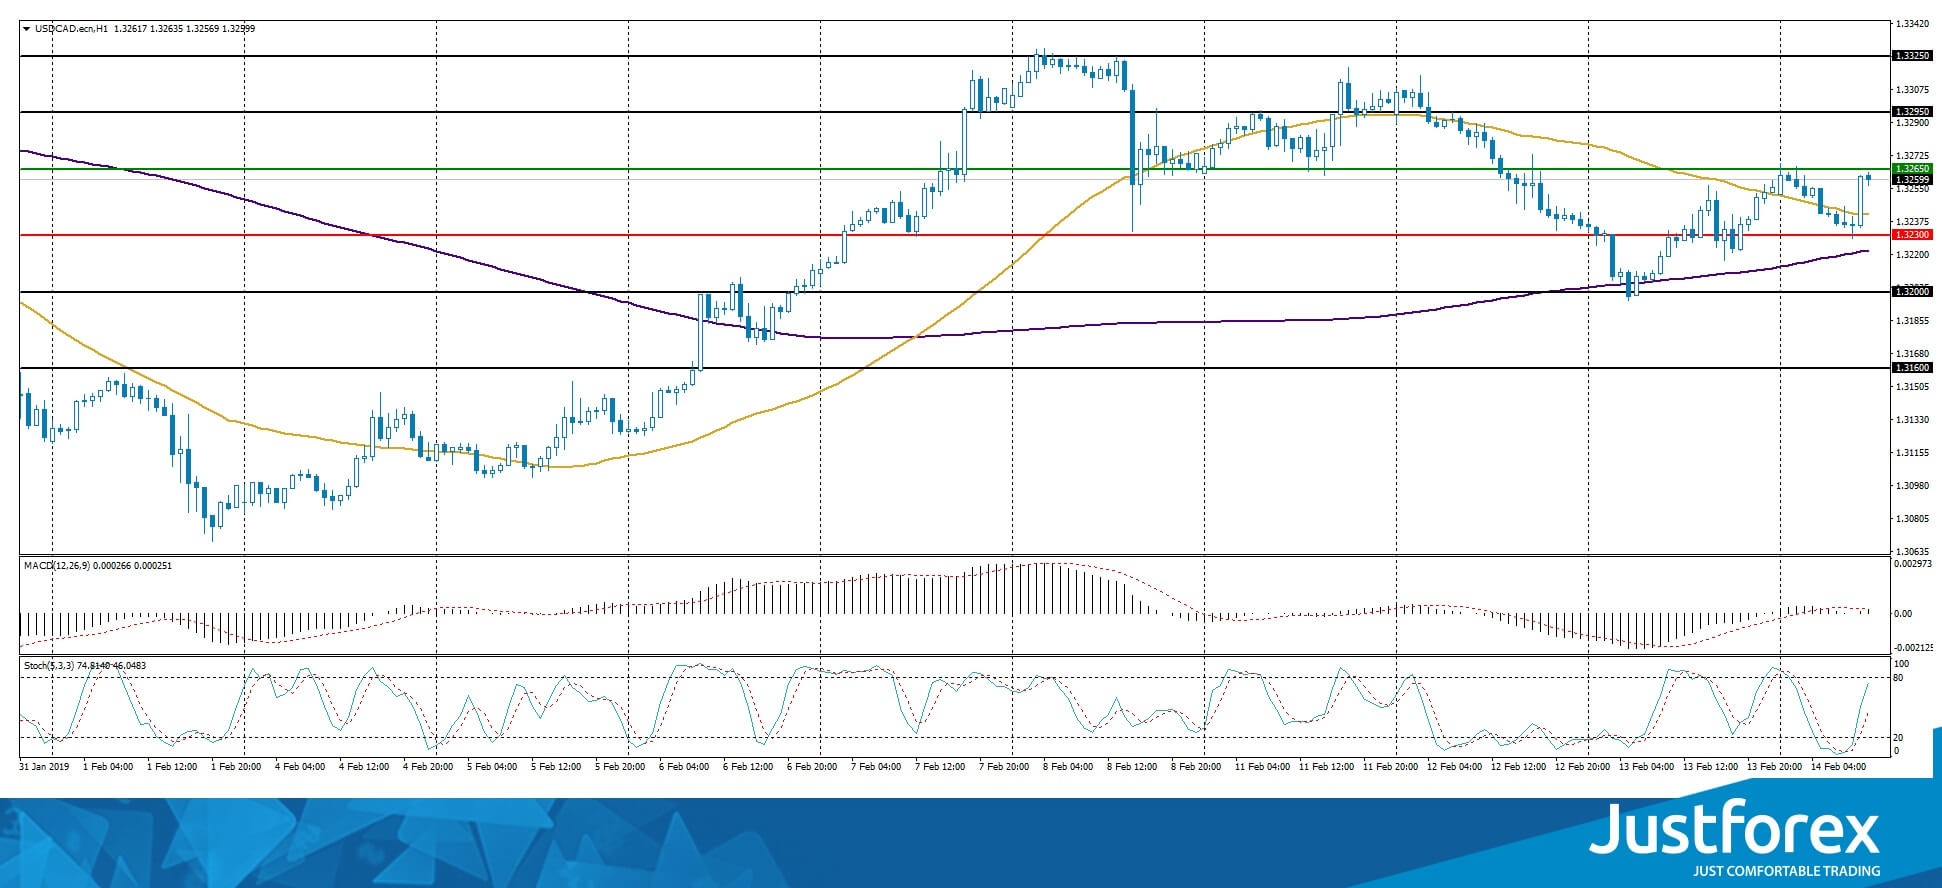
The indicators do not provide precise signals, the price crossed 50 MA.
The MACD histogram is close to 0.
The Stochastic Oscillator is in the neutral zone, the %K line is above the %D line which points to a bullish mood.
Trading recommendations
Support levels: 1.32300, 1.32000, 1.31600
Resistance levels: 1.32650, 1.32950, 1.33250
If the price fixes below 1.32300 expect the quotes to correct toward 1.320001.31700.
Alternatively, the quotes can grow toward 1.33000-1.33250.
The USD/JPY currency pair
Technical indicators of the currency pair:
Prev Open: 110.458
Open: 110.972
% chg. over the last day: +0.41
Day's range: 110.865 – 111.126
52 wk range: 104.56 – 114.56
The safe haven currency keeps losing postions against the USD. During the last two days, the quotes grew by 60 points. The trading instrument found the resistance around 111.000. The closest support is 110.850. USD/JPY has prospect for further growth. Keep an eye on US economic reports. You should open positions from the key levels.
Today Japan published a weak GDP report.
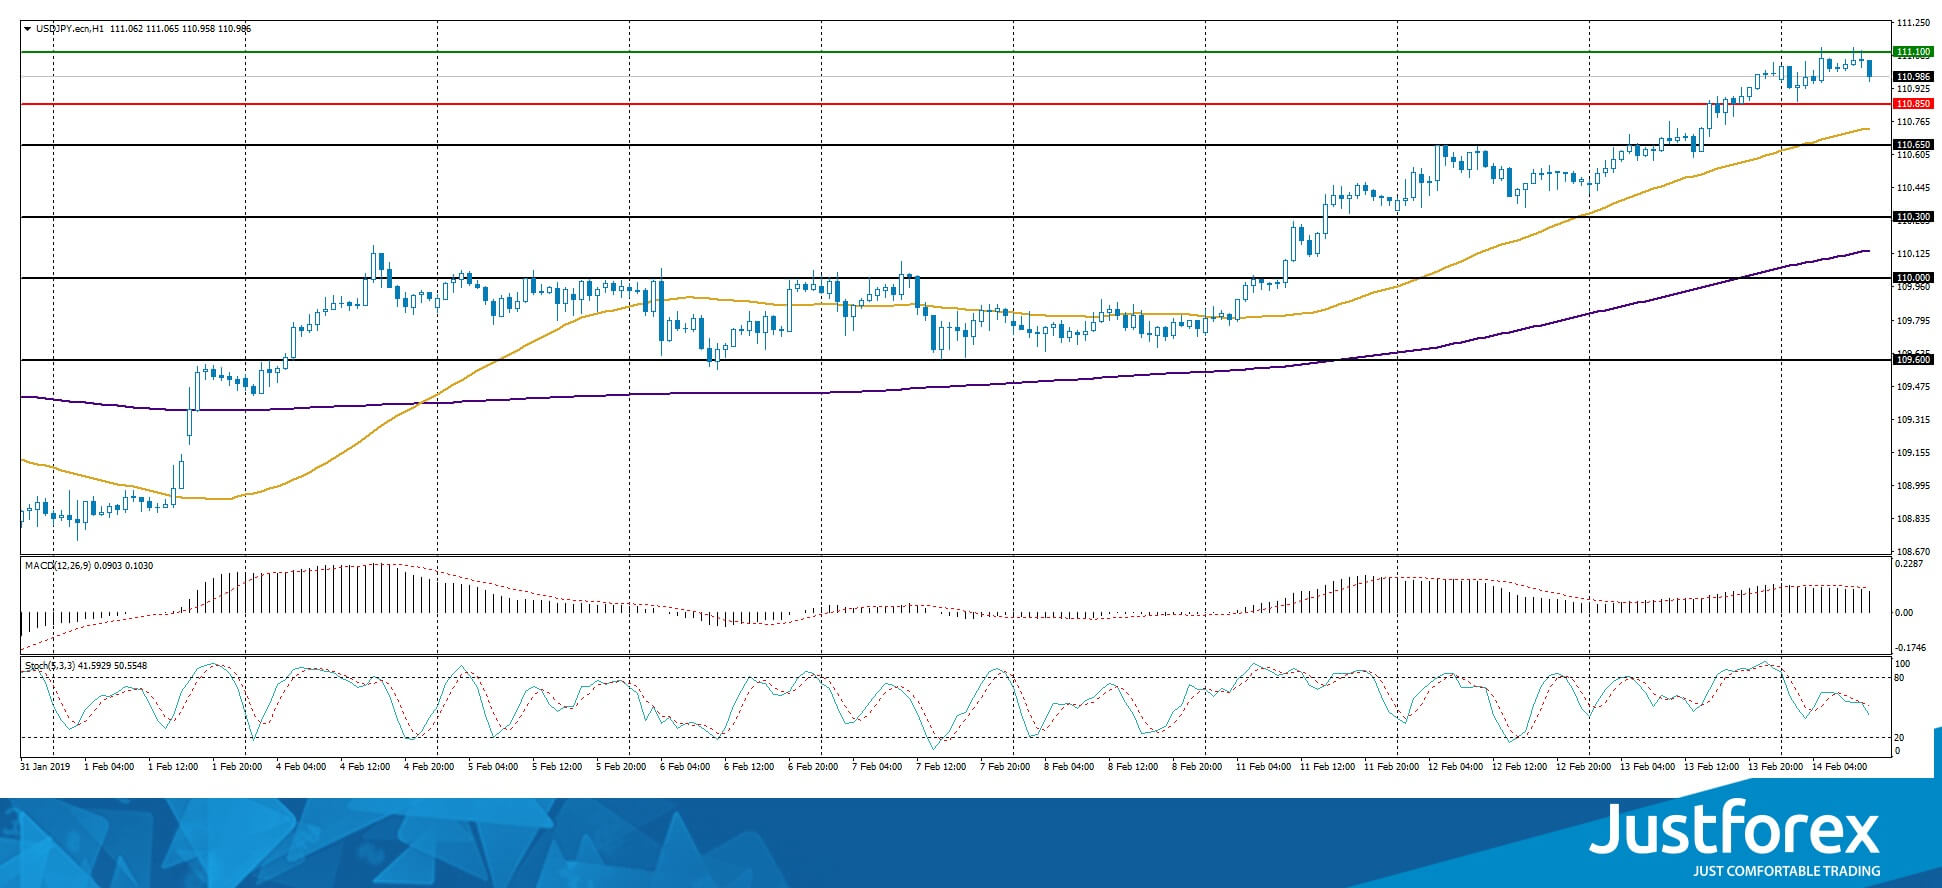
The price fixed above 50 MA and 200 MA which points to the power of the buyers.
The MACD histogram is in the positive zone but below the signal line which gives a weak signal to buy USD/JPY.
The Stochastic Oscillator is in the neutral zone, the %K line is below the %D line which points to a bearish mood.
Trading recommendations
Support levels: 110.850, 110.650, 110.300
Resistance levels: 111.100, 111.500
If the price fixes above 111.100 expect the quotes to grow toward 111.500.
Alternatively, the quotes can fall toward 110.600-110.400.
GBP Under Brexit Pressure
Brexit deadlock remains. Will Prime Minister Theresa May maintain political support and win concessions from the EU? We’ll see at the next vote, scheduled for 27 February. We expect GBP/USD to decline further as Brexit fatigue weighs on traders. Currently trading at 1.2834, GBP/USD is heading along 1.2810 short-term.
Following fruitless negotiations with EU President of the Commission Juncker and EU President Tusk in Brussels, May faces resentment from lawmakers, who are concerned about the upcoming decision: either back May’s deal, vote for a “long” extension of Article 50 and try to get a better deal, or reverse the exit decision (i.e. second referendum, unilateral withdrawal of Article 50). Today’s government motion will ignore a no-deal scenario, a move that could threaten May’s leadership in the Conservative party. Once again, she risks a no-confidence. Still, today’s Parliament session will not be a game changer – that will likely come in two weeks.
Investors climb the wall of worry
Markets are watching geopolitics closely, especially the China/US trade conflict. Meanwhile, the US Federal Reserve Bank has entered “wait-and-see” mode on monetary policy and will maintain as long as economic indicators stall. US headline inflation in January eased to 1.6% annually - compared to 1.9% in the previous month a forecast of 1.7% - amid a collapse in oil prices. Core inflation came in above forecast, printing at 2.2% compared to 2.1% expected. More data is coming this afternoon: publication of January’s producer prices, initial jobless claims, December’s retail sales and business inventories. On Friday come industrial production, Michigan sentiment index, Empire Manufacturing and most importantly durable goods orders for the month of December as well as purchasing manager indicators.
The US dollar bounced back at the European opening, especially against the Australian and New Zealand dollar. Over the last days, the greenback has traded with an upward bias, remaining insensitive to economic data. Trade negotiations between the US and China are still the main driver in FX.
AUD/USD Outlook: Recovery Faces Strong Headwinds From 0.7246 Fibo Barrier, Little Positive Impact From Strong China’s Data/Positive Rhetoric On...
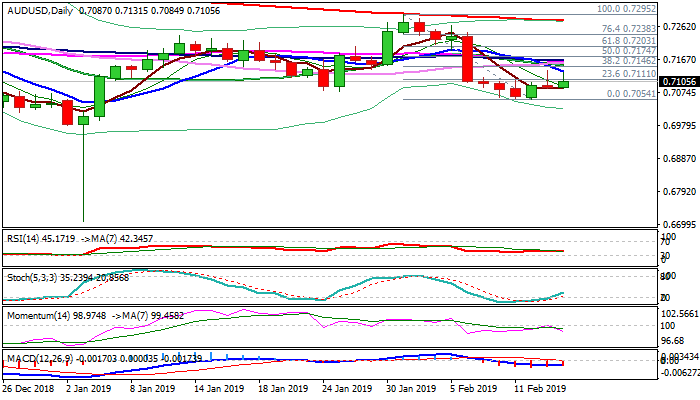
The Aussie dollar ran out of steam again at 0.7130 zone in late Asian trading on Thursday, following strong upside rejection on Wednesday and dipped back to 0.7100 zone.
Support from better than expected China's data and positive rhetoric about US/China trade talks, was so far short-lived, keeping recovery from 0.7054 base limited. Negative momentum and MA's in bearish setup on daily chart weigh, with north-heading stochastic partially offsetting negative signals.
The pair struggles on approach to pivotal Fibo barrier at 0.7146 (38.2% of 0.7295/0.7054), with the downside expected to remain vulnerable while recovery is limited.
Daily cloud's twist next week would also attract bears for retest of 0.7054 base and extension of pullback from 0.7295 on break.
Initial bullish signal could be expected on sustained break above 0.7146 pivot, but fresh bulls would face another strong barriers, provided by a cluster of daily MA's at 0.7151/64 zone and only firm break higher would confirm reversal.
Res: 0.7146, 0.7151, 0.7164, 0.7203
Sup: 0.7084, 0.7054, 0.7000, 0.6931
Trade Talks Progress A Big Boost For Sentiment
60 day extension a bullish catalyst
Optimism around Sino-US trade talks is continuing to provide a boost for equity markets on Thursday, with a meeting between President Xi and top US officials on Friday being closely monitored.
Trump's claim that negotiations are going "very well" and reports that a 60 day extension is being considered is encouraging. This was always, realistically, the best possibly outcome of these initial talks and I think we have to be pleased that this means two more months without new tariffs. The ultimate goal is for previous tariffs to be removed entirely but this is another important step towards that.
It's difficult to know exactly what impact the tariffs have had on the trade data so far, with figures suggesting there was some front-loading of Chinese exports prior to them being imposed. But data overnight – assuming it's reliable - suggests they're continuing to hold up well, with exports surging by 9.1% in January, smashing market expectations of a 3.2% decline. The timing of Chinese New Year always makes the data at the start of the year more difficult to interpret, which can lead people to take it with a pinch of salt.
Germany avoids recession, just
There hasn't really been much of a bullish case for the euro recently and Germany avoiding falling into recession by the skin of its teeth in December doesn't exactly inspire any change in that. The GDP data for the fourth quarter fell short of analyst expectations of 0.2%, with the economy instead flatlining. The number is subject to revision though so it may be too early to celebrate just yet.
Dollar powers on but gold remains resilient, for now
The dollar on the other hand is putting up quite a fight, despite the widespread belief a few months ago that it was going to be a challenging year for it. It certainly got off to a tough start but it's been on quite a run this month and is up more than 2% from the end of January lows. The positive noises around trade talks took the wind out of its sails over the last couple of days, with progress generally being a bearish story for the greenback, but it continues to grind higher.
This is keeping the pressure on gold which tends to struggle against the backdrop of a stronger dollar. It's showing some admirable resilience itself though and continues to trade above $1,300 but this will only last so long. At some point, the relationship will likely resume and it's just a case of who can hold their nerve longer, gold bulls or dollar bulls.
Oil testing major resistance on Saudi cut
The dollar rally isn't holding oil back either, with WTI and Brent now pushing previous resistance levels and threatening a very bullish breakout. There has been significant resistance around $55 and $65, respectively, for some time and these are both currently coming under pressure. The newsflow recently has certainly been more bullish, particularly reports of Saudi Arabia exceeding production cut targets by 500,000 barrels per day, and this has been the catalyst for the current bout of strength.
US 500 Index Jumps Towards 2-Month High Above 200-SMA
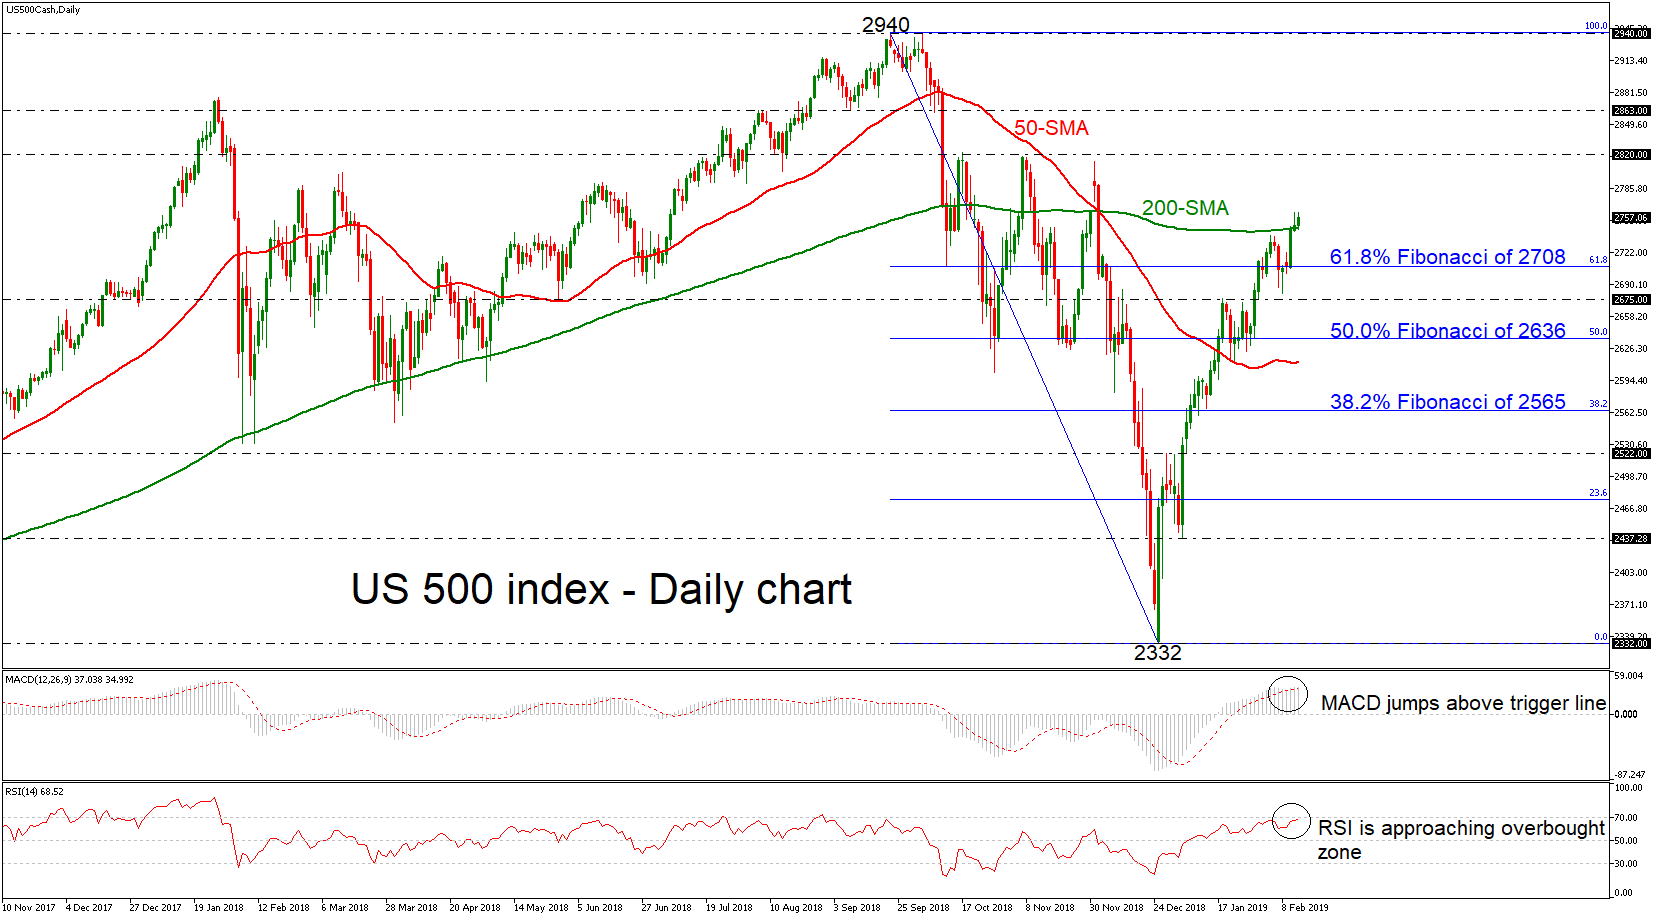
The US 500 stock index has had a bullish run above the strong obstacle of the 200-day simple moving average (SMA) and the 61.8% Fibonacci retracement level of the downleg from 2940 to 2332, indicating an upward tendency. Prices hit a two-month high of 2762 earlier today and the technical indicators are all pointing to further positive momentum in the short term.
The RSI indicator is heading upwards approaching the overbought territory, while the MACD oscillator posted a bullish cross with the red-trigger line in the positive area.
The next resistance to further gains would likely come from the 2820 barrier, taken from the high on November 2018. If there is a jump above this hurdle, resistance could be met around 2863, taken from the inside swing bottom on September 7.
On the other side, if the price loses momentum and retreats below the 200-SMA, it could challenge once again the 61.8% Fibonacci of 2708. Dropping below this area could take prices towards the 2675 support before hitting the 50.0% Fibonacci of 2636.
In the medium-term, the index is trying to switch the neutral mode to a more bullish one after the significant rebound on the 2332 region.
The US Currency Has Been Growing Again
Yesterday, the US dollar strengthened against a basket of currency majors. The dollar index (#DX) reached new monthly highs and closed in the positive zone (+0.45%). The US currency was supported by positive data on inflation in the US, as well as the optimism of financial market participants regarding the conclusion of a trade agreement between Washington and Beijing. The euro is still under pressure amid weak statistics. Thus, the volume of industrial production decreased by 0.9% in December instead of 0.4%.
The British pound weakened again relative to the US dollar after the publication of weak economic data from the UK. The consumer price index counted to 1.8% in January, while experts forecasted 1.9%. The Japanese yen is also declining against the US currency. Today, during the Asian trading session, a preliminary report on Japan's GDP has been published, the figure has risen by 0.3%, while investors expected growth by 0.4%. Meanwhile, positive data were published in China. The country's exports increased by 9.1% in January instead of the expected decline by -3.2%. Imports fell by 1.5% instead of 10%.
The "black gold" prices are strengthening. At the moment, futures for the WTI crude oil are testing the mark of $54.55 per barrel.
Market Indicators
- Yesterday, the bullish sentiment was observed in the US stock market: #SPY (+0.32%), #DIA (+0.50%), #QQQ (+0.07%).
- The 10-year US government bonds yield has increased. Currently, the figure is at the level of 2.69-2.70%.
The news feed on 14.02.2019:
- Eurozone GDP data at 12:00 (GMT+2:00);
- Report on the US retail sales at 15:30 (GMT+2:00);
- Producer price index in the US at 15:30 (GMT+2:00).
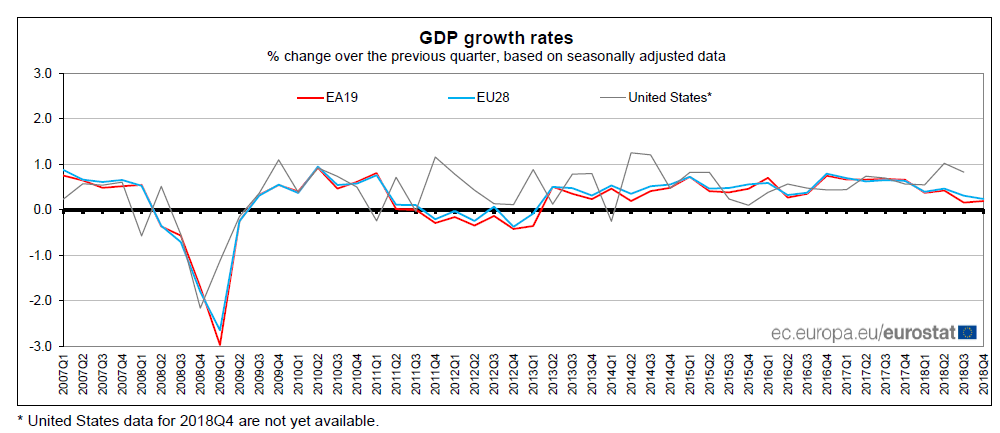
Eurozone GDP grew 0.2% qoq in Q4, matched expectations
Eurozone GDP grew 0.2% qoq in Q4, unchanged from Q3 and matched expectations. Annually, GDP grew 1.2% yoy. Over the whole year 2018, GDP grew 1.8%. Employment grew 0.3% qoq, above expectation of 0.2% qoq.
EU 28 GDP grew 0.3% qoq, 1.4% yoy. Over 2018, EU 28 GDP grew 1.9%.
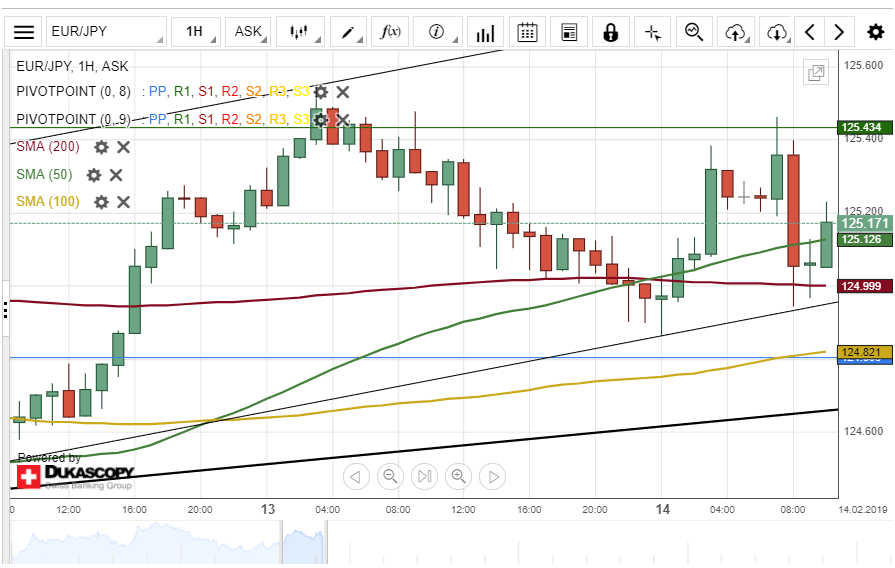
EUR/JPY Tests Weekly R1 At 125.45
The single European currency depreciated about 63 base points against the Japanese Yen on Wednesday. The decline was stopped by a support cluster formed by the combination of the weekly and the monthly PPs at 125.00.
Bears took control of the market during UK's trading session on Thursday. By the middle of the day, the currency pair has lost about 0.41% of its values.
Everything being equal, it is likely that the currency exchange rate makes a U-turn north from a psychological support level at 125.00 before the end of today's trading session.
However, if the rate passes the 200-hour SMAs at 125.00, the pair could remain in bears market within this session.