Sample Category Title
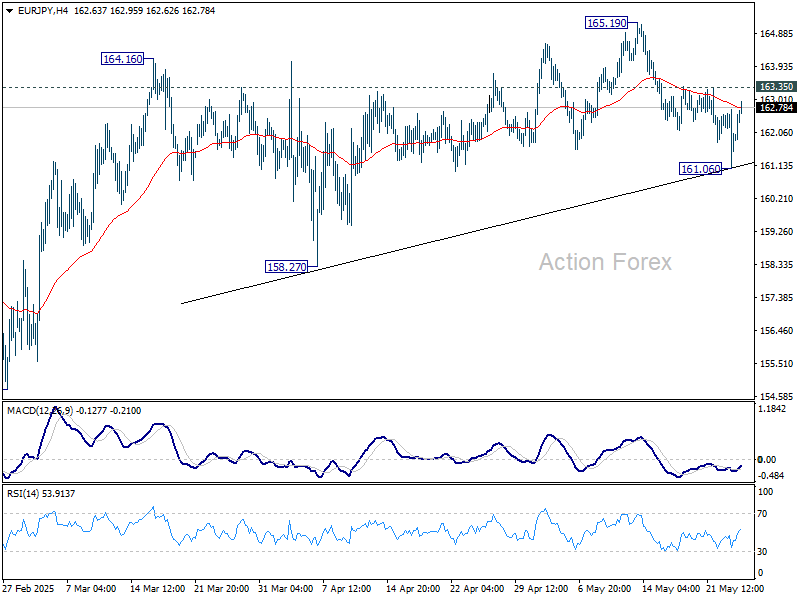
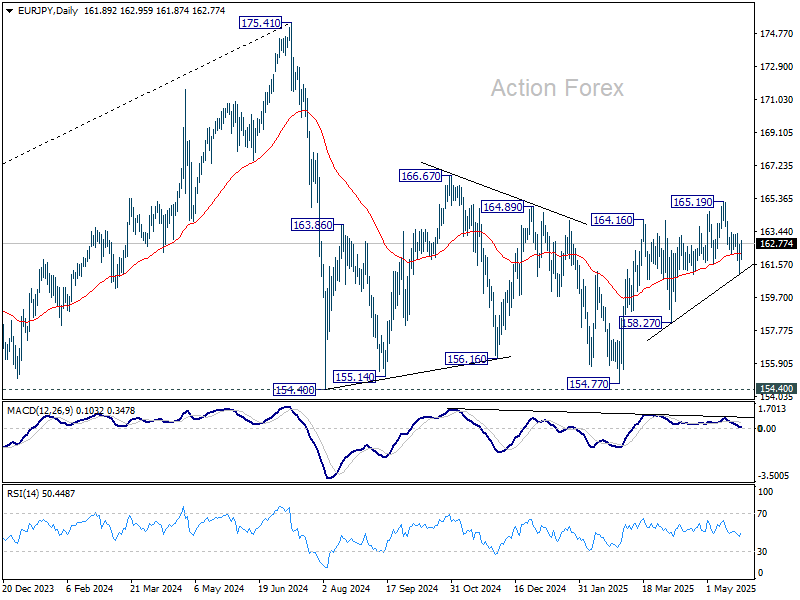
EUR/JPY Daily Outlook
Daily Pivots: (S1) 161.16; (P) 161.96; (R1) 162.82; More...
Intraday bias in EUR/JPY is turned neutral first with current recovery. On the downside, break of 161.06 will resume the fall from 165.19 to 158.27 support next. Nevertheless, on the upside, break of 163.35 resistance will revive near term bullishness, and bring retest of 165.19 instead.
In the bigger picture, price actions from 175.41 are seen as correction to rally from 114.42 (2020 low). Strong support should be seen from 38.2% retracement of 114.42 to 175.41 at 152.11 to contain downside. However, sustained break of 152.11 will bring deeper fall even still as a correction.
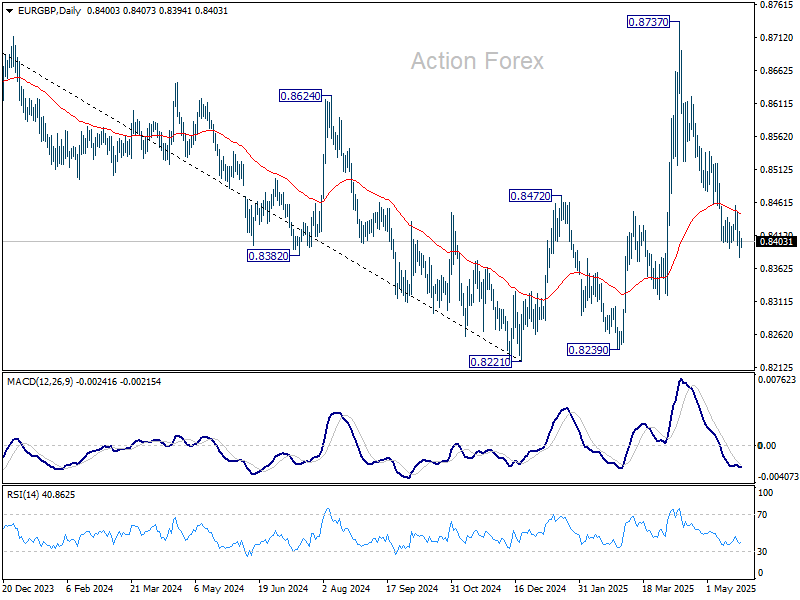
EUR/GBP Daily Outlook
Daily Pivots: (S1) 0.8378; (P) 0.8398; (R1) 0.8416; More...
Intraday bias in EUR/GBP remains on the downside for the moment. Current fall from 0.8737 should target 0.8314 support first, and then 0.8239 low. On the upside, above 0.8458 resistance should indicate short term bottoming, likely with bullish convergence condition in 4H MACD, and turn bias back to the upside for stronger rebound.
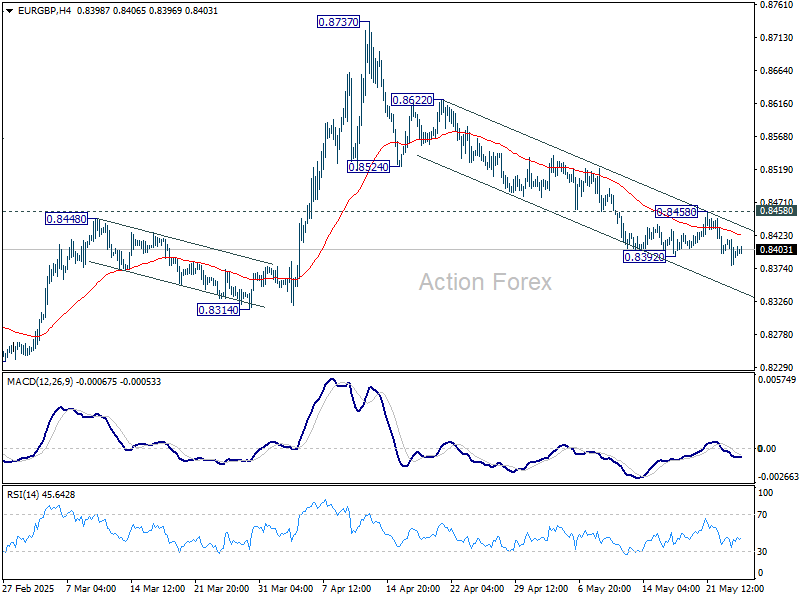
In the bigger picture, current development suggests that price actions from 0.8221 medium term bottom are merely forming a corrective pattern. However, there is no clear momentum to break through 0.8201 key support (2022 low) yet. Hence, range trading is expected between 0.8221/8737 for now.
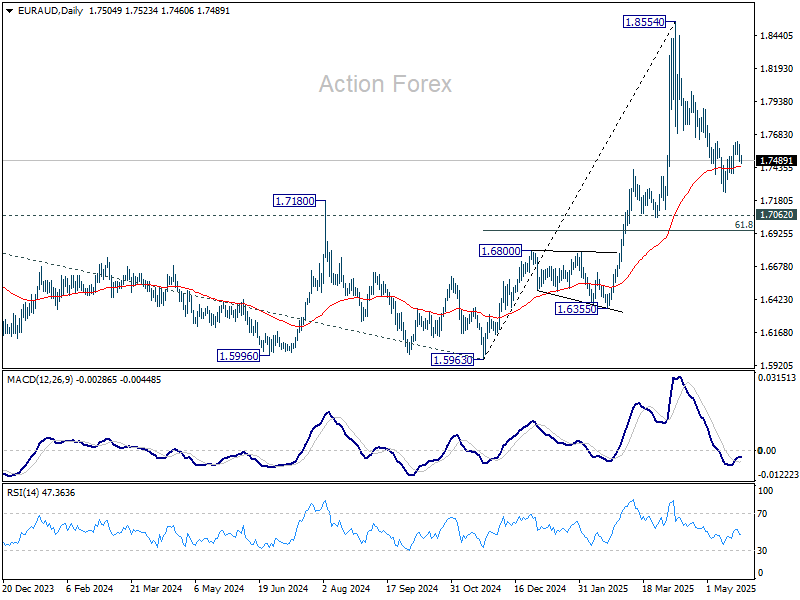
EUR/AUD Daily Outlook
Daily Pivots: (S1) 1.7447; (P) 1.7530; (R1) 1.7577; More...
Intraday bias in EUR/AUD stays neutral at this point, and more range trading could be seen. On the upside, firm break of 1.7628 resistance will suggest that fall from 1.8554 as completed as a correction, and retain larger bullishness. Intraday bias will be back on the upside for stronger rebound. However, below 1.7245 will resume the fall to 61.8% retracement of 1.5963 to 1.8554 at 1.6953.
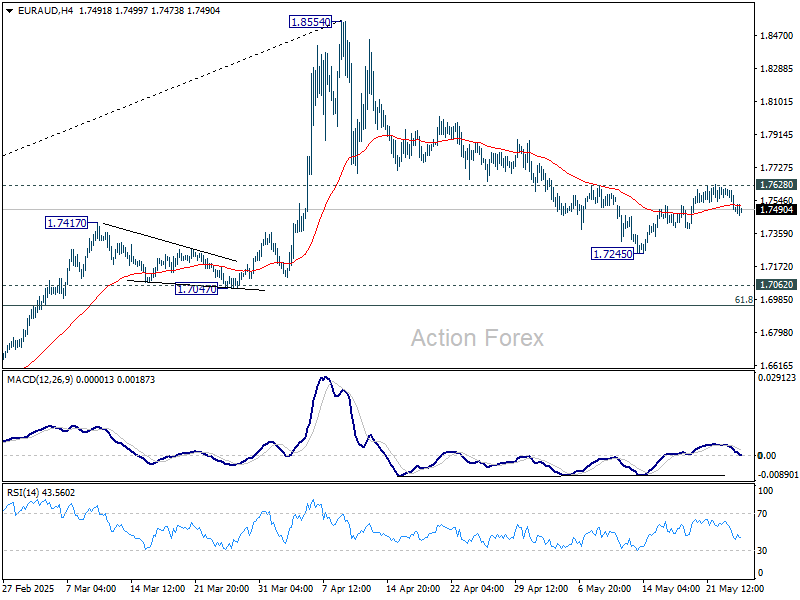
In the bigger picture, as long as 1.7062 resistance turned support (2023 high) holds, up trend from 1.4281 (2022 low) should still be in progress. Break of 1.8554 will target 100% projection of 1.4281 to 1.7062 from 1.5963 at 1.8744. However, sustained break of 1.7062 will confirm medium term topping and bring deeper fall back to 1.5963 support.
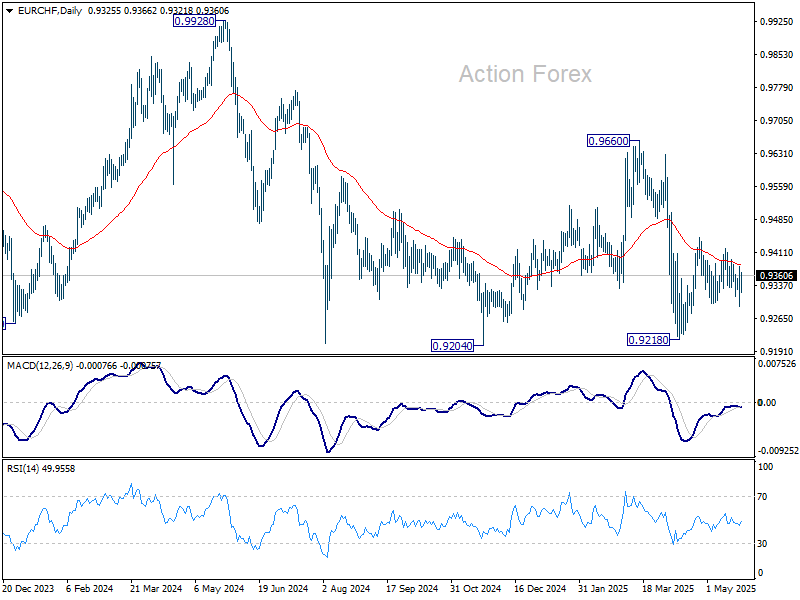
EUR/CHF Daily Outlook
Daily Pivots: (S1) 0.9290; (P) 0.9335; (R1) 0.9378; More....
Intraday bias in EUR/CHF remains neutral for the moment, and outlook is unchanged. Price actions from 0.9218 are seen as either a corrective move or the third leg of the pattern from 0.9204. On the upside, break of 0.9419 will resume the rise from 0.9218 through 0.9445 resistance. However, firm break of 0.9296 support will bring retest of 0.9218 low.
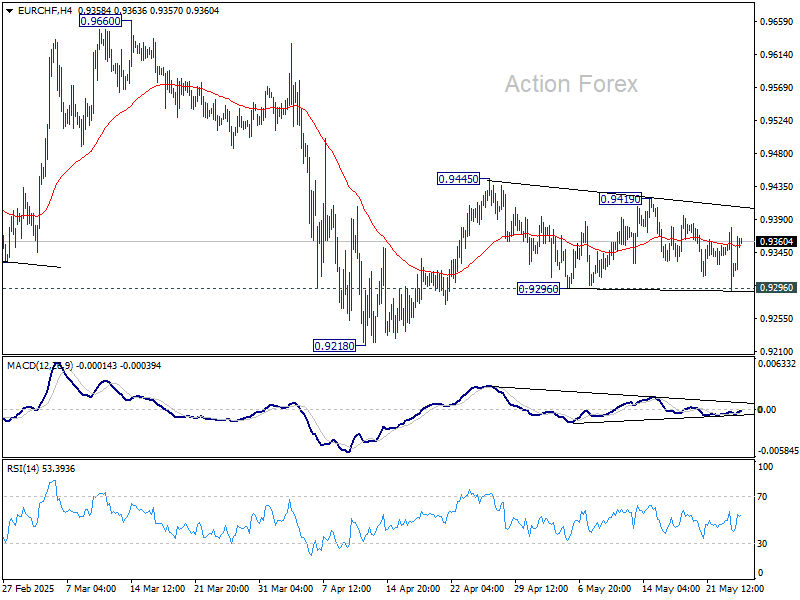
In the bigger picture, prior rejection by long-term falling channel resistance (now at 0.9548) retains medium term bearishness. That is, down trend from 1.2004 (2018 high) is still in progress. Firm break of 0.9204 (2024 low) will confirm resumption. This will remain the favored case as long as 0.9660 resistance holds.
GBP/USD Rallies While USD/CAD Declines Steadily
GBP/USD started a fresh increase above the 1.3520 zone. USD/CAD declined and now is consolidating below the 1.3800 level.
Important Takeaways for GBP/USD and USD/CAD Analysis Today
- The British Pound is eyeing more gains above the 1.3600 resistance.
- There is a key bullish trend line forming with support at 1.3540 on the hourly chart of GBP/USD at FXOpen.
- USD/CAD started a fresh decline after it failed to clear the 1.4000 resistance.
- There is a connecting bearish trend line with resistance at 1.3740 on the hourly chart at FXOpen.
GBP/USD Technical Analysis
On the hourly chart of GBP/USD at FXOpen, the pair formed a base above the 1.3350 level. The British Pound started a steady increase above the 1.3450 resistance zone against the US Dollar, as discussed in the previous analysis.
The pair gained strength above the 1.3500 level. The bulls even pushed the pair above the 1.3550 level and the 50-hour simple moving average. The pair tested the 1.3585 zone and is currently consolidating gains.
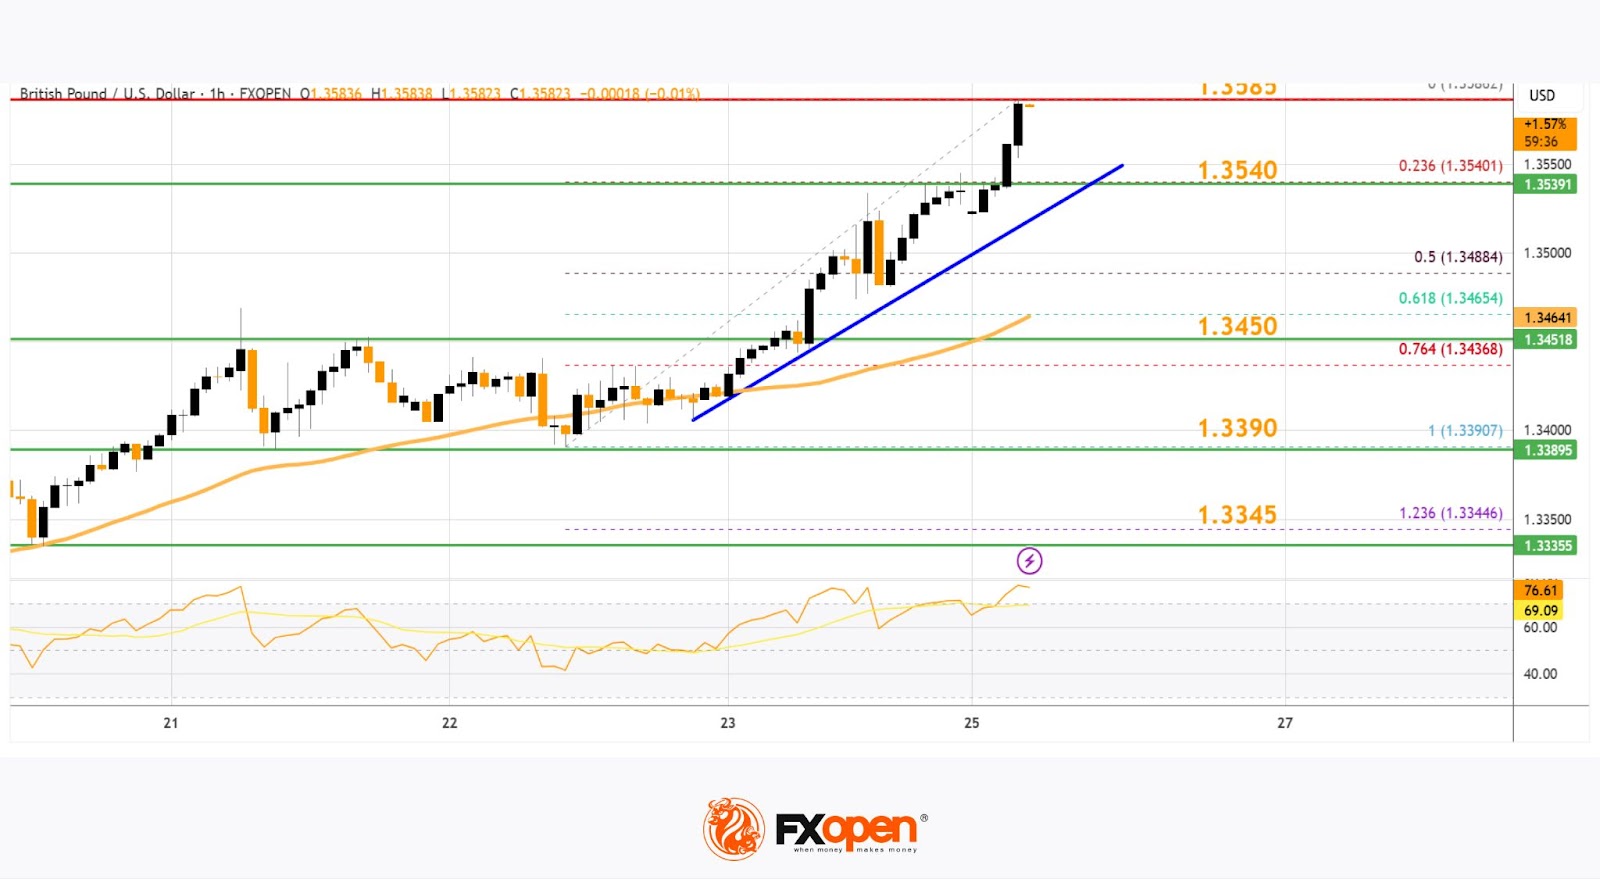
GBP/USD is stable above the 23.6% Fib retracement level of the upward move from the 1.3390 swing low to the 1.3586 high. There is also a key bullish trend line forming with support at 1.3540.
It seems like the bulls might aim for more gains. The RSI moved above the 60 level on the GBP/USD chart and the pair is now approaching a major hurdle at 1.3600.
An upside break above the 1.3600 zone could send the pair toward 1.3650. Any more gains might open the doors for a test of 1.3720. If there is a downside correction, immediate support is near the 1.3540 level and the trend line.
The first major support sits near the 50% Fib retracement level of the upward move from the 1.3390 swing low to the 1.3586 high at 1.3485. The next major support is 1.3450. If there is a break below 1.3450, the pair could extend the decline. The next key support is near the 1.3390 level. Any more losses might call for a test of the 1.3345 support.
USD/CAD Technical Analysis
On the hourly chart of USD/CAD at FXOpen, the pair climbed toward the 1.3900 resistance zone before the bears appeared. The US Dollar formed a swing high near 1.3890 and recently declined below the 1.3800 support against the Canadian Dollar.
There was also a close below the 50-hour simple moving average and 1.3750. The bulls are now active near the 1.3700 level, but they might fail to protect more losses. If there is an upside correction, the pair could face resistance near the 1.3740 level.
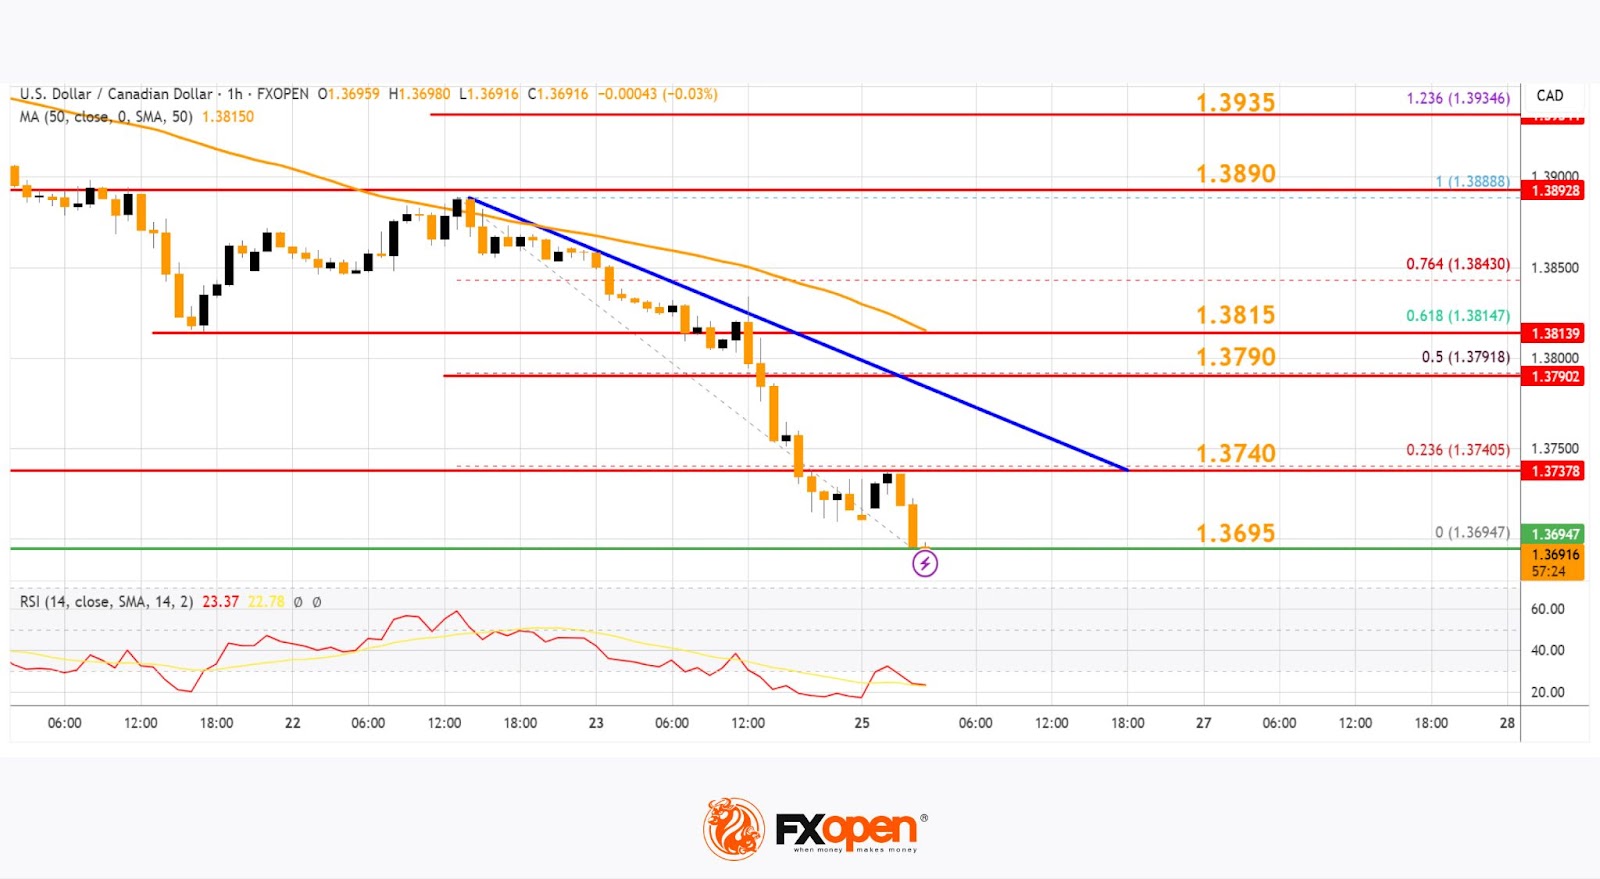
There is also a connecting bearish trend line with resistance at 1.3740. The trend line is near the 23.6% Fib retracement level of the downward move from the 1.3888 swing high to the 1.3694 low.
If there is a fresh increase, the pair could face resistance near the 1.3790 level. It is close to the 50% Fib retracement level of the downward move from the 1.3888 swing high to the 1.3694 low. The next key resistance on the USD/CAD chart is near the 1.3815 level.
If there is an upside break above 1.3815, the pair could rise toward the 1.3890 resistance. The next major resistance is near the 1.3935 level, above which it could rise steadily toward the 1.4000 resistance zone.
Immediate support is near the 1.3695 level. The first major support is near 1.3660. A close below the 1.3660 level might trigger a strong decline. In the stated case, USD/CAD might test 1.3600. Any more losses may possibly open the doors for a drop toward the 1.3550 support.
Trade over 50 forex markets 24 hours a day with FXOpen. Take advantage of low commissions, deep liquidity, and spreads from 0.0 pips. Open your FXOpen account now or learn more about trading forex with FXOpen.
This article represents the opinion of the Companies operating under the FXOpen brand only. It is not to be construed as an offer, solicitation, or recommendation with respect to products and services provided by the Companies operating under the FXOpen brand, nor is it to be considered financial advice.
EUR/USD Extends Its March Beyond 1.14
Markets
US President Trump unexpectedly dropped a bomb on Friday by recommending a 50% tariff on EU goods effective immediate June 1st as he believed that the bloc wasn’t negotiating in good faith. Treasury Secretary Bessent added that he hoped it would light a fire under the EU. Apparently it did. A phone call between Commission President von der Leyen and US President Trump resulted in the latter pushing the negotiation deadline back to July 9 (in line with the previous end date of the 90-day pause), but the consequence of a “no-deal” remains the 50% tariff rather than the 20% reciprocal tariff charted in Washington’s Rose Garden on Liberation Day. Von der Leyen said that Europe is ready to advance talks swiftly and decisively with Trump cherishing the very nice call.
Trump’s rant on social media covered an otherwise quite trading session by risk aversion on Friday. European stock markets lost 2% by the closing bell while US benchmarks suffered a setback of up to 1%. German Bunds rallied with yields sliding 6 to 7 bps across the curve as investors reverted to upping ECB rate cut bets. If any, the episode highlights what Lagarde labelled “unpredictable uncertainty”, making it very hard to assess economic and inflationary consequences. US Treasuries initially spiked higher, but failed to stick with gains. Daily US yield changes varied between -1.8 bps and +0.2 bps with the belly of the curve outperforming the wings. The US dollar sold off with the trade-weighted greenback closing at 99.11 from a start at 99.89. A test of the April low (97.92) is in the making. Friday’s reaction function shows that Trump’s bullying tactics trigger “sell America” vibes with investors. EUR/USD’s rise on Friday is testament to that: 1.1362 from 1.1281.
Risk sentiment improves this morning with the July 9 deadline back in place. Stakes are now higher though. German Bund and European equity futures undo most of Friday’s moves. EUR/USD extends its march beyond 1.14. It’s probably too early to draw firm conclusions as the absence of UK (Spring Bank Holiday) and US (Memorial Day) investors squeezes market volumes today. We warn to get over-enthused and stick with a negative bias against the dollar. The EMU eco calendar is empty. ECB president Lagarde speaks on Europe’s role in a Fragmented World and it’s unclear whether she’ll touch on monetary policy during sideline interviews.
News & Views
Moody's raised the outlook on Italy’s Baa3 rating to positive from stable, reflecting the improved fiscal outlook against the backdrop of a better-than-expected fiscal performance in 2024 and the stable domestic political environment. Last year’s budget deficit came in at 3.4% compared to the 3.8% projected. Moody’s expects a further decline to 3% by 2026 as widening primary surpluses offset rising interest payments. The debt ratio should rise through 2027 (138.4% from 135.3% in 2024) before moving to a gradual declining trend from 2028. The positive outlook is also supported by a robust labour market, sound household and corporate balance sheets and a healthy banking sector. Together with further expected improvements in Italy’s external position they support economic resilience and reduce Italy's susceptibility to event risk. Its Baa3-rating takes into account Italy's large, wealthy economy and effective institutions and governance relative to rating peers. Moody’s adds, however, that the high debt burden remains a constraint on its credit profile.
European officials familiar with the matter said they’re increasingly confidence that Bulgaria will soon meet all requirements for adopting the euro. With a history of narrow deficits, a low debt ratio and currency stability, above-target inflation was one of the final sticking points after the Russian invasion triggered a spike in prices. The European Commission together with the ECB is concluding the convergence report. Its release is due for early June. A positive assessment followed by EU leaders’ blessing at the end of June summit may pave the way for Bulgaria’s euro adoption from the beginning of 2026.
Markets Swing on Rapidly Changing Trade Headlines
Trade headlines are accelerating again—and that's not necessarily a good thing. Markets ended last week on a sour note after President Donald Trump threatened to impose a 50% tariff on European imports by June 1st, prompting a sharp selloff in major US and European indices. He also warned that Apple could face a 25% tariff unless it relocates its production to the US. The tech giant dropped 3% on fears that moving production could make it nearly impossible to sell iPhones for less than $3,000 apiece.
Yet, sentiment has shifted sharply this morning. The Nikkei 225 rose more than 1.7%, buoyed by hopes that the US and Japan are progressing toward a trade deal. The news of partnership between US Steel Corp and Nippon Steel - long-standing saga since the Biden administration— also fuel optimism. Shares of Nippon Steel initially surged in Tokyo, though most gains were pared by the time of this report.
In Europe, EuroStoxx futures are up by 1.6%, and S&P 500 futures have gained about 1% at the time of writing, helped by reports that the 50% EU tariff threat will be postponed to June 9th, giving European officials a bit more breathing room to negotiate. Still, the short extension comes as an unwelcome surprise for Europeans hoping for a calm, shortened week due to Thursday's Ascension Day holiday, and the US markets are closed today.
Quick reminder: The EU, taken as a bloc, is the US' largest trading partner. And rising tensions between the US and EU could easily spark a broader selloff in risk assets, drive the dollar and US Treasuries lower, and send the euro, European bonds, and gold higher this week.
In this context, selling pressure on the US dollar continues, driven by renewed trade frictions and swelling concerns over US debt. The dollar index is nearing its April lows, while the EURUSD has opened the week on strong footing—partly in relief over the delayed EU tariff deadline, though it's worth noting the euro was already rising on Friday when the tariff threat emerged. The euro appears to be acting as both a safe haven and a risk-on asset amid trade headlines.
Cable surged past 1.35 for the first time in over three years, while the USDJPY looks poised to test the 142 level to the downside, with the 140 psychological mark in sight. The yen is supported by ongoing US dollar softness and mounting expectations of hawkish policy from the Bank of Japan (BoJ), bolstered by stronger-than-expected April CPI data.
Elsewhere, gold continues to hold above $3,300 per ounce, supported by trade and debt uncertainties and Bitcoin is catching a bid amid capital outflows from the dollar and growing adoption by institutional players.
Busy week ahead
This week brings several key catalysts for both equity and currency markets. Major European economies will release May flash inflation figures, and consensus expects a slowdown after April’s surprise uptick. A stronger euro may have offset the rebound in oil prices. Should inflation slow meaningfully, the EURUSD could rally past the 1.15 handle.
Investors will also monitor fresh Japanese inflation data, the Reserve Bank of New Zealand (RBNZ) is widely expected to cut interest rates by 25 basis points on Wednesday. In the US, Q1 GDP and core PCE data will provide critical insight into the health of the economy. A soft GDP print isn’t necessarily negative for investor sentiment —unless it’s accompanied by sticky inflation, which is likely given the potential tariff shock. That combination could spell trouble for Federal Reserve (Fed) policy expectations and equity valuations.
Finally, all eyes turn to Nvidia, set to report fiscal Q1 2026 earnings after the bell on Wednesday. Last quarter, the company delivered strong results, although revenue just missed the $40 billion mark and margins remained under pressure due to Blackwell chip manufacturing challenges.
For Q1, sales are expected to surpass $43 billion, despite heated trade war and rising Chinese competition. Margins may still face pressure, but fundamentals remain robust. Big spenders pledge to spend big, TSMC posted strong results—partly due to pre-tariff demand—and Nvidia recently secured major AI infrastructure deals in the Middle East, which should appear in forward guidance.
The company is also prepping a cheaper version of its Blackwell chips for the Chinese market—though it still needs to be able to sell them. Options markets imply that Nvidia shares could move more than 7% in either direction following the report.
Trump’s Tariff Twists Stir Up Markets
In focus today
Monday kicks off quietly, with no significant key data releases scheduled.
In general, the week will be light on the data front, with the main releases including US consumer confidence on Tuesday, FOMC minutes and euro area inflation expectations Wednesday, and May inflation data for Germany, Spain and Italy as well as US personal spending/PCE figures on Friday. Weighing heavily on markets, we will continue to keep an eye out for any news on trade talks. Note that the Danske Morning Mail will not be published on Thursday and Friday this week due to the Ascension Day holiday.
Economic and market news
What happened since Friday
Trade talks were in the limelight again, as Trump threatened Apple with 25% tariffs and the EU with 50% tariffs starting 1 June. Trump laid out the playing field, stating that he "is not looking for a deal" with the EU, as discussions are reportedly "going nowhere". However, yesterday it was announced that Trump backed away from this threat, agreeing to extend the deadline until 9 July (as was the initial deadline) between the US and the EU. The U-turn comes on the back of a conversation between Trump and EC President von der Leyen, with both parties opting for a swift and constructive agreement. Accordingly, this largely confirms that Trump's tariff plans can be regarded as a negotiation tool.
In the euro area, wage growth declined to 2.4% y/y in Q1 2025 relative to 4.1% y/y in Q4 2024, according to the ECB's negotiated wage indicator. The large drop in Q1 mainly reflects one-off inflation compensation paid to workers in Q1 last year. While this decline overstates the underlying momentum in wage growth, excluding these one-offs shows a clear downward trend. This is visible in the ECB's wage tracker, which points to lower wage growth for 2025 and in company survey data indicating total wage growth around 3% y/y - consistent with inflation returning to 2%. Together, these wage indicators support further ECB rate cuts this year, as they imply lower services inflation. Importantly, negotiated wages do not capture the full picture, as they exclude overtime, salary increases to new or promoted staff, bonuses, and individual compensation not linked to collective bargaining. As such, the full overview of wage growth in Q1 2025 will come with the third estimate of the national account data on 6 June in the compensation per employee measure - the ECB's preferred wage measure.
In Germany, Q1 2025 GDP growth was revised up to 0.4% q/q (flash: 0.2%), due to new export data for March released since the flash estimate showing a large increase in exports, likely due to front-loading to the US. This could result in weaker exports in either Q2 or Q3. Yet, besides front-loading of exports, private consumption rose 0.5% q/q, which is strong compared to the weak consumer confidence and a more positive sign for the economy.
In Sweden, employment was flat over the month - markedly better than expected after the large increase in March. Thus, the labour market data points to a resilient Swedish economy, which reinforces our view that the Riksbank will stay on hold in June.
Equities: Friday was one of those days with equities, bonds and dollar selling off at the same time. For every time the correlation flips, the bigger the risk of structural changes to the US equity exposure for pension funds and others. Though the flip in correlations is worrying, the overall equity moves were not. Equities recovered most of the losses into the session, as investors are clearly getting used to Trump's negotiation tactics. At least that is the market interpretation of it all, with close to zero discounting of the risk of 50% tariffs actually being implemented. Just take the Mag 7 companies, down a meagre -1.5% on the news. These companies generate between 25-40% of revenues in Europe. If 50% tariffs on Europe really were to happen, we would likely see EU going hard at them. Given the small reaction to Mag 7 on Friday, it is obvious that investors do not price in any meaningful escalation.
Equities and bonds recovered about half of their intra-day losses on Friday and futures suggest that European rebound will continue today. Stoxx 600 closed -0.9% after dropping north of -2% intra-day. Similarly, S&P 500 shaved off only -0.7%. Despite the impressive intra-day rebound in equities, defensives still outperformed and did so overall last week, for the first time in four weeks. Apple one of the underperformers on Friday, down -3% on new tariff threats from Trump. Again, market impact is not very alarming: We will likely see Tim Cook promising US made iPhones by 2030, but taking no concrete action to do so, and both the president and shareholders will be happy. US and UK are closed for holiday today.
FI and FX: The USD sold off on Friday, when US President Donald Trump called for a 50% tariff on imports from the EU thereby escalating the trade war again. EUR/USD rose to the highest since early May on the news. However, the market did not sell US Treasuries this time around with the 10Y yield holding steady around 4.50%. Both SEK and NOK gained vis-à-vis the EUR. The latter continues to trend stronger, while the former rose to the strongest level in about two weeks.
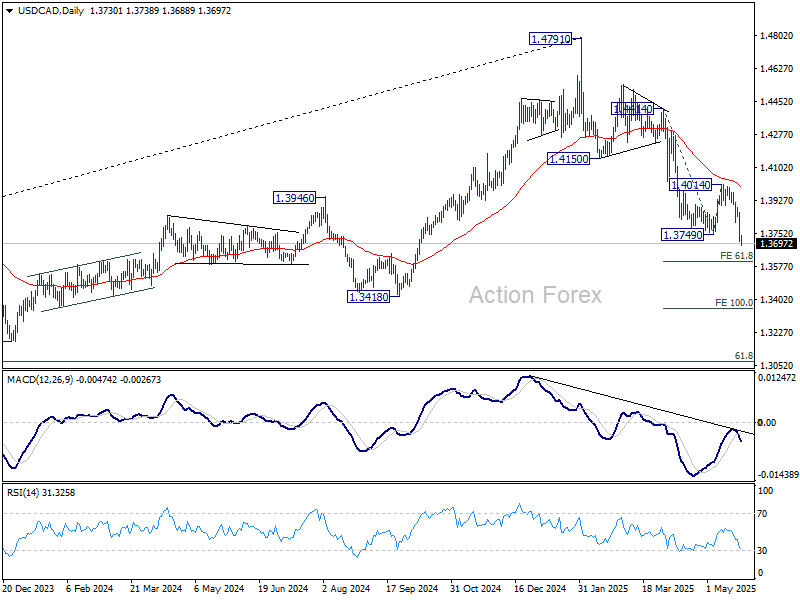
USD/CAD Daily Outlook
Daily Pivots: (S1) 1.3673; (P) 1.3771; (R1) 1.3832; More...
Intraday bias in USD/CAD stays on the downside at this point. Current fall from 1.4791 is in progress for 61.8% projection of 1.4414 to 1.3749 from 1.4014 at 1.3603. On the upside, above 1.3812 minor resistance will turn intraday bias neutral again first. But outlook will remain bearish as long as 1.4014 resistance holds, in case of recovery.
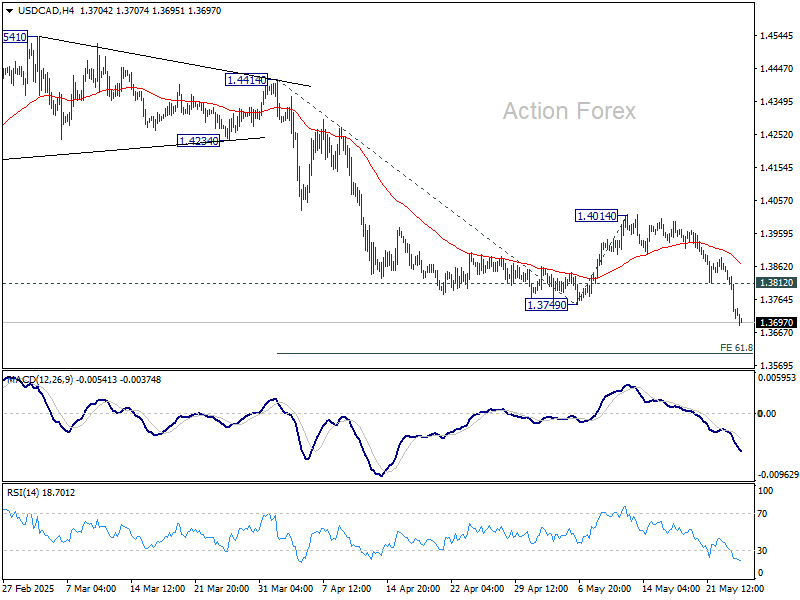
In the bigger picture, price actions from 1.4791 medium term top could either be a correction to rise from 1.2005 (2021 low), or trend reversal. In either case, further decline is expected as long as 1.4014 resistance holds. Next target is 61.8% retracement of 1.2005 (2021 low) to 1.4791 at 1.3069.
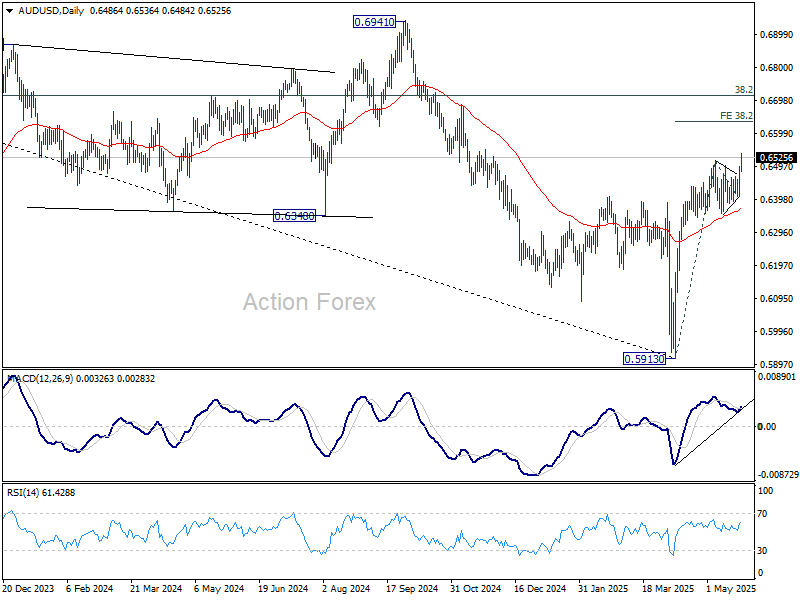
AUD/USD Daily Report
Daily Pivots: (S1) 0.6437; (P) 0.6468; (R1) 0.6527; More...
AUD/USD's rise from 0.5913 resumed by breaking through 0.6513 resistance today. Intraday bias is back on the upside for 38.2% projection of 0.5913 to 0.6513 from 0.6406 at 0.6635. For now, outlook will stay bullish as long as 0.6406 support holds, in case of retreat.
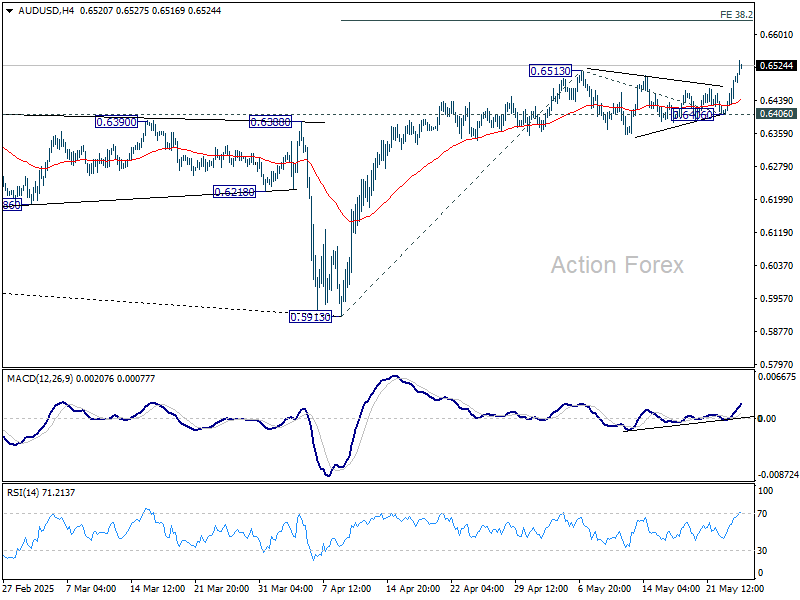
In the bigger picture, 55 W EMA (now at 0.6439) is considered taken out. A medium term bottom should already be in place at 0.5913. Rise from there could either be a corrective move, or reversing whole down trend from 0.8006 (2021 high). In either case, further rise is now expected as long as 55 D EMA (now at 0.6372) holds. Next target is 38.2% retracement of 0.8006 to 0.5913 at 0.6713.