

Sample Category Title
XAU/USD Is Resisted By 100-Hour SMA
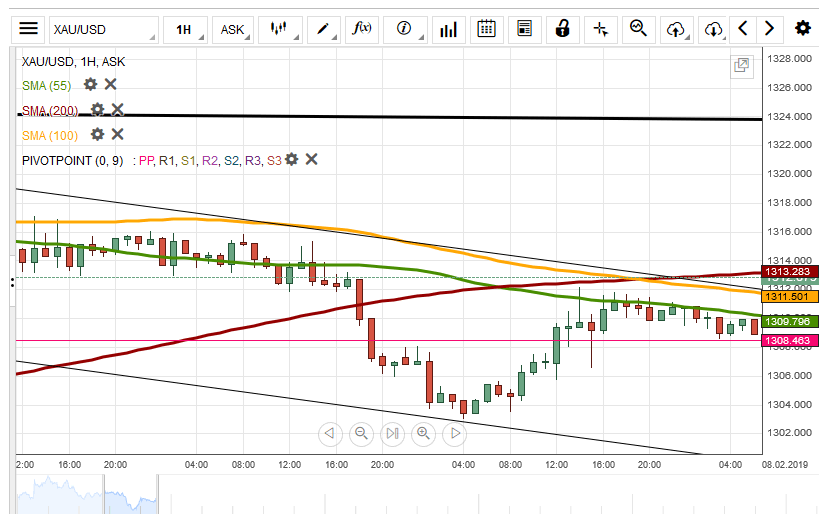
During Thursday's trading session, the yellow metal broke the resistance of the monthly pivot point at 1,308.46 to end the trading session at 1,309.46. On Friday morning, the gold was resisted by the 100-hour simple moving average at the 1,309.83 mark.
In regards to the near-term future, it is expected that the 100-hour simple moving average will continue retracing the rate to push it to trade sideways at the 1,310.00 level.
On the other hand, the support level of the monthly pivot point at the 1,308.46 mark could support the yellow metal to break the resistance of the 100-hour to trade at 1,312.00
UK PM May to meet Irish PM Varadkar to seek legally binding change to Brexit deal
UK Prime Minister Theresa May will meet Irish Prime Minister Leo Varadkar in a dinner today. May would make use of the opportunity to press for legal binding changes to Irish backstop arrangement in the Brexit withdrawal agreement.
May's spokesman said "This is about building on the discussions that she had in Northern Ireland and in Brussels yesterday. She will be emphasizing what we are looking for - seeking the legally binding changes to the Withdrawal Agreement that parliament says it needs to approve the deal."
BTC/USD 4H Chart: Trading Sideways
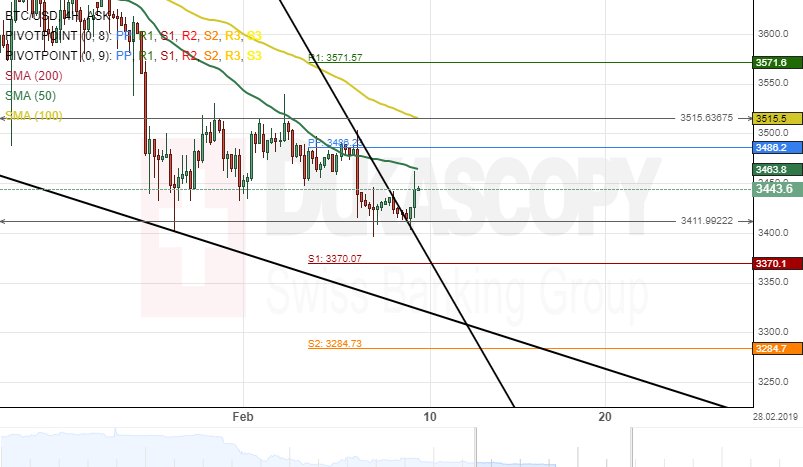
The Bitcoin cryptocurrency has been moving sideways against the US Dollar since January 29. The pair was trading between the upper and lower boundaries of a horizontal channel.
As for the near future, it is likely that the BTC/USD currency pair continues its movement down. The potential target for the blockchain will be near a traditional weekly support level at 3370.1.
However, it is expected that the pair aims for a re-test of the 50-hour simple moving average at 3464.8 during the following trading session
ETH/USD 4H Chart: Pressure By 50-Hour SMA
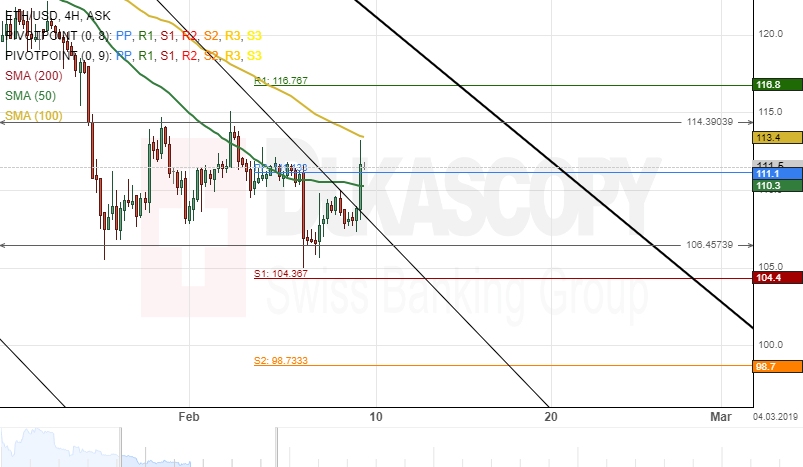
The Ethereum cryptocurrency has been trading between the upper and lower boundaries of a horizontal channel for the past week. The 50-hour simple moving average was providing resistance for the pair at 110.3 during the previous trading sessions.
Everything being equal, it is likely that the 50-hour SMA could push the cryptocurrency towards a support level at 104.36.
However, given that the ETH/USD pair is located near the upper boundary of a descending channel pattern, a breakout could be expected within this session.
WTI Oil Outlook: Oil Price Remains Pressured But Key Supports Still Hold
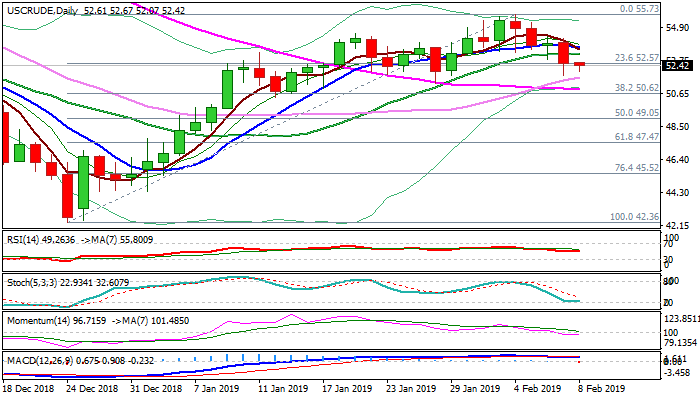
WTI oil ticked lower on Friday but holds above Thursday’s low at $51.78, posted after nearly 2.5% daily fall.
Oil remains at the back foot following double-failure at pivotal $55.55 Fibo barrier (38.2% retracement of $76.88/$42.36 descend), with negative sentiment being boosted by growing worries about global economic slowdown that offsets positive impact from OPEC-led production cut.
Bearish momentum is rising on daily chart and along with 5/10/20SMA’s in bearish setup, adds to negative tone.
Bears approach important supports at $51.69 (30SMA) and $51.32 (28 Jan higher low) violation of which would expose more significant 55SMA ($50.92) and Fibo 38.2% of $42.36/$55.73 ($50.62), violation of which would generate reversal signal and risk deeper pullback.
Easing from $55.73 high (04 Feb) so far looks like deeper consolidation before bulls resume, however, the contract is on track for strong bearish weekly close which would weaken the structure.
Also, pullback cracked 200WMA ($52.35) which contained dips in past two weeks and weekly close below would add to negative outlook.
Broken 20SMA ($53.20) is expected to cap and maintain bearish near-term bias.
Res: 52.67, 53.20, 53.63, 54.28
Sup: 52.07, 51.69, 51.32, 50.92
EURUSD Under Bearish Attack
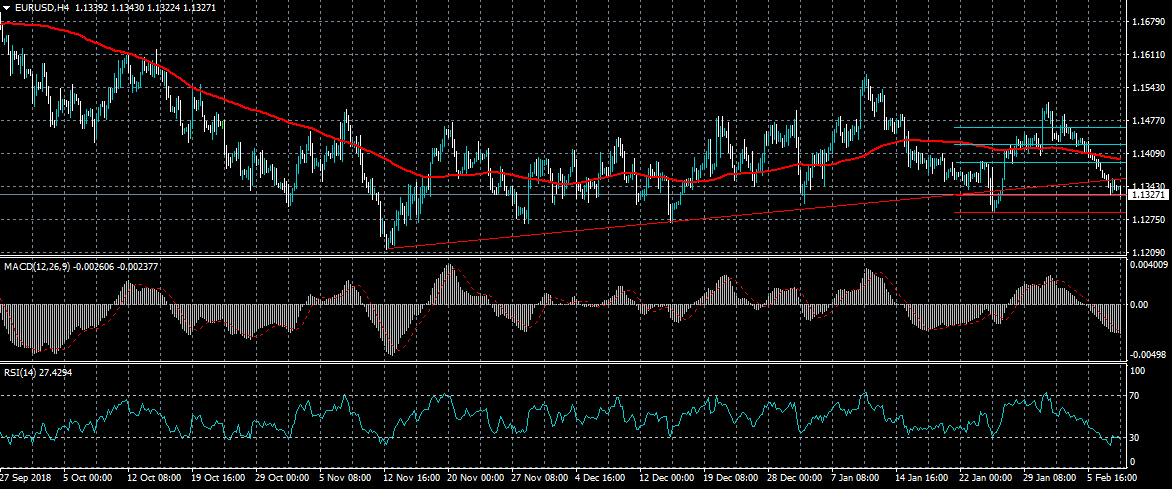
The euro has fallen to a fresh monthly trading low against the US dollar during the European trading session, as German bond yields come under pressure. If sellers can break the 1.1300 level, the 1.1280 level is the next major support area to watch. The RSI indicator on the four-hour time frame shows that the EURUSD pair has reached extreme oversold conditions on the four-hour time frame.
The EURUSD pair is heavily bearish while trading below the 1.1300 level, key technical support is found at the 1.1280 and 1.1215 levels.
If the EURUSD pair moves above the 1.1360 level, buyers may test towards the 1.1390 and 1.1410 resistance levels.
USDJPY Bulls Still In Charge
The US dollar is trading in a narrow range against the Japanese yen currency on Friday, although the overall bullish bias in the USDJPY pair remains intact as price still trades comfortably above the 109.60 level. The bullish inverted head and shoulders pattern on the four-hour time frame is also still valid. Traders should be cautious, as bearish MACD price divergence may be forming across the lower time frames.
The USDJPY pair is bullish while trading above the 109.600 level, key technical resistance is found at the 110.00 and 110.40 levels.
If the USDJPY pair moves under the 109.60 level, sellers may test towards the 109.30 and 109.14 support levels.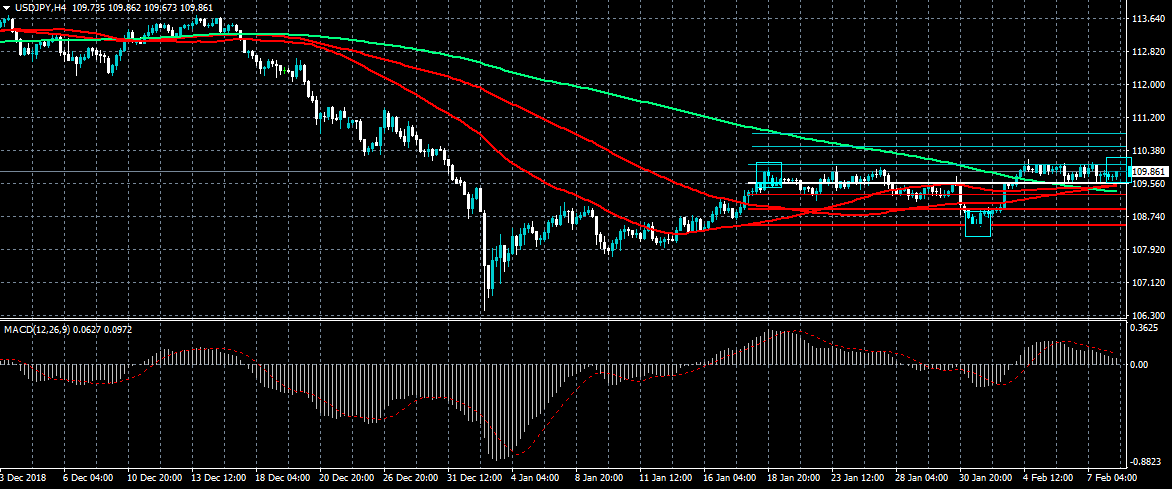
USDCHF Surpasses 1.0000 Critical Level, Remains Above SMAs Bullish Cross
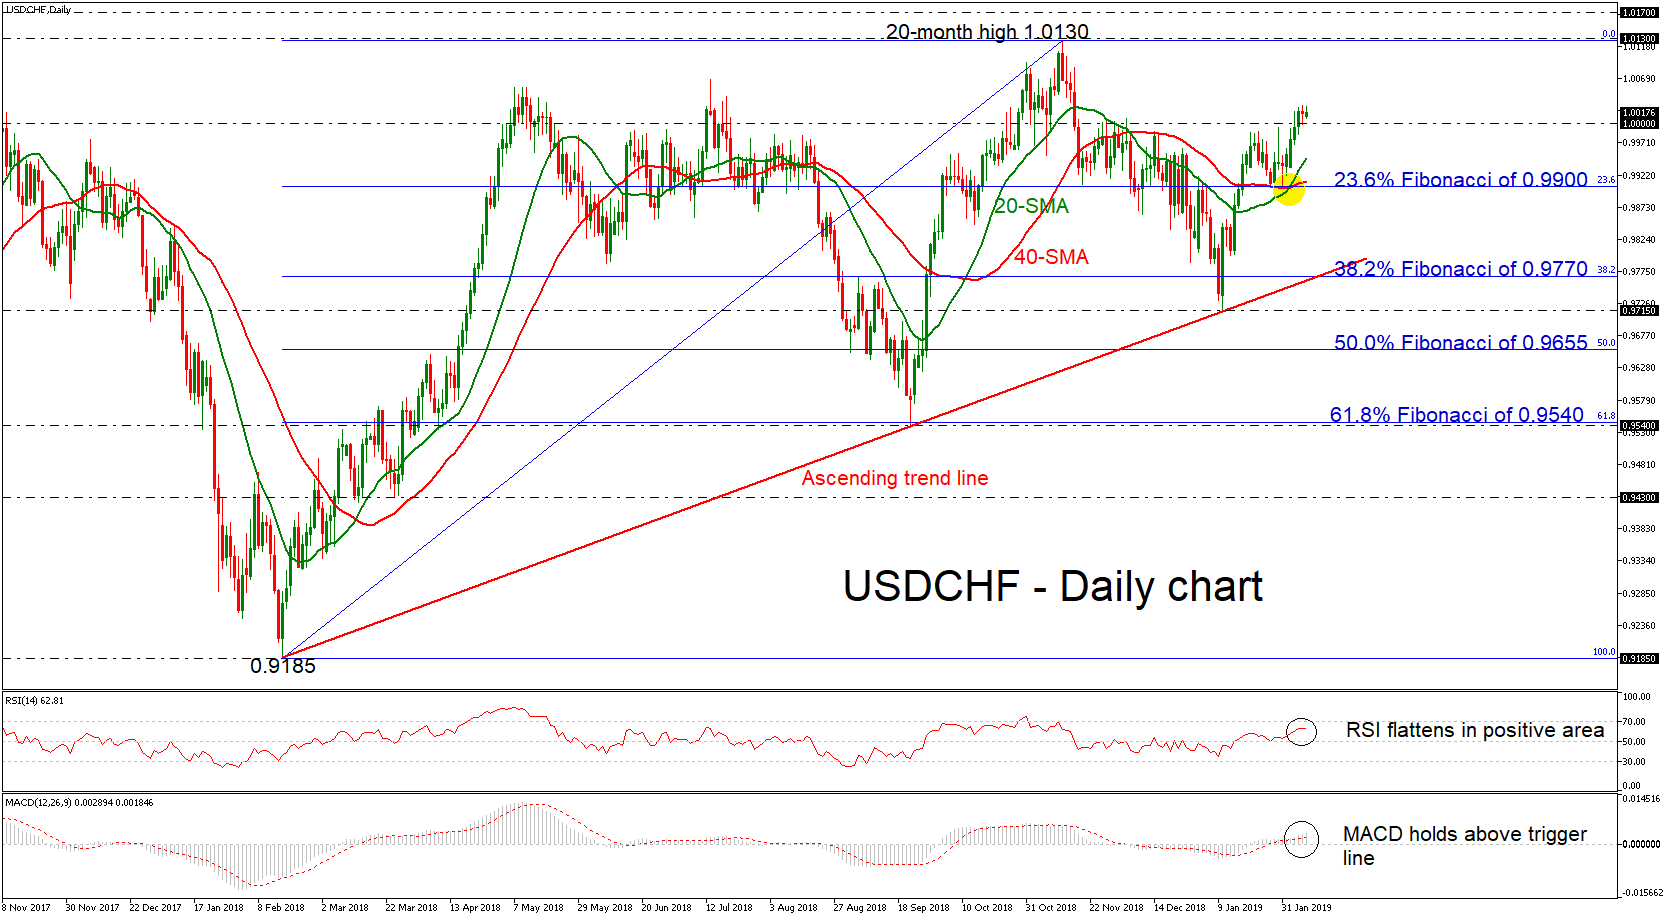
USDCHF has moved considerably higher after the bounce off the 0.9715 support zone, which overlaps with the ascending trend line. The price returned back above the 1.0000 strong psychological level and seems promising for further bullish structure.
Having a look at the momentum indicators, the RSI lies in the positive territory but is flattening, while the MACD oscillator climbed above the trigger line, indicating upside tendency. Moreover, the 20- and 40-simple moving averages (SMAs) recorded a bullish cross in the previous sessions around the 23.6% Fibonacci of the upleg from 0.9185 to 1.0130, near 0.9900.
Should the pair continue to head higher the next level to have in mind is the 20-month high of 1.0130, where it topped on November 13. A break above this level would open the door for higher high in the daily chart near the 1.0170 resistance level, registered on March 2017.
On the flipside, if the price tumbles below the 1.0000 handle, it could find support on the 20-day SMA currently at 0.9950. More losses could send the bears until the 23.6% Fibonacci of 0.9900 before edging sharply lower towards the 38.2% Fibonacci mark of 0.9770.
In the long-term, the outlook should remain bullish if the price continues the bullish move as it stands above the significant diagonal line, which has been holding since February 2018.
German FM Scholz: Irish backstop is not a trick to trap UK in EU
German Finance Minister Olaf Scholz emphasized today that Irish backstop is not a "trick" to keep UK trapped in the European Union. He said "anyone who trusts the agreement, it is not invented to avoid Brexit.. It is just done to keep the peace." And, the backstop could be taken without thinking this is a trick how to keep them in the European Union for all time. This is not true... no one is trying to cheat someone here."
Also Scholz said Germany doesn't want to engage in a trade war with the US. He criticized that "increasing tariffs is not a good idea" and "I hope things like this could be avoided." He added that "The best thing we can do for growth and wealth is rules-based free trade. I hope that we will have a better situation so that we can get again more global trade agreements."
The Analytical Overview Of The Main Currency Pairs
The EUR/USD currency pair
Technical indicators of the currency pair:
Prev Open: 1.13611
Open: 1.13383
% chg. over the last day: -0.21
Day's range: 1.13320 – 1.13439
52 wk range: 1.1214 – 1.2557
EUR/USD remains in a bearish mood. Yesterday EUR updated the local minimums again. Right now the quotes are consolidating. The local support and resistance levels are 1.13250 and 1.13450 respectively. The trading relationships between the US and China are once again on the edge. The EU worsened the expectations for 2019. The currency pair has prospects for further descend. You should seek market entry points at the key levels.
The Economic News Feed for 08.02.2019 is calm.
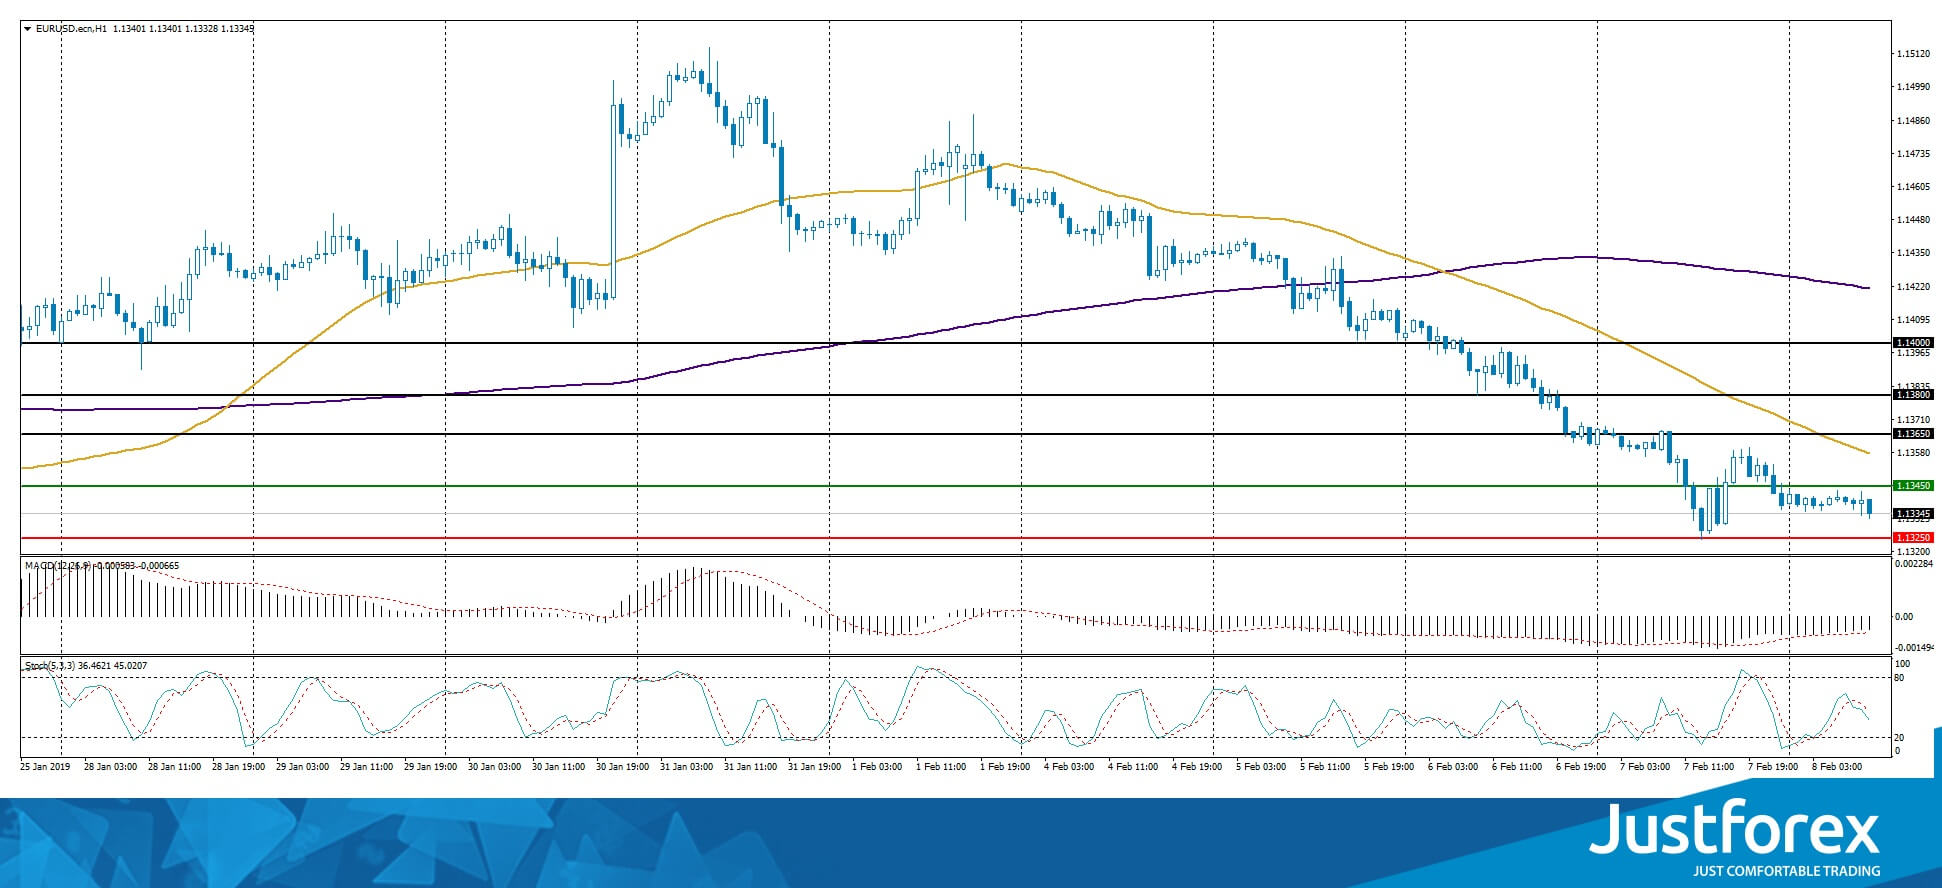
The price fixed below 50 MA and 200 MA which points to the power of the buyers.
The MACD histogram is in the negative zone but above the signal line which gives a weak signal to sell EUR/USD.
The Stochastic Oscillator is in the neutral zone, the %K is below the %D line which points to bearish mood.
Trading recommendations
Support levels: 1.13250, 1.13000, 1.12500
Resistance levels: 1.13450, 1.13650, 1.13800
If the price fixes below 1.13250 expect the further descend toward 1.13000-1.12750.
Alternatively, the quotes can correct toward 1.13750-1.14000.
The GBP/USD currency pair
Technical indicators of the currency pair:
Prev Open: 1.29296
Open: 1.29480
% chg. over the last day: +0.11
Day's range: 1.29251 – 1.29582
52 wk range: 1.2438 – 1.4378
Yesterday GBP/USD had shown a lot of trading activity and volatility. As expected, the Bank of England kept the key interest rate at 0.75%. The regulator worsened the UK economic growth forecast. At the same time, the Bank does not exclude slow growth of the interest rates should the Brexit succeed. Right now the quotes are consolidating around 1.29250-1.29650. You should open positions from these levels.
The Economic News Feed for 08.02.2019 is calm.
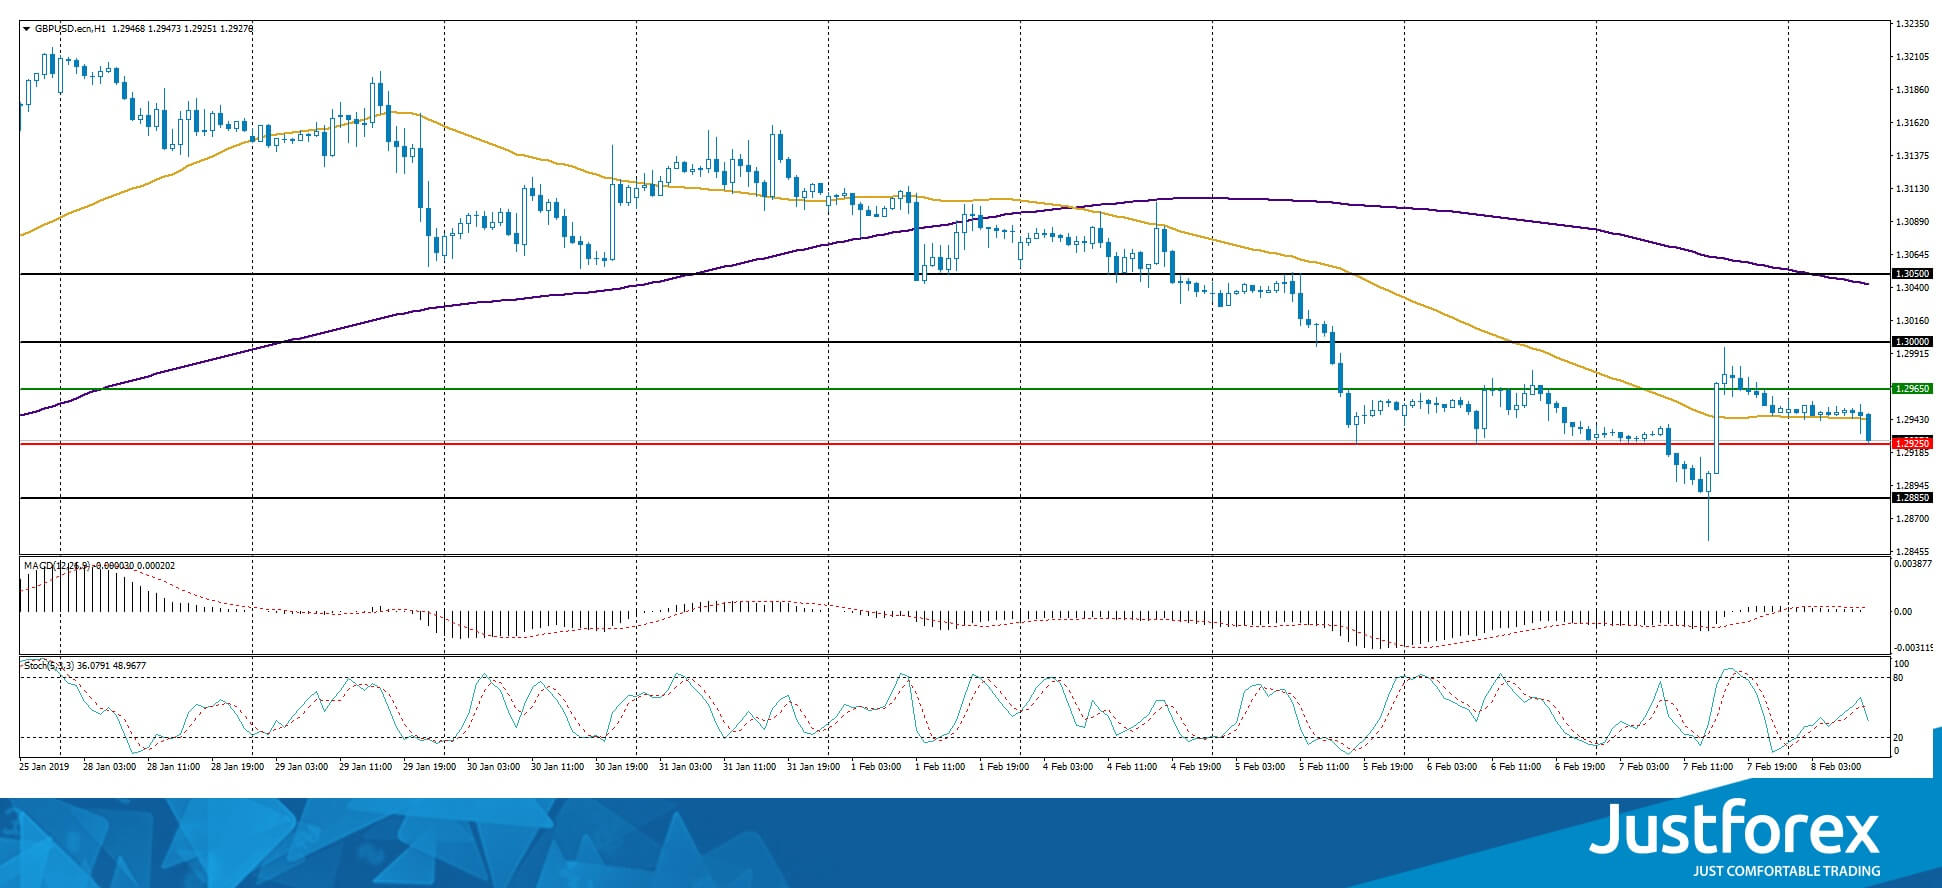
The indicators do not provide precise signals, the price has crossed 50 MA.
The MACD histogram is close to 0.
The Stochastic Oscillator is in the neutral zone, the %K line is crossing the %D line. There are no signals at the moment.
Trading recommendations
Support levels: 1.29250, 1.28850
Resistance levels: 1.29650, 1.30000, 1.30500
If the price fixes below 1.29250 consider selling GBP/USD. The movement will tend toward 1.28850-1.28500.
Alternatively, the price can recover toward 1.30000.
The USD/CAD currency pair
Technical indicators of the currency pair:
Prev Open: 1.32099
Open: 1.32979
% chg. over the last day: +0.74
Day's range: 1.32978 – 1.33291
52 wk range: 1.2248 – 1.3664
Yesterday USD/CAD started to show a positive dynamic. The CAD is weakened against the USD by more than 100 points. The trading instrument updated the key extremums. The quotes are testing the range of 1.32850-1.33250. The currency pair has good growth prospects. An addtional pressure on the CAD is caused by the poor oil quotes dynamics.
At 15:30 (GMT+2:00) Canada will publish a Labour Market report.
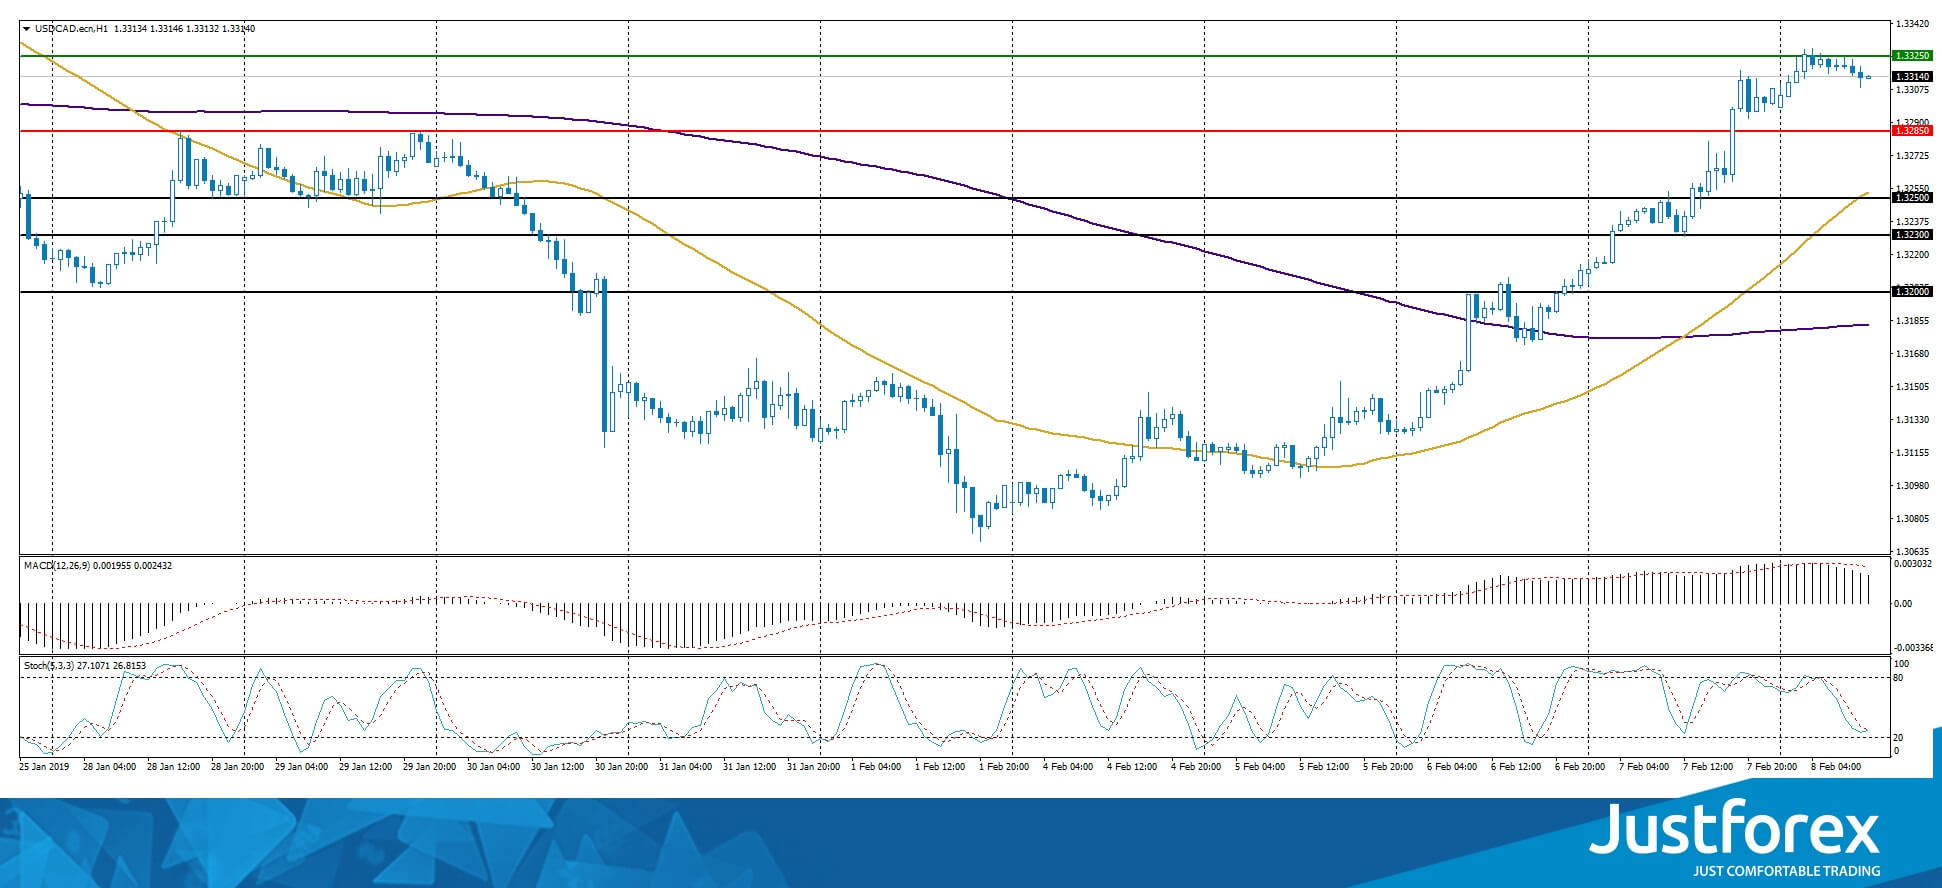
The price fixed above 50 MA and 200 MA which shows the power of the buyers.
The MACD histogram is in the positive zone but below the signal line which gives a weak signal to buy USD/CAD.
The Stochastic Oscillator is in the neutral zone, the %K line is crossing the %D line. There are no signals at the moment.
Trading recommendations
Support levels: 1.32850, 1.32500, 1.32300
Resistance levels: 1.33250, 1.33600
If the price fixed above the local resistance of 1.33250, expect the quotes to grow further. The movement will tend toward 1.33600-1.33800.
Alternatively, the quotes can descend toward 1.32600-1.32400.
The USD/JPY currency pair
Technical indicators of the currency pair:
Prev Open: 109.964
Open: 109.790
% chg. over the last day: -0.20
Day's range: 109.648 – 109.898
52 wk range: 104.56 – 114.56
The safe haven currency keeps moving sideways. There is no single defined trend. The local levels are 109.550-109.700 and 110.000-110.150. The demand for the safe assets remains due to Washington/Beijing trading dispute. Keep an eye on it and open positions from the key levels.
The Economic News Feed for 08.02.2019 is calm.
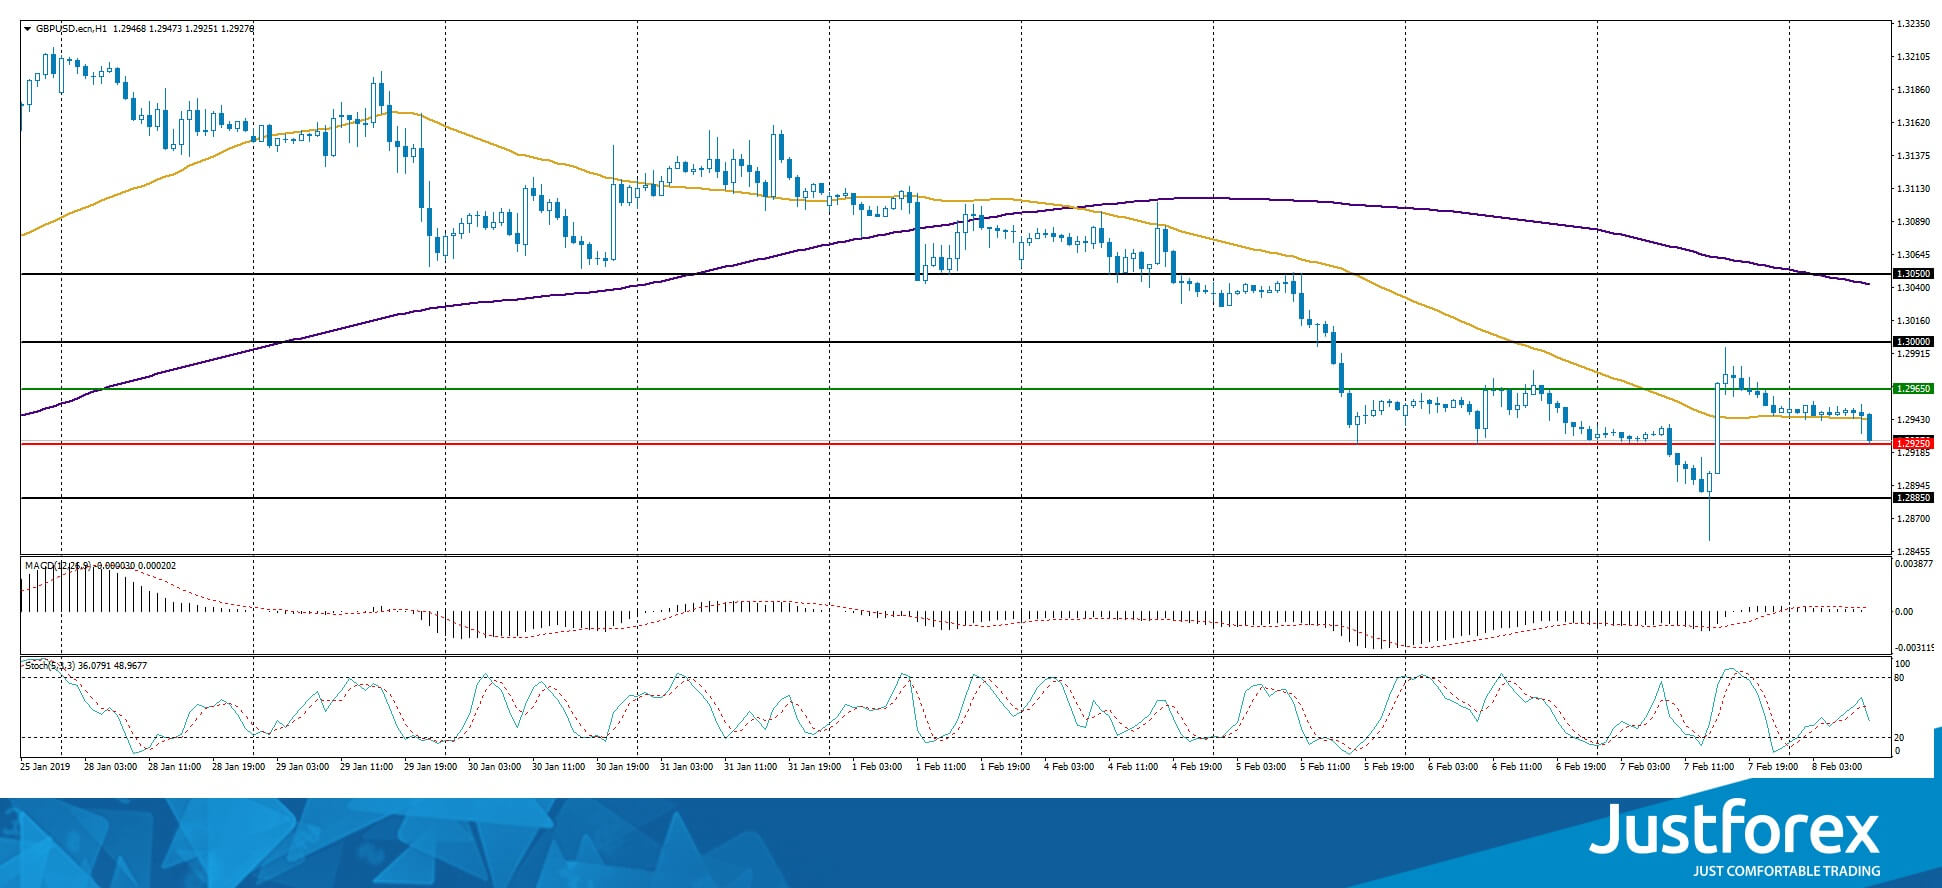
The indicators do not provide precise signals, the price has crossed 50 MA.
The MACD histogram is close to 0.
The Stochastic Oscillator is in the neutral zone, the %K line is above the %D line, which gives a signal to buy USD/JPY.
Trading recommendations
Support levels: 109.550, 109.200, 109.000
Resistance levels: 110.000, 110.150, 110.500
If the price fixes above 110.150 expect the quotes to grow toward 110.500-110.700.
Alternatively the quotes can correct toward 109.400-109.200.