

Sample Category Title
CFTC Commitments of Traders- Bets on Crude Oil Fell Amid Price Slump
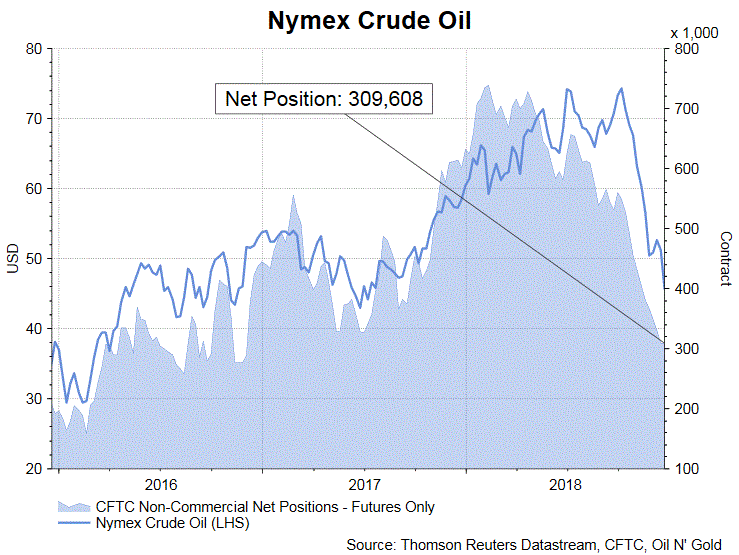
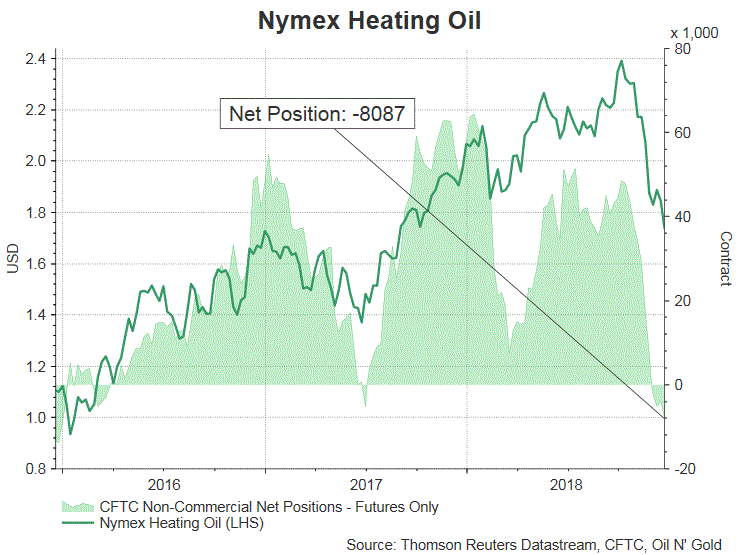
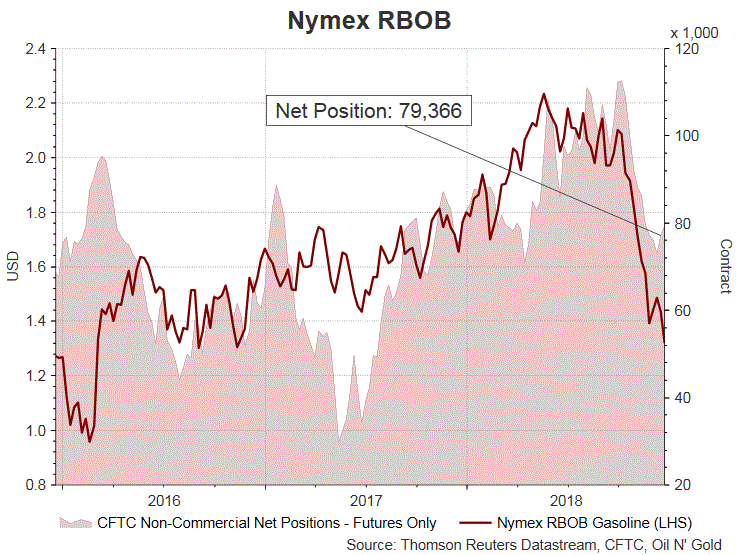
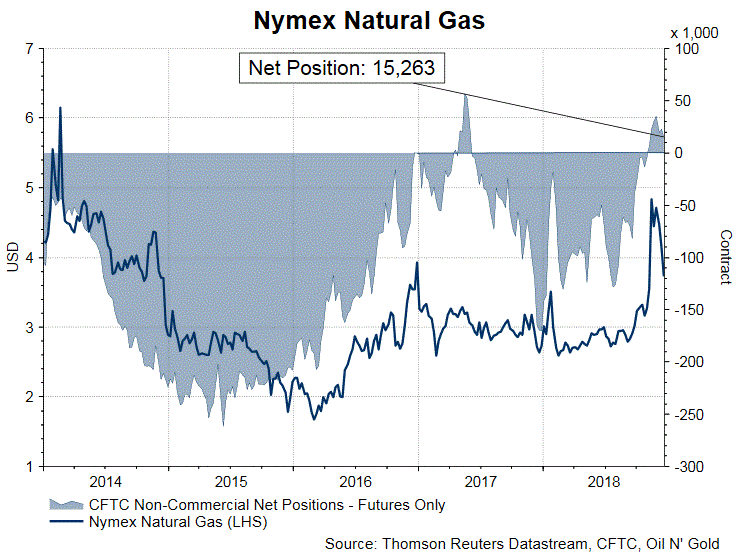
According to the CFTC Commitments of Traders report for the week ended December 18, NET LENGTH for crude oil futures climbed modestly higher as the decline in speculative short positions outweighed that in long positions. NET LENGTH added +102 contracts to 309 608 contracts for the week. Both crude oil benchmarks remained under pressure during the reporting week. The front-month WTI contract tumbled -10.47% while the Brent contract plunged -6.54%. For refined oil products, NET LENGTH for gasoline gained +2 228 contracts to 79 366, while NET SHORT for heating oil gained +4 148 contracts to 8 087 contracts for the week. The front-month Nymex contract for gasoline declined -6.2% while heating oil was down -5.05%. NET LENGTH for natural gas futures declined -7 621 contracts to 15 263 contracts for the week. Yet, bets for longs and shorts soared for the week. The Nymex contract dived -12.91% for the week.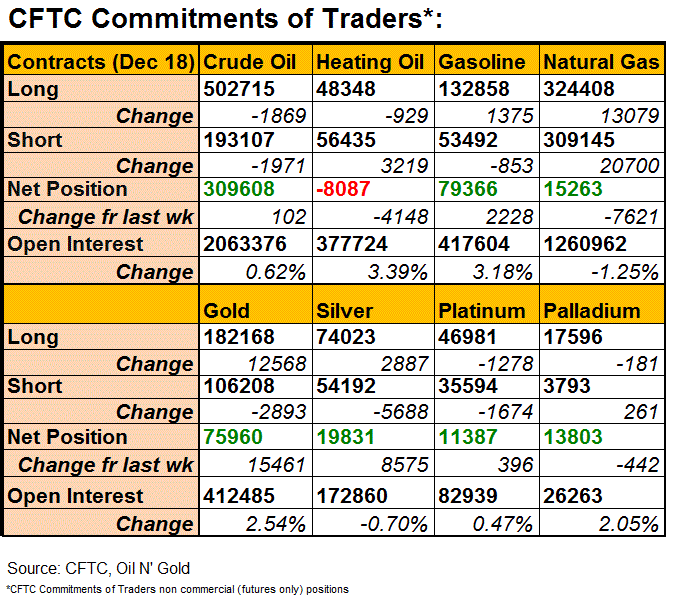
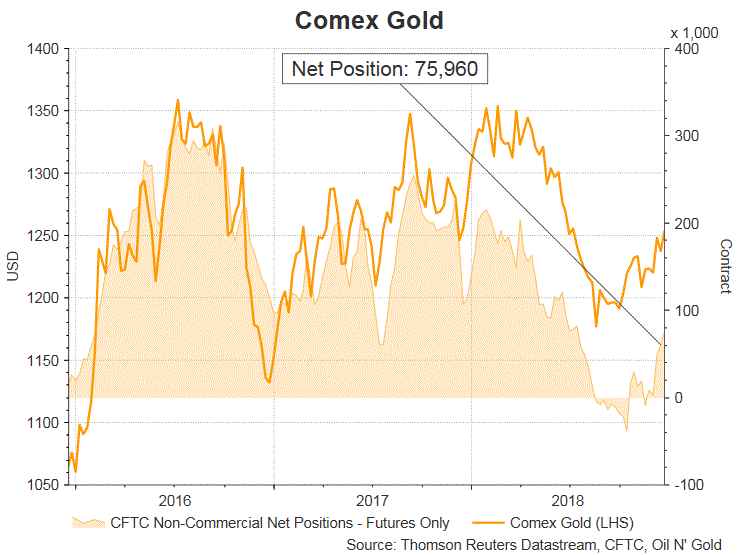
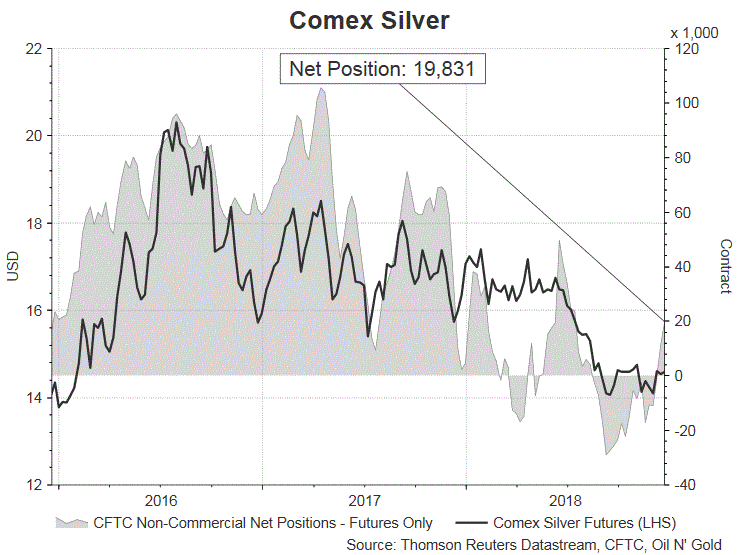
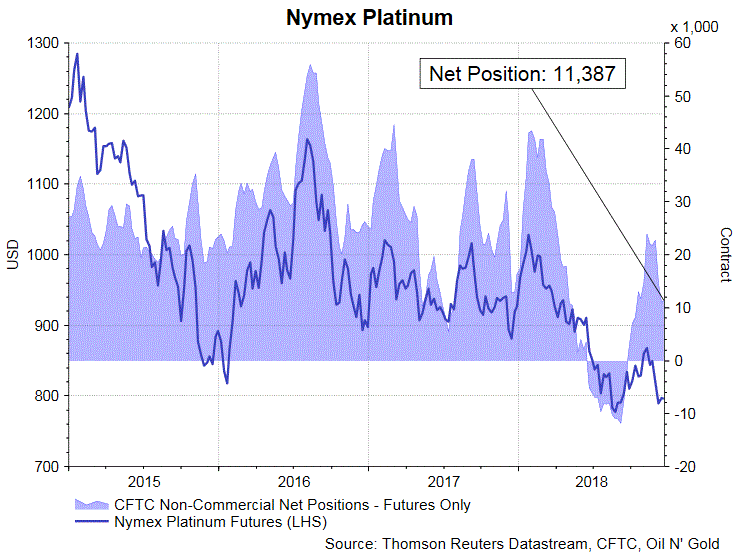
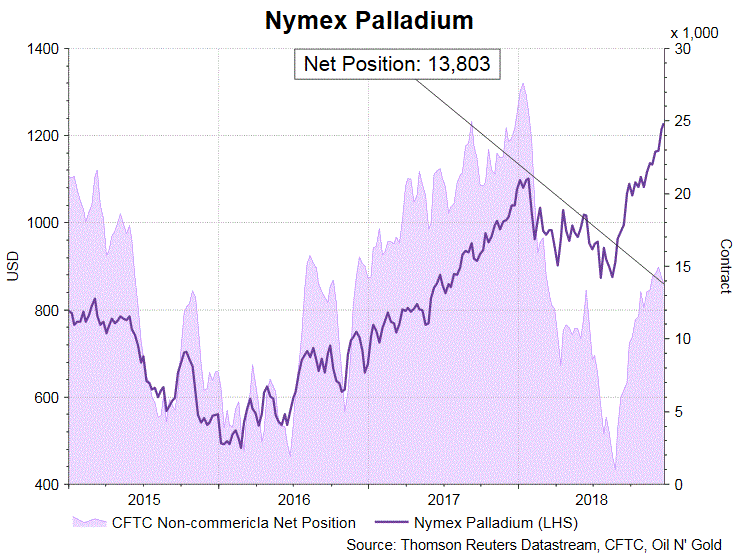
On the precious metal complex, NET LENGTH for both gold and silver futures gained last week. for the former, speculative long positions jumped -12 568 contracts, while shorts slipped -2 893, resulting in an increase in NET LENGTH, by +15 461 contracts, to 75 960 contracts. The benchmark Comex contract added +0.59% during the week in concern. For silver futures, speculative long positions added +2 887 contracts while shorts dropped -5 688. These resulted in a rise in NET LENGTH, by +8 575 contracts, to 19 831 contracts. For PGMs, NET LENGTH of Nymex platinum futures added +396 contracts to 11 387 while that for palladium slid -442 contracts to 13 803.
Forex Forecast and Cryptocurrencies
First, a review of last week's events:
EUR/USD. Despite the fact that, on the eve of the US Federal Reserve interest rate increase, 70% of experts, supported by 100% indicators, expected the dollar to strengthen, nothing of the kind happened. The euro was growing for the whole week, approaching on Thursday the last eight weeks' high at the height of 1.1485.
At the time the rate increase from 2.25% to 2.5% was announced, the dollar managed to win back a modest 85 points, but this victory turned out to be temporary. At his press conference, Fed Chairman Jerome Powell said that there would hardly be three rates increases in 2019, and that, in a better case, there would be only two. And according to US Secretary of the Treasury Stephen Mnuchin, if inflation remains low, there may be no rate increases next year. But no one expects unity within the team of President Trump and the Fed, or within the Fed either. In 2019, only two FOMC members see the rate at 2.5%, six at 2.75%, four at 3.25%, three at 3.30%, and two members of the Open Market Operations Committee would like it to be 3.6%!
As for the results of the week, after the release on Friday, December 21, of a whole package of data on the US economy, the pair returned to the central zone of the eight-month side channel and stopped at 1.1370;
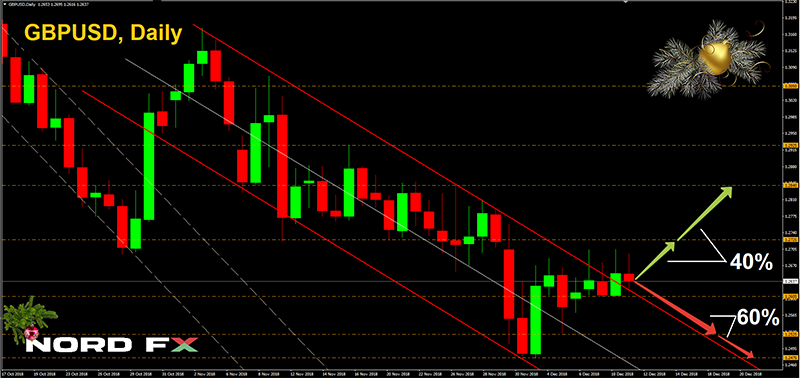
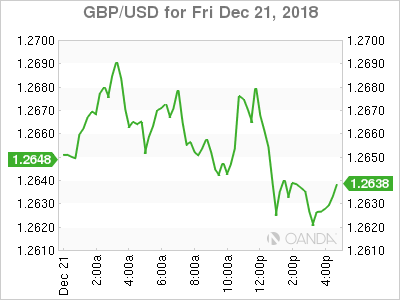
GBP/USD. As expected, neither the economic data published on Wednesday nor the decisions of the Bank of England on Thursday presented any surprises. Back on Tuesday, December 18, the pair moved to lateral movement in channel 1.2605-1.2705, where it remained until the end of the week, having met its finish at 1.2630;
USD/JPY. Last week, the US dollar dropped significantly, not only against the euro. The DXY U.S. Dollar Index, which tracks the US currency against a basket of other major currencies, fell on Thursday to an eight-week low of 95.73. Its fall against the Japanese yen was particularly impressive, the yen won around 260 points against the dollar by Thursday. Experts say that the main reasons for such a jump are sales on the stock markets and the flight of investors to the yen as a safe haven in the face of continuing tensions in trade relations between the United States and China.
Cryptocurrencies. The past week was marked by a steady growth of both the reference cryptocurrency and all major altcoins. The maximum growth of bitcoin (BTC/USD) was 33%, ethereum (ETH/USD) - 46%, litecoin (LTC/USD) - 45%, ripple (XRP/USD) - 41%. The most impressive increase, by 176%, was demonstrated by the Bitcoin Cash (BCH/USD), reaching $220 per coin at the peak. The total capitalization of the crypto market grew from $103 billion to $134 billion, that is, by 30%.
The reasons are both global, such as falling investors' interest in classic assets on world markets, and private ones, such as news on the closing of the short position, which was opened a year ago by a well-known crypto trader Mark Doe. There may be called a lot of reasons, but the main question that worries the whole crypto community is whether this weekly increase is not a short-term correction. Or is it, which is even worse, another trap, arranged by bears for the bulls?
Whatever it may be, but at the end of the week, Bitcoin buyers met strong resistance at $4,300, resulting in this cryptocurrency's fall to $4,000. And other digital assets slipped a little as well, following it.
As for the forecasts, it should be noted an error is quite often not in defining targets, but in determining the timing of their achievement. This is especially true of the coming days. The past week was the last full trading week in the past year. Next week, trading will begin only on Wednesday, December 26, and the world will celebrate the New Year during the night of Monday, December 31, to Tuesday, January 1. That is why this time we decided to discuss experts' opinions not only for the upcoming week, but also for the next month, which we hope will help traders in more accurate determination of trends and benchmarks.
EUR/USD. The weekly forecast looks like this: 40% are for the fall of the pair, 30% are for its growth and 30% have taken a neutral position. Forecast for January: 60% are for the fall, 20% are for the lateral trend and only 20% are for the strengthening of the European currency. The main targets for bears are 1.1300, 1.1265, then the December low at 1.1215. In the event of a breakthrough of this support, the pair may sink to the horizon of 1.1120 and even lower, down to the level of 1.0910. The main target for the bulls is the zone 1.1525-1.1625, after reaching which the euro will head for the heights of 1.1730 and 1.1815;
GBP/USD. Here, experts also expect the dollar to strengthen during the month and, as a result, the pair will fall. For this, 60% have voted. Supports are 1.2605, 1.2525, 1.2475 and 1.2345. Resistances are at 1.2725, 1.2840 1.2925 and 1.3050;
USD/JPY. According to 55% of analysts (weekly forecast) and 65% (monthly forecast), the pair has already approached its local bottom, and now it is waiting for a rebound upwards. The goals are 112.30, 113.15, 113.70 and 114.20. The number of those who have voted for the side trend in this case is small - about 10%. The rest of the experts have given their preference to the bears, believing that the pair is waiting for a further fall. Supports 110.80, 109.85, 109.35 and 108.65;
Cryptocurrencies. Despite their growth last week, the general mood in the crypto market is rather gloomy. More than 70% of analysts and market participants believe the current rise is purely speculative and they expect the downtrend to resume. They are still expecting bitcoin to fall to the strong zone, recorded in July-August 2018, $2,500-2,700. Moreover, such a fall may take from one to two months. The nearest support is in the $2,940-2.050 zone.
The bullish ambitions of the remaining 30% respondents look a bit more modest: they expect the BTC/USD pair to grow only to $4,800-5,200.
Stock Markets Correcting 10-Year Up Trend But Fed’s Not to Blame
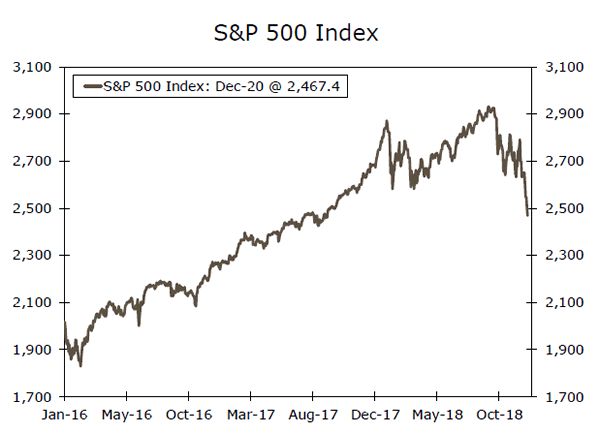
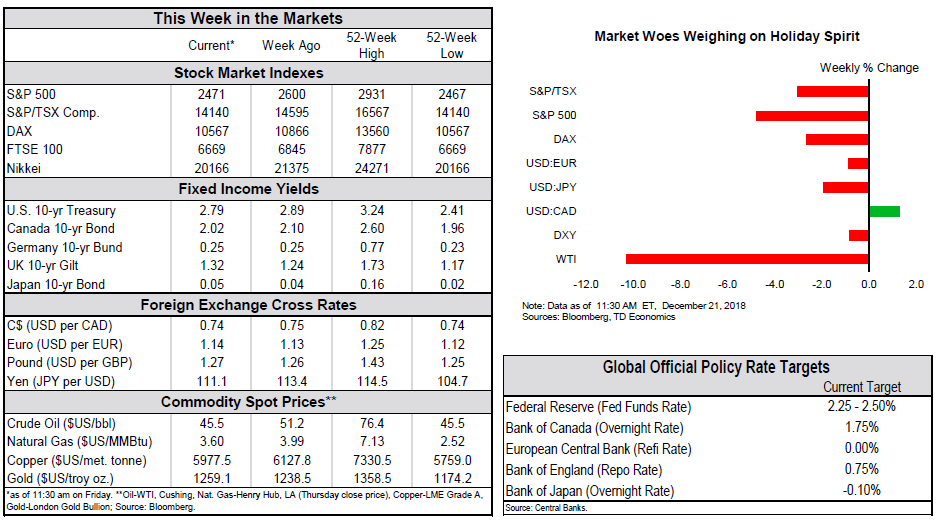
The global stock markets just turned from bad to worse last week. DOW suffered its worst week since the global financial crisis back in 2008, down the week by nearly -7%. S&P 500, down the month by -11.4%, is also on track to have its worst week since 1931, when it dropped -14.5%. Yen ended as the biggest winner on risk aversion. Australian Dollar led other commodity currencies as the weakest. Dollar, on the other hand, was mixed after Fed delivered a not that dovish rate hike. European majors might look strong, but that's only because they're not at the center of the storm.
There were many reasons cited for the global stock markets crash. Partial shut down of US government over Trump's border wall could be a reason for late downside acceleration. But it's after all a one-off event that's repeated more than once. US-China trade war is on track to have a deal in late February or early March. Fed is often cited as a bearish factor. There were even rumors that Trump has discussed firing Fed Chair Jerome "Jay" Powell after last week's hike. But as we argued below, investors have significantly pare back expectations on 2019 Fed hikes already. They're now even unsure Fed will raise interest rates again in the first half. So, reducing bet on Fed hikes yet selling stocks sounds rather non-trivial.
Instead, we've mentioned multiple times, the clear move from stocks to bonds, in Germany, Japan and the US, indicates investors are clearly worried about slowdown or even recession. Germany 10 year bund yield closed at 0.25. That's lowest level since the spike low at 0.186 in May. Excluding that one day spike, Germany 10 year yield closed at the lowest level since June 2017. Japan 10 year JGB yield dropped to as low as 0.014 before closing at 0.040. The low was the lowest since September 2017. And it hit as high as 0.166 just back in early October.
Fed delivered dovish rate hike, but was that dovish enough?
FOMC announcement last week was clearly a dovish shift overall. But, whether investors saw that as dovish enough, it's another question. In short, Fed raised federal funds rate by 25bps to 2.25-2.50% as widely expected. The clearly dovish part is in the economic projections. Firstly, median longer run federal funds rate, which is see as Fed's neutral, was revised down from 3.0% to 2.8%. For 2019, median federal funds rate was revised to 2.9%, down from 3.0%. Central tendency was revised to 2.5-3.0%, down from 2.8-30%. As we noted during the week, it suggested that Fed might only have one or at most two more rates hikes in 2019. That's indeed echoed by New York Fed President John Williams's comment that "something like two rate increases would make sense in a really strong economy going forward."
In other projections, 2019 median growth projection was revised to 2.3%, down from 2.5%. 2020 median growth projection was unchanged at 2.0%. 2019 median unemployment rate projection was unchanged at 3.5%. But 2020 median unemployment rate projection was revised to 3.6%, up from 3.5%. 2019 median core PCE projection was revised to 2.0%, down from 2.1%. 2020 median core PCE projection was revised to 2.0%, down from 2.1%.
The not so dovish parts were that Fed maintained in the statement that "some further gradual increases" in federal funds rate will be consistent with sustaining the expansion and keeping inflation near target. Fed Chair Jerome Powell, while admitting that global growth is "softening", also said "policy does not need to be accommodative" as the US economy continues to perform well.
Some commentators and analysts put the blame of the stock market crash on Fed. But judging from the reactions in fed fund futures, we believe markets have taken the dovish side of Fed already. And, we maintain that the fall in global stocks and treasury yields clearly indicated the worries on slowdown, or even recession. And in the highly interconnected world nowadays, trouble elsewhere doesn't mean the US is winning. Eventually, the world moves together.
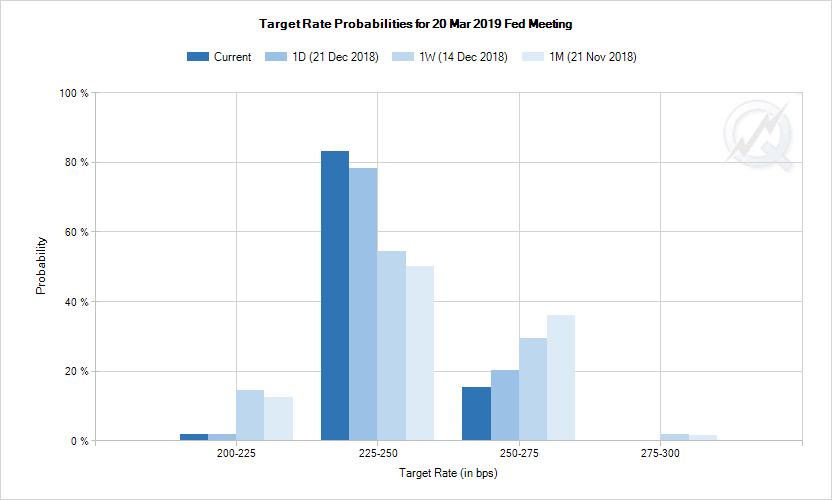
As of now, fed funds futures are pricing in only around 15% chance of a rate hike by 25bps to 2.50-2.75% in March. That's sharply lower than 31% a week ago and 37% a month ago.
However about delaying the rate hike to June? Fed funds futures are pricing around 32% chance of only 1 hike in H1 to be delivered in June. That compares to 46% a week ago and 57% a month ago.
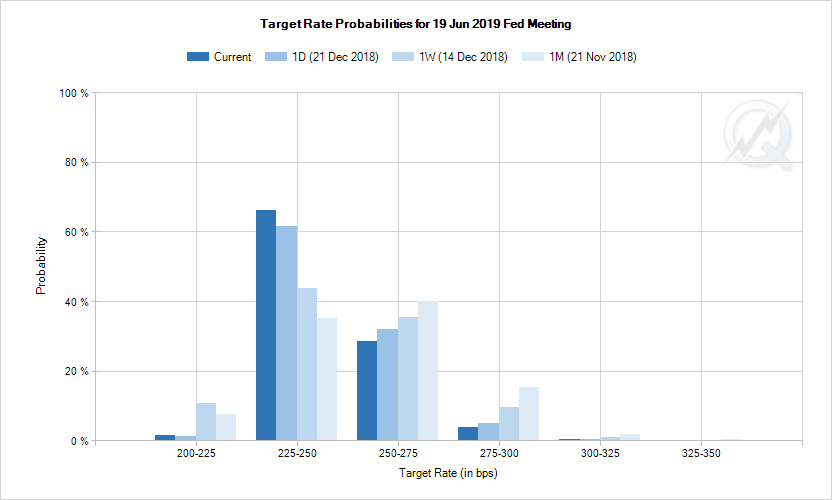
That means, investors are rather sure Fed won't hike again in March. And they're not even sure if Fed will hike again in first half. But stocks and long term treasury yields still tumbled?
US yield curves flattening accelerated, more downside at the long end
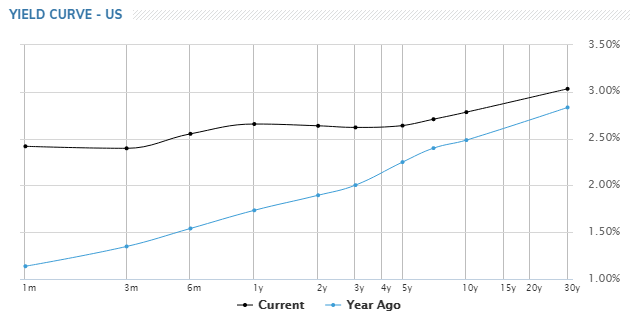
US treasury yields suffered quite notable decline while yield curve flattened rather seriously at the long end. 5-year yield dropped -0.087 over the week to 2.642. 10-year yield dropped -0.990 to 2.792. 30-year yield dropped -0.115 to 3.028. 30-year yield has indeed breached 3% handle too. Also yield curve is now inverted between 1-year (2.656) to 2-year (2.637) and 3 year (2.619).
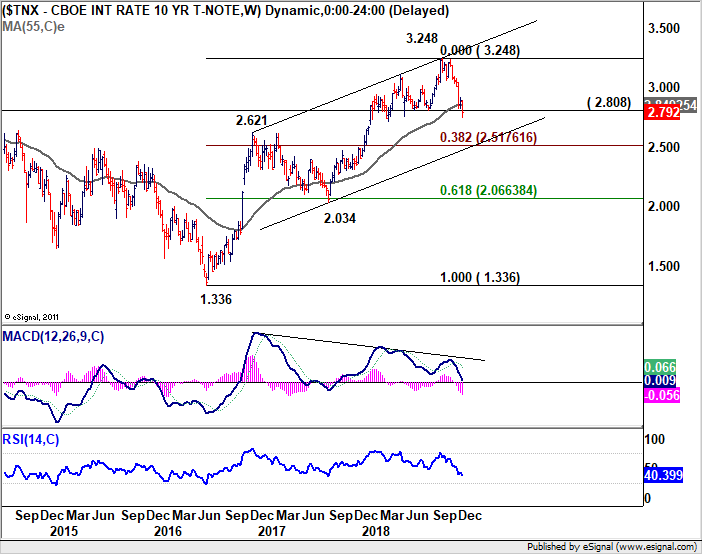
10-year yield's break of 2.808 support last week confirmed near term reversal on bearish divergence condition in daily MACD. Deeper fall expected to corrective the rise from 1.336, targeting 38.2% retracement of 1.336 to 3.248 at 2.517 (which is close to channel support at) 2.470. Given then federal funds rate target is now at 2.25-2.50%, such a "correction" is already enough to really "flatten" the yield curve.
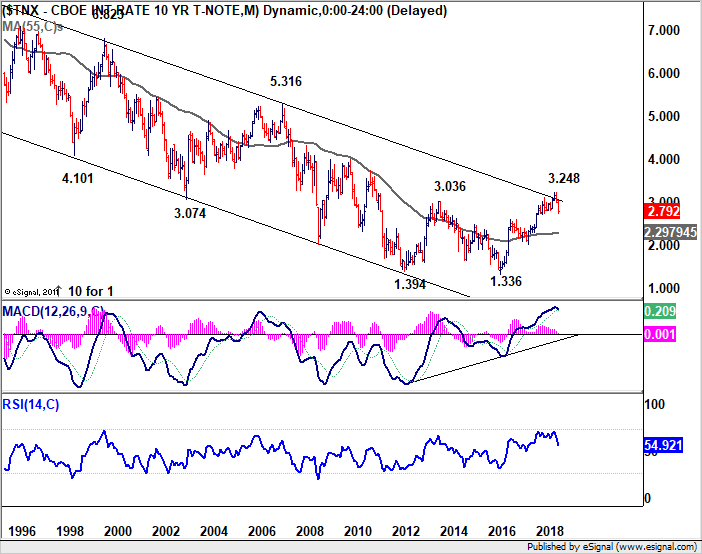
More importantly, TNX was rejected by multi-decade channel resistance. From this perspective, TNX may dip further to 55 month EMA (now at 2.297) before bottoming. And this is not unreasonable even if our favored case of multi-decade bullish reversal is true.
Are global stocks correcting the uptrend from 2009 low?
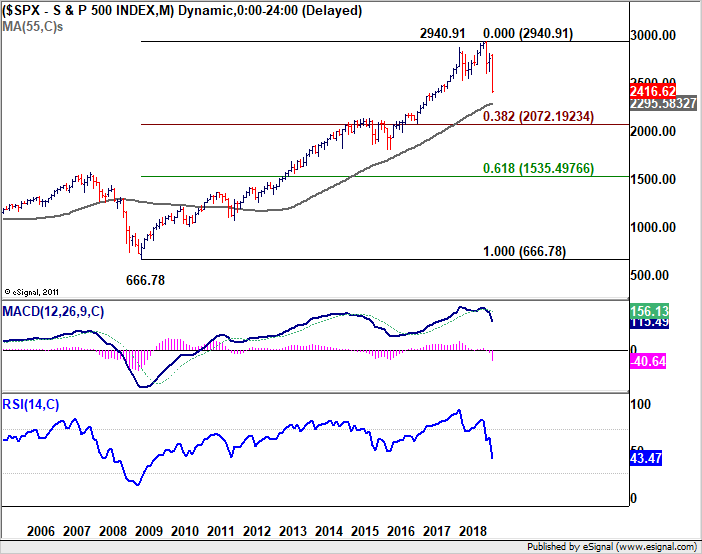
S&P 500 took out 38.2% retracement of 1810.10 to 2940.91 at 2508.94 decisively last week. While the decline was expected, the power of it surprised us. For now, the base case is that fall from 2940.91 is only correcting the uptrend from 1810.10. While further fall is likely, downside should be contained around trend line support (now at around 2300), and above 61.8% retracement at 2242 to bring reversal.
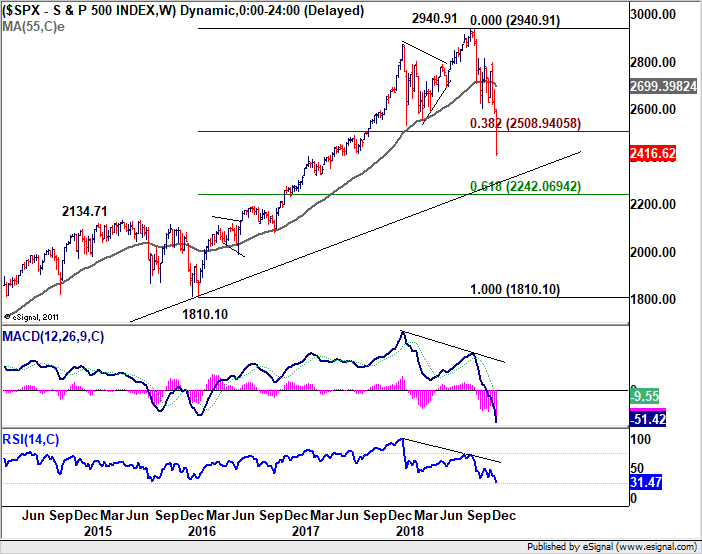
The above mentioned support is also close to 55 month EMA (now at 2295.58). So, 2300 is likely the point we see buyer coming back. However, we'd like to point out that further fall to 38.2% retracement of 666.78 to 2940.91 at 2072.19 will mean that SPX is correcting the long term up trend from 2009 to 2018. That is, something more serious is underway.
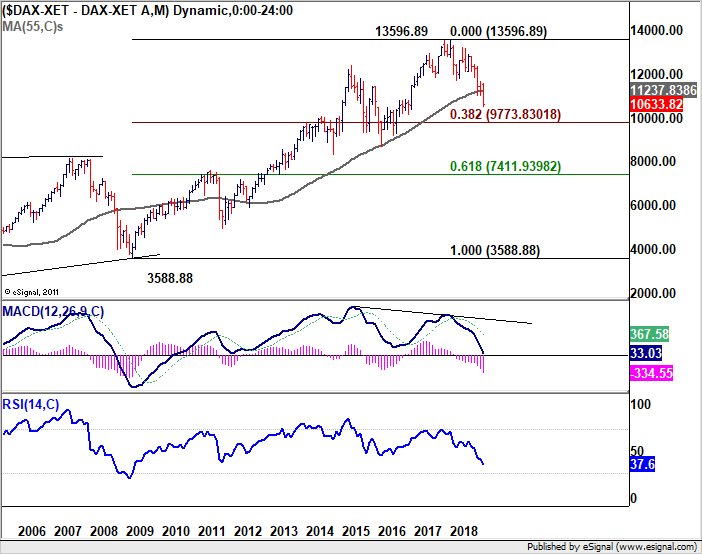
Move across the Atlantic, German DAX has actually taken out equivalent support already. 55 month EMA (now at 11237.83) was firmly broken. Fall from 13596.89 is viewed as corrective the up trend from 3588.88 (2009 low ) to 13596.89 (2018 high). It's targeting 38.2% retracement at 9773.83.
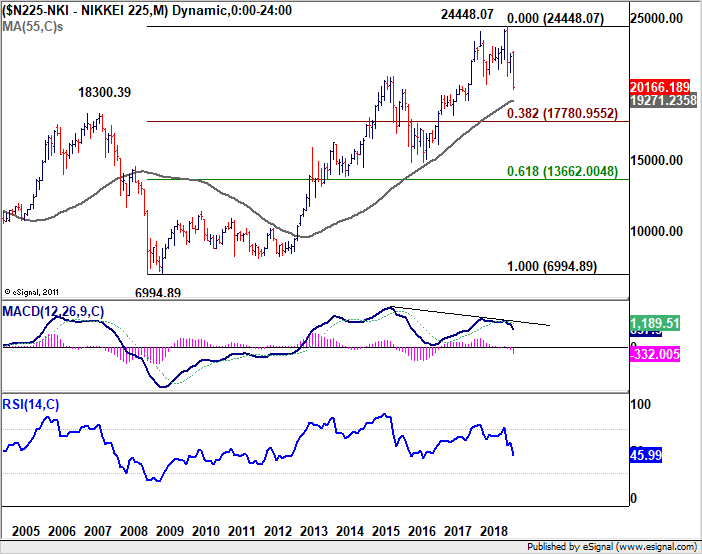
How about Japan? Nikkei is still holding well above 55 month EMA after last week's steep decline. But same as DAX, bearish divergence condition is seen in monthly MACD, which is a sign of trend reversal. We'd wait and see if it can rebound from 55 day EMA. But similar to others, firm break there will suggests that it's correcting the up trend from 2009 low of 6994.89 to 2018 high at 24448.07. 38.2% retracement at 17780.95 should then be targeted. And we'd like to point out that if that happens, with Japan and Germany in long term correction, US won't be able to escape from it.
Still no breakout in Dollar index despite all volatility
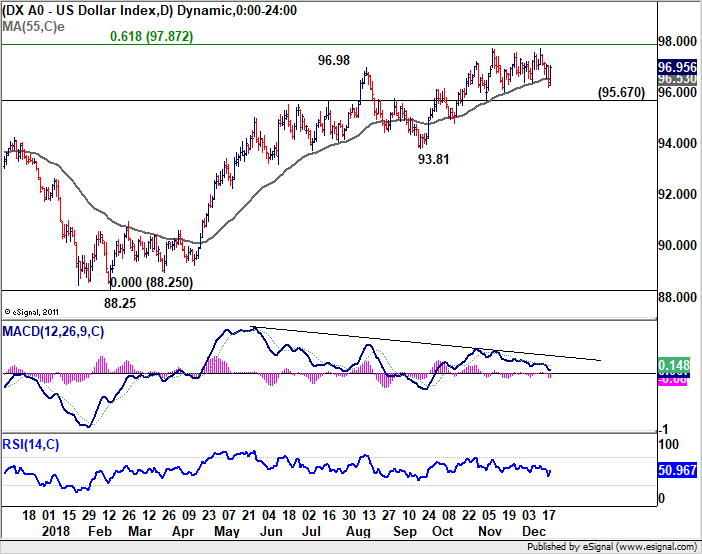
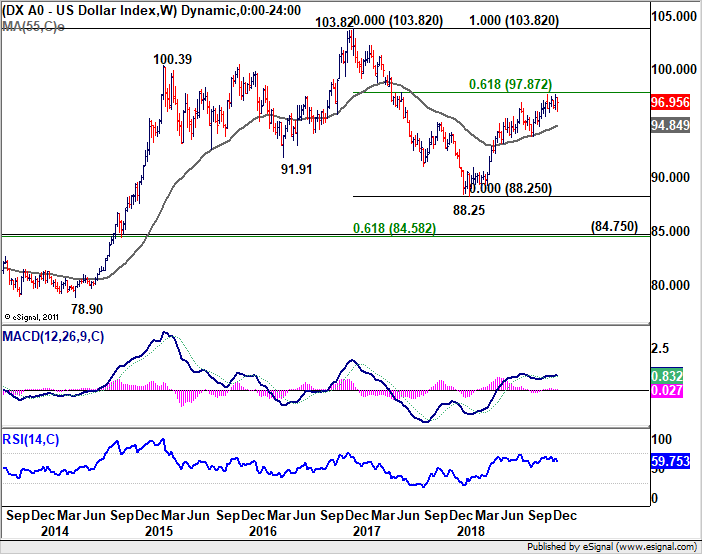
Now, let's have a look at the Dollar index. It's still holding on to 4 hour 55 day EMA, and stayed well above 95.67 support despite all the volatility. Near term outlook remains bullish. But risks of reversal is high considering bearish divergence condition in daily MACD. It's also in proximity to 61.8% retracement of 103.82 to 88.25 at 97.87. It will probably take some more time before the index commit to a direction. Break of 95.67 will be an early sign of rejection of 97.87 key fibonacci resistance. Meanwhile, sustained break of 97.87 will confirm up trend extension. But in the latter case, it's unlikely to be driven by US yields, but risk aversion.
Position trading - EUR/JPY finally falls as expected
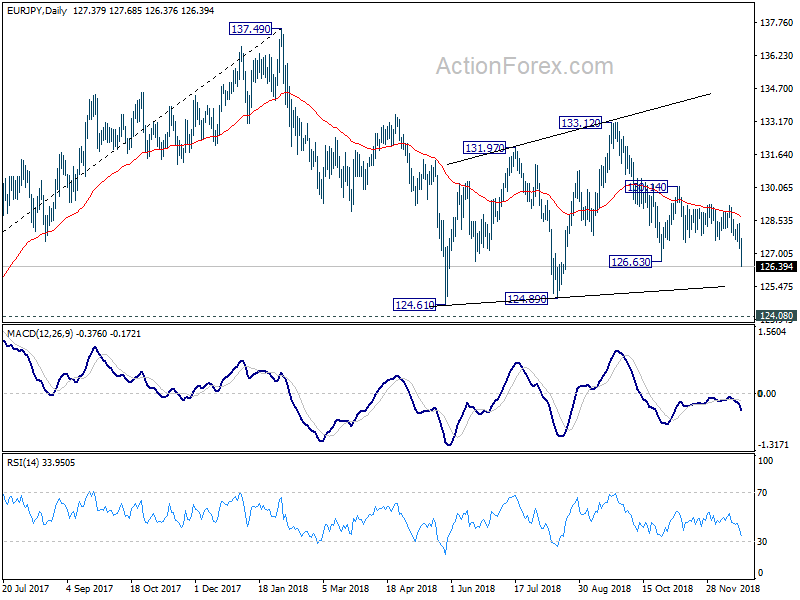
We're holding on to EUR/JPY short (entered at 127.80, stop at 129.30) as last updated here. After holding the position for nearly a month, it's finally playing out as we expected. EUR/JPY's break of 126.63 support confirms resumption of decline from 133.12. It's held all the way by falling 55 day EMA which affirms bearishness.
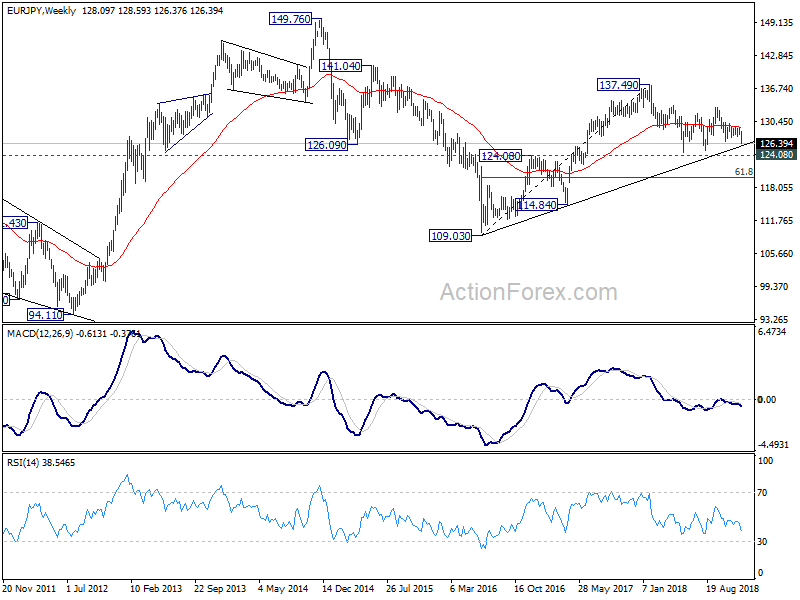
In the bigger picture, EUR/JPY is also held below 55 week EMA which is an indication of medium term bearishness too. Further decline should be seen to 124.08/89 support zone. envisaging the fall from 137.49 to resume eventually and extend to 61.8% retracement of 109.03 to 137.49 at 119.90. But we'll pay attention to the reaction from 124.08/89 support zone to decide whether to get out early or not. .
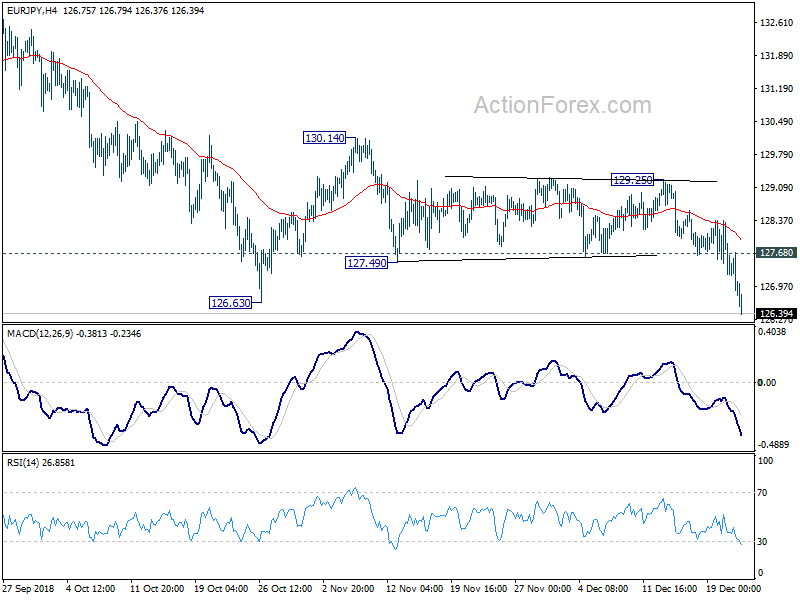
Going forward, we'll hold short in EUR/JPY and lower the sop to 127.70, slightly above 127.68 minor resistance. Target is put at 120.00 for now. We'll hold off from other trades for now before new year.
Summary 12/24 – 12/28
Monday, Dec 24, 2018
[php_everywhere instance="1"]
Tuesday, Dec 25, 2018
[php_everywhere instance="2"]
Wednesday, Dec 26 2018
[php_everywhere instance="3"]
Thursday, Dec 27, 2018
[php_everywhere instance="4"]
Friday, Dec 28 2018
[php_everywhere instance="5"]
Weekly Economic and Financial Commentary: Data Show Still Solid, but Moderating Momentum in Q4
U.S. Review
Data Show Still Solid, but Moderating, Momentum in Q4
- Despite some softer-than-expected data in recent weeks and continued volatility in the financial markets, the FOMC raised the fed funds rate 25 bps at its policy meeting on Wednesday.
- If, as we expect, growth remains solid in coming months, then we think our outlook for future rate hikes, albeit at a slower pace, remains reasonable.
- Economic data out the gate this week generally supports the still solid, yet moderating, pace of growth. Personal income and spending data showed consumer spending continues to rise, while fresh housing data suggest some modest improvement to end an otherwise year of cooling.
Data Show Still Solid, but Moderating Momentum in Q4
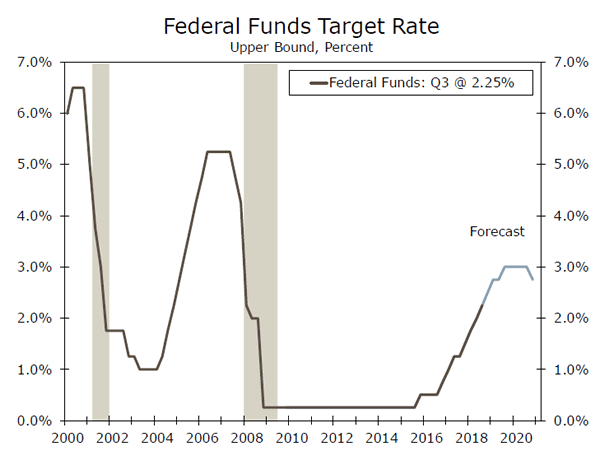
It was only a few weeks ago that there was nearly a universal agreement among analysts that the Federal Open Market Committee (FOMC) would hike rates at its December 19 monetary policy meeting. But softer-than-expected data in recent weeks and volatility in financial markets led some analysts to expect that the FOMC might refrain from tightening. Stocks had rallied just before the Fed's decision was released on Wednesday, but, as we expected, the FOMC raised the fed funds rate 25 bps. The Fed has now hiked rates 225 bps over the past three years, 100 bps of which have occurred in 2018.
The FOMC is attempting to move away from a pre-determined policy path. It sees balanced risks to the economic and inflation outlook, and reaffirmed its data-dependent approach in the policy statement. The FOMC also dialed back its assessment for future tightening while recognizing some moderation in growth by reducing its GDP growth forecast. But, the recent policy decision to raise rates and continue its trajectory for quantitative tightening has left many analysts and market participants worried. Analysts have been questioning whether the Fed might make a policy mistake or if markets are purely overreacting. For now, we all must wait and see how the economy evolves over the next year or so. If, as we expect, growth remains solid in the coming months, then we think that the outlook for future rate hikes, albeit at a slower pace, remains reasonable. We expect the Fed to hike rates 50 bps in 2019 (chart on first page).
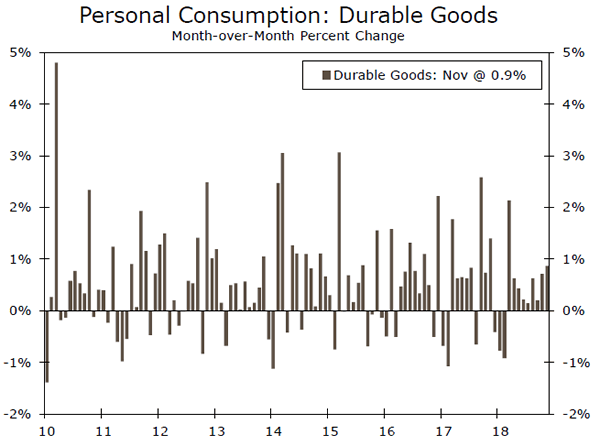
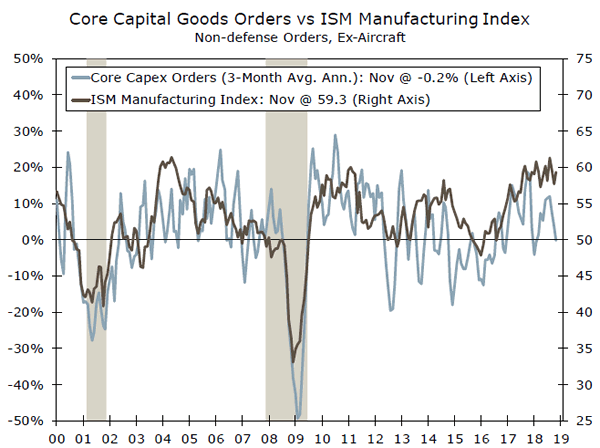
Economic data out the gate generally support a still solid, yet moderating, pace of growth. Personal income and spending data showed consumer spending continuing to rise at a steady rate. A sturdy consumer backdrop points to solid growth in Q4 consumption, and despite increasing interest rates November's release showed some newfound strength in durable goods spending (top chart). Steady gains in the hard data helped keep the University of Michigan's measure of consumer sentiment elevated in December. This is despite worries of extended drops in financial markets and softness in the housing sector. Durable goods orders rose in November, but core orders have slowed recently (middle chart). Core orders reaffirm our view that the pace of equipment spending is likely to slow in 2019 due to slower global growth and trade tensions starting to weigh on U.S. activity.
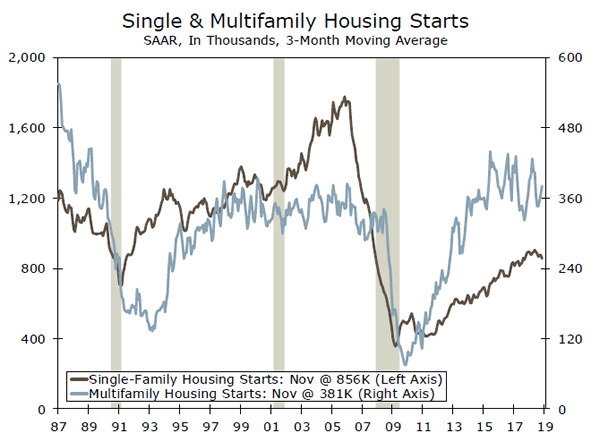
The housing sector has been a laggard of late, but fresh November data suggests some modest improvement. Housing starts jumped a better-than-expected 3.2%, although this was concentrated in the multifamily segment. Single-family starts fell for the third consecutive month (bottom chart). The 5% rebound in building permits over the month was also led by multifamily permits. Existing home sales rose 1.9%, which was better than the consensus estimate of a 0.4% drop.
Most of the anecdotal evidence surrounding the housing sector suggests that after cooling off this past summer, conditions are stabilizing at a more modest level. But, we expect the recent pullback in interest rates may provide a short rush of activity from buyers that were put off by a sudden rise in mortgage rates.
U.S. Outlook
Consumer Confidence • Thursday, Dec. 27
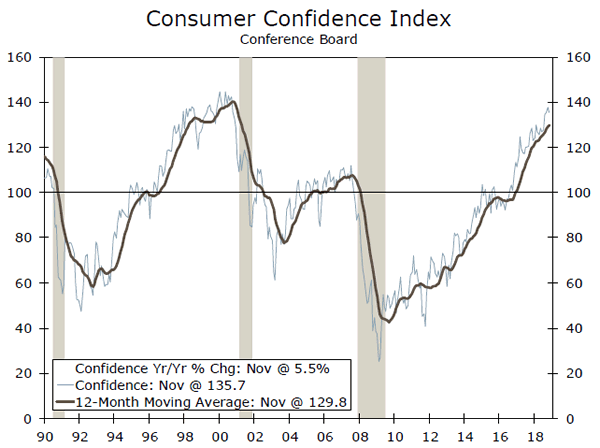
Consumers' holiday cheer was probably dampened by the sharp slide in equity markets over the past month, but we expect the December consumer confidence report to show that households remained fairly upbeat on the economy. The nearly 15% drop in gasoline prices since November is padding consumer wallets just in time for holiday spending. In addition, we expect confidence to remain high given the tight state of the labor market and relatively wide availability of jobs.
Buoyant consumer spending is a key to our above-consensus outlook for growth next year. A sharper pullback in consumer confidence could therefore spook the FOMC and contribute to the committee raising interest rates less than the 50 bps we currently expect for 2019. If consumer confidence rises, however, the increase would illustrate that momentum for the household sector and broader economy remains favorable heading into 2019.
Previous: 135.7 Wells Fargo: 133.7 Consensus: 133.6
ISM Manufacturing • Thursday, Jan. 3
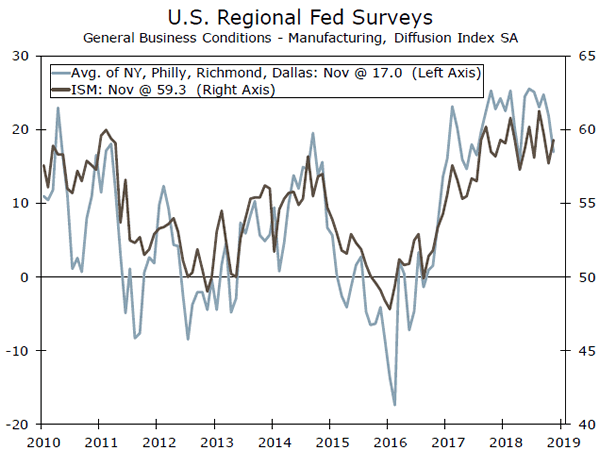
Manufacturing activity, according to the ISM index, rebounded in November, but has come off the highs reached over the past year. We believe there may be further moderation in the December readings. Regional purchasing managers' indices have rolled over more definitively over the past few months. More fundamentally, moderating U.S. and global growth and trade uncertainty suggest the lofty readings of 2018 will be difficult to maintain.
A weaker-than-expected print for December could amplify concerns about slowing growth and trade tensions for markets and Fed officials alike. If the ISM index stays in the upper 50s or comes in even stronger, it would suggest that the real economy remains strong and would support another Fed hike in the first quarter.
Previous: 59.3 Wells Fargo: 58.2 Consensus: 58.2
Employment • Friday, Jan. 4
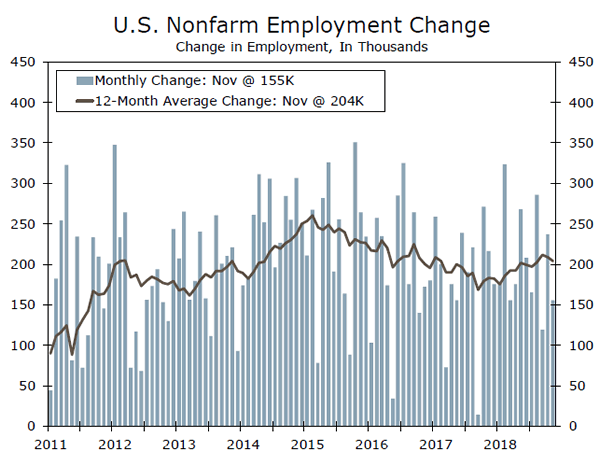
Hiring has slowed recently, with employers adding an average of 170,000 jobs over the past three months versus 211,000 in the first 10 months of the year. We see some scope for hiring to rebound after last month's 155,000 gain, but the trend is likely to remain below 200,000. While demand for workers remains solid, as indicated by the near-record high in job openings, low unemployment is making it more difficult for firms to hire new workers. We expect the unemployment rate to remain at a 49-year low of 3.7%.
While estimates suggest about only 100,000 jobs are needed each month to keep the unemployment rate declining on trend, another significant downside miss would suggest the labor market is cooling faster than the Fed is likely to be comfortable with. That would suggest the timing of future rate hikes would likely be pushed back. An upside surprise, on the other hand, would be supportive of the additional two rate hikes in 2019 the Fed projected this week.
Previous: 155,000 Wells Fargo: 175,000 Consensus: 180,000
Global Review
Monetary Policy Mixed Bag to End the Year
- Several central bank announcements this week confirm our view of monetary policy convergence continuing gradually over the coming year. The Riksbank unexpectedly raised rates along with central banks in Thailand and Mexico, while the Bank of England and Bank of Japan remained on hold.
- Italy reached a budget deal with the EU this week, avoiding sanctions for its initial failure to comply with the EU's deficit limit of 2% of GDP.
- Solid data out of Canada support our view that the Bank of Canada could raise interest rates multiple times next year.
Monetary Policy Mixed Bag to End the Year
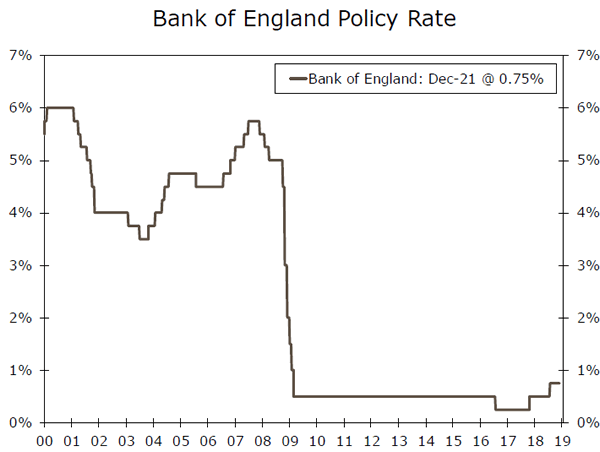
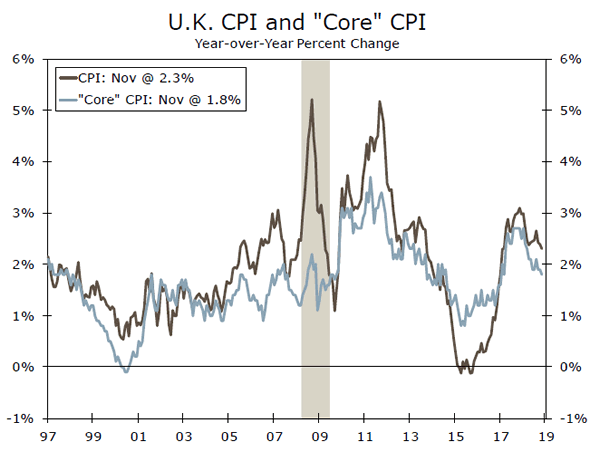
Global monetary policy took center stage this week amid several central bank announcements. In the U.K., the Bank of England (BoE) left rates unchanged as Brexit uncertainty continues to weigh on growth prospects (see chart on page 1). We learned this week that inflation continued to slow back toward the BoE's 2% target in November (top chart), and retail sales rebounded 1.2%. But at the same time, Brexit tensions have risen recently—Prime Minister May survived a leadership challenge just last week, while the initial deal reached with the EU earlier this month has yet to come before parliament for a vote. We look for the BoE to remain on hold until a final agreement comes into sharper focus. Our base case is still for a deal to be reached by the March 29 deadline, and we look for the BoE to then raise rates in Q2-2019.
Meanwhile, in Sweden, the Riksbank raised rates 25bps for the first time since 2011, although the consensus was expecting rates to remain unchanged until February. The decision comes amid a recent soft patch in GDP growth and inflation that hit the central bank's "around 2%" target in November, but policymakers also reduced projections for future rate hikes, meaning they will likely proceed cautiously with additional tightening.
Elsewhere in Europe, Italy reached an agreement with the EU to lower its deficit target to 2.04% of GDP in 2019. The deal avoids sanctions threatened as a result of Italy's original failure to comply with the EU's requirements. Although the deal avoids drawn out negotiations that could have been a headwind to the broader Eurozone economy, structural issues facing Italy such as high government debt levels and sluggish economic growth mean its economy will likely remain in focus over the coming months.
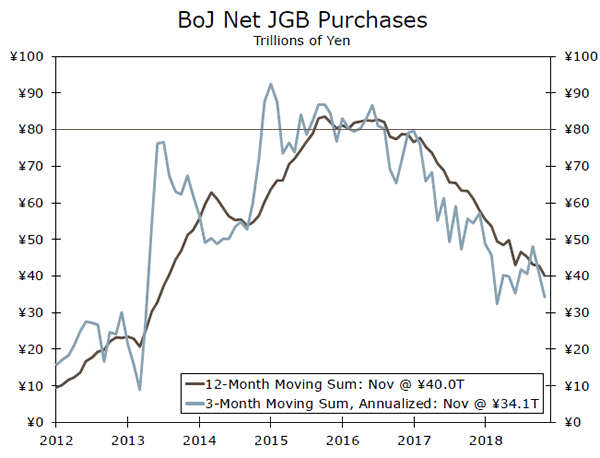
Turning to Asia, the Bank of Japan (BoJ) left rates unchanged this week, maintaining its ultra-accommodative policy stance amid low inflation. That said, the BoJ introduced slight policy tweaks in July to allow for a wider trading range on Japanese government bond (JGB) yields. And, while its annual JGB purchase target remains at ¥80 trillion, the BoJ has actually been steadily reducing net purchases closer to a ¥40 trillion annual pace (middle chart). We still look for the BoJ to raise its policy rate to 0% from -0.10% as soon as Q2-2019. Elsewhere in the region, Thailand's central bank raised rates 25bps, while central banks in Taiwan and Indonesia remained on hold, consistent with the broader theme of global monetary policy convergence proceeding only gradually in the coming quarters.
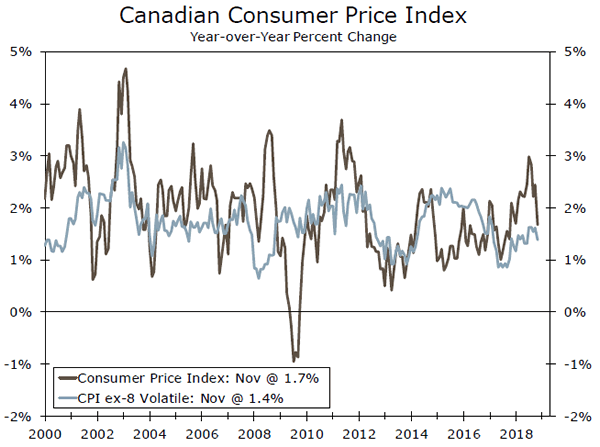
Finally, in North America, Mexico's central bank raised its policy rate 25 bps to 8.25%, the highest since 2008, in an attempt to curb further peso weakness and still-above-target inflation. In Canada, November inflation and October GDP and retail sales data were also released this week. Headline CPI rose a more tepid 1.7% year over year, largely due to the recent drop in oil prices (bottom chart). However, core inflation still remains near the center of the Bank of Canada's (BoC) 1-3% target band. A pickup in GDP growth to 2.2% year over year in October along with firming retail sales suggest that, so long as oil prices recover, the BoC could still raise interest rates multiple times next year.
Global Outlook
Japan IP • Thursday, Dec. 28
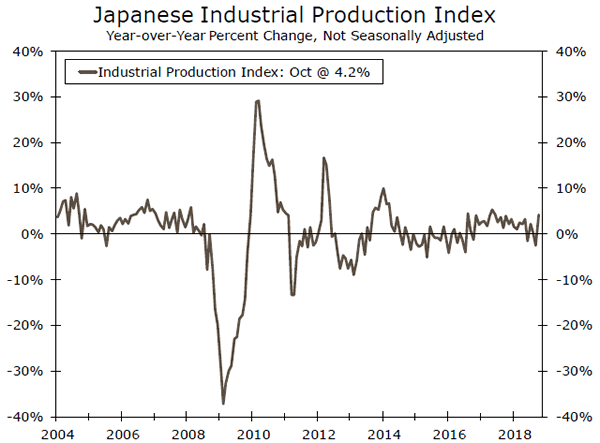
Following a contraction in Japan's economy in Q3, monthly activity indicators are being watched closely for signs of a return to growth in Q4. The early indicators are encouraging, with October industrial production rising 2.9% month over month and October retail sales rising 1.3% month over month. Next week sees the release of November activity data, for which economists forecast a partial payback for that October strength. The consensus forecast is for industrial production to fall 1.7%, while retail sales are also expected to fall 0.4%. Even with those declines, however, Japanese growth is expected to return positive territory in Q4, with the consensus forecast for Q4 GDP currently at 2.2% quarter-over-quarter annualized pace. Next week also sees the release of the Tokyo December CPI, a timely and leading indicator of the national CPI. The Tokyo CPI excluding fresh food is forecast to rise 0.9% year over year, a bit less than the November gain.
Previous: 2.9% (Month-over-Month) Consensus: -1.7%
China PMIs • Monday, Dec. 31
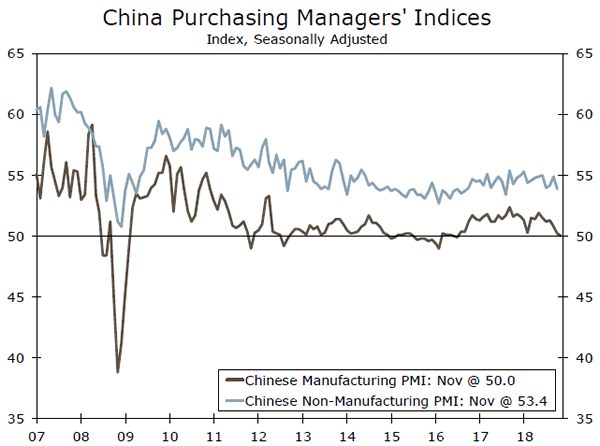
China's economy has been on a steadily slowing path, with trade tensions with the United States reinforcing already subdued domestic economic trends. The manufacturing and service sector PMIs provide timely insight into the path of the economy, and have displayed consistent weakness in recent months. The manufacturing PMI fell to 50.0 in November, the lowest reading since mid-2016.
The services PMI has also eased, although activity has been somewhat more resilient, with the November reading of 53.4 matching the lowest level since mid-2017. Despite growth supportive monetary and fiscal policies China's economic slowdown has so far shown few signs of dissipating, and in that context the December PMI surveys will be scanned for any hints of stabilization. The outlook remains tentative however. For December, the manufacturing PMI is expected to stay at 50.0, while the services PMI is expected to fall further to 53.1.
Previous: 50.0 (Manufacturing), 53.4 (Services) Consensus: 50.0 (Manufacturing), 53.1 (Services)
Eurozone CPI • Friday, Jan. 4
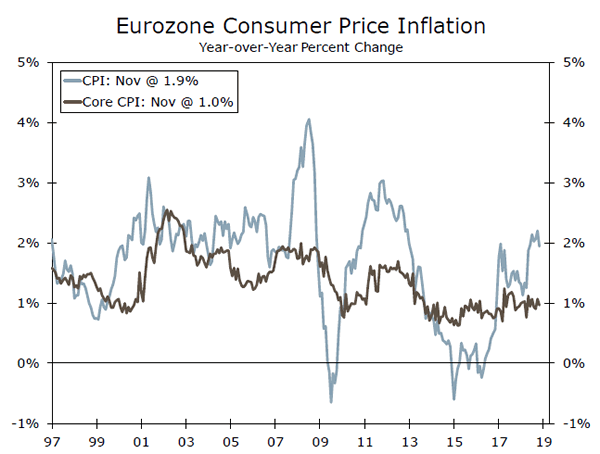
Inflation pressures remain moderate across the Eurozone. The CPI rose 1.9% year over year in November, while in recent months the headline reading has exceeded 2% at times, boosted by higher energy, and to a lesser extent, food prices. Underlying inflation pressure have so far remained relatively subdued, however, with services inflation at 1.3% year over year in November, and the core CPI rising by just 1.0%. The European Central Bank recently confirmed its plans to end its asset purchase program at the end of this year, although the lack of inflation pressure means the central bank is not expected to begin raising interest rates until late in 2019.
For December, the CPI should continue to indicate few inflation pressures for now. Given the recent drop in oil prices, the headline CPI is expected to slow further to 1.8%. Meanwhile core CPI inflation has ranged between 0.9% and 1.1% since May this year, and should stay within that range in December with a 1.0% gain.
Previous: 1.9% (Year-over-Year) Consensus: 1.8%
Point of View
Interest Rate Watch
The Fed Hikes Rates 25 bps
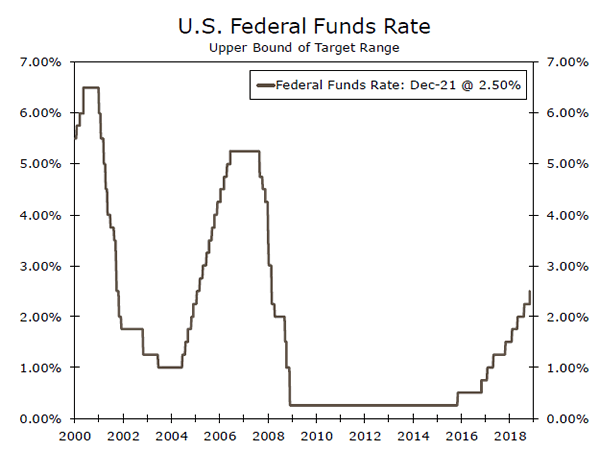
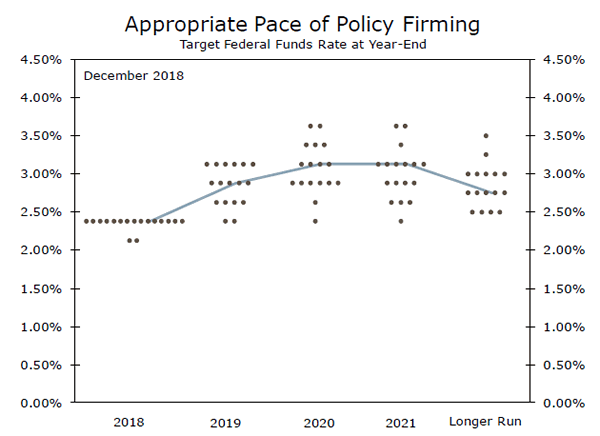
As expected by most observers, the Federal Open Market Committee (FOMC) raised its target range for the fed funds rate by 25 bps at its meeting on December 19 (top chart). But the committee dialed back its assessment for further tightening. The median FOMC member now sees the need for just 50 bps of additional tightening next year instead of 75 bps (middle chart), and the FOMC said that it "will continue to monitor global economic and financial developments and assess their implications for the economic outlook."
That said, market participants were clearly not happy with the FOMC's judgement that further monetary tightening will be needed. The stock market has swooned (bottom chart), and prices of corporate bonds, especially speculative grade bonds, have weakened sharply.
The U.S. economy is humming along right now, but real GDP growth clearly has slowed from its breakneck pace earlier this year. The housing market has more or less stalled. Slower economic growth in the rest of the world has weighed on U.S. export growth, and the recent collapse in energy prices dampens the outlook for capital spending in the energy sector. Measures of business optimism have ticked lower, and the aforementioned weakness in financial markets impart a tightening of financial conditions on the economy. This tightening in financial conditions, if maintained, reduces the need for further Fed tightening, everything else equal.
We have expected for some time that the U.S. economy would decelerate in 2019 as the effects of fiscal stimulus wane and as previous Fed rate hikes exert headwinds on interest-rate-sensitive spending. But we maintain our forecast that the economy will continue to grow at a solid pace next year, albeit slower than in 2018, and that the FOMC will raise rates by 50 bps (once in March and once in September) in 2019. That said, the recent tightening of financial market conditions imparts some uncertainty into the timing and magnitude of future rate hikes. Similar conditions in 2015/early 2016 led the FOMC to remain on hold for most of 2016. We will be keeping a close eye on the economy and will make adjustments to our interest rate forecasts, if warranted.
Credit Market Insights
Leverage Loans and the U.S. Economy The leveraged loan market, where bank debt of non-investment grade companies is traded, has experienced rapid growth over the past few years. Weakness in the market in recent weeks, however, may bring back unpleasant memories of the sub-prime loan debacle a decade ago. Does this recent weakness in the leveraged loan market have negative implications for the U.S. economy?
The leveraged loan market in the United States has mushroomed to more than $1 trillion today from only $5 billion about 20 years ago (Figure 1). Growth has been especially marked in the past two years, with the amount of leveraged loans outstanding up more than 30% since late 2016.
In our view, the leveraged loan market, taken in isolation, is not likely to bring the economy to its knees anytime soon. Past weakness in leveraged loans has generally not been associated with a marked deceleration in bank C&I lending. But its recent weakness may reflect a broader economic reality about which we have been writing. Namely, the overall financial health of the non-financial corporate sector has deteriorated modestly over the past few years. If the Fed continues to push up interest rates and if corporate debt continues to rise, then financial conditions would tighten further, which could eventually lead to a sharper slowdown, if not an outright downturn, in economic growth.
For further reading on this topic, see our recent special report "Leverage Loans: A Deathknell for the U.S. economy?"
Topic of the Week
Do you See What I See?
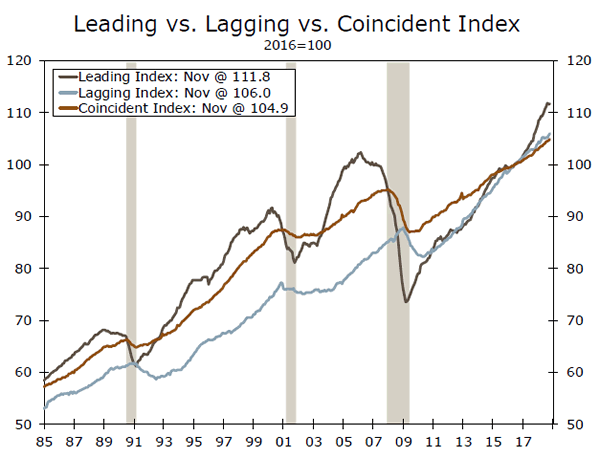
With a looming government shutdown, choppy financial markets and a 25 bps rate hike by the FOMC, markets continued to be plagued with volatility this week. We believe the economy has decelerated a bit in recent months, but growth clearly remains positive. A recent example of this notion is the Leading Economic Index (LEI), which rose 0.2% in November, but was accompanied with a decent downward revision to October. Moderation here is consistent with recent market volatility, and indicative of a moderation in economic growth in the year ahead.
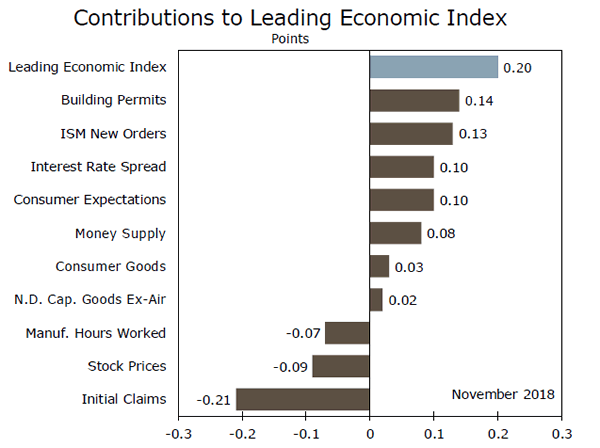
Strength in the underlying components was broad based, with seven of the ten underlying indicators contributing positively to the index. Broad declines in stock prices throughout the month of November held back the stock price component, and given continued declines in financial markets through December, it is unlikely for this component to reverse next month. Initial jobless claims were the largest drag for the November LEI, as the month saw the greatest pick up in claims since March. But, claims rose to only 214,000 last week, after a sharp drop to 206,000 claims during the first week in December. The housing sector has seen a moderation over the past year, as sales and price appreciation have cooled off considerably. But the most recent data suggest conditions are stabilizing at a more modest level.
Building permits rose a better-than-expected 5.0% in November, and were the largest contributor to the LEI, adding 0.14 points. Not too far behind, the ISM new orders component contributed 0.13 points to the overall LEI. The jump in November orders points to continued gains in the factory sector, but given that the gap between the ISM new orders index and core capital goods orders remains fairly wide, we remain cautious of the near-term capital spending plans.
Growth is expected to moderate in the year ahead, but looking past choppy markets and volatile news headlines, economic growth remains broadly positive.
The Weekly Bottom Line: A Solid Year In Spite Of Headwinds
U.S. Highlights
- As widely expected, the Fed hiked rates once more this year. At the same time, the Fed's dot plot moved lower over the forecast horizon. These changes are consistent with a softer inflation and economic outlook.
- Data came in broadly positive, with housing starts and home resales both defying weaker market expectations. Consumer spending remained hot in November, with consumption looking set to advance by a sturdy 4% (annualized) in Q4.
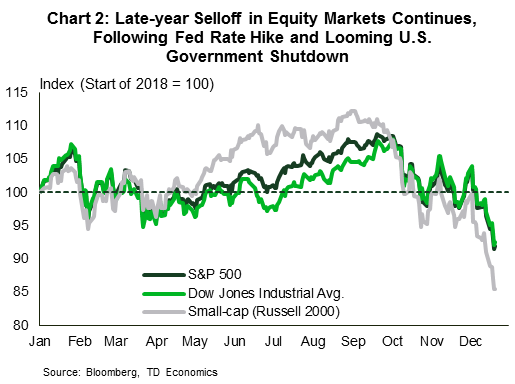
- The late-year equity market sell off continued this week, with looming risks for a partial government shutdown marking the latest in a series of factors that are likely to weigh on sentiment through the New Year.
Canadian Highlights
- Christmas came early for economic data watchers this week. A slew of reports showed both the strengths and weaknesses of Canada's economy.
- On the weak side, existing home sales pulled back 2.3% in November, falling for a third straight month. Still, the housing market appears to be stabilizing at this lower level with sales to new listings in balanced market territory and quality adjusted prices up 2% from a year ago.
- On the stronger side, GDP expanded by 0.3% in October. Businesses remain relatively optimistic about the future and note ongoing capacity constraints, which should show up in stronger investment in non-oil-related sectors.
U.S. - Fed Set To Walk On Data Talk
It was a busy data week, but the FOMC meeting was the main event. As widely expected, the Fed hiked rates for the fourth time this year, lifting the upper bound of the fed funds rate to 2.5%. More interesting was that the Fed's dot plot, which shows members' expectations for future rate increases, shifted lower in 2019. The median expectation is now for two hikes, down from three previously. The expectation for the longer-run level of the fed funds rate also moved down 25 basis points to 2.75%. Consistent with these changes are a slightly more subdued price outlook and slightly higher unemployment rate, both a sign of a softer economic outlook in the years ahead.
The Fed's dovish tone with respect to future hikes did little to appease investors. Both U.S. and international equity markets extended their losing streak on the news. It should be noted, however, that the path of interest rates is not set in stone, with the Fed placing a greater emphasis on data-dependency. As Fed Chair Powell put it, from this point on "we're going to be letting the data speak to us".
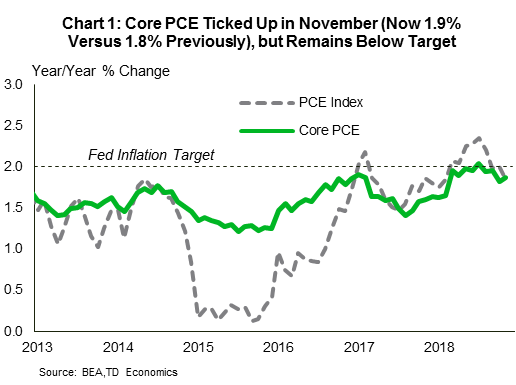
Speaking of data, this week's releases continued to confirm several running themes. First, inflation remains near target but has softened lately. The core PCE prince index, the Fed's preferred measure of inflation, edged up in November, but still fell short of target (Chart 1). Secondly, U.S. consumer spending remains hot. Real spending was up 0.3% in November. With two months in the bag, consumption looks set to advance by close to 4% (annualized) in the final quarter of the year, better than previously expected. This brings our tracking for real GDP for the same quarter up to 2.8% – a deceleration from the third quarter (3.4%), but enough to keep growth at 2.9% for the year.
Third, the housing market remains soft but recent improvements are encouraging. Both housing starts (3.2%) and existing home sales (1.9%) rose in November, besting market expectations. On a less positive note, starts were propped up by the volatile multifamily segment (single-family starts fell for a third straight month), while home resales are still down between 3% and 15% year-on-year across major U.S. regions.
As the sugar high from monetary and fiscal stimulus wears off, we expect growth to slow to a still-healthy 2.5% in 2019. But, several potential potholes lie in the path ahead (see here). The latest spending bill impasse, which could lead to a partial government shutdown, is but one example. Given that shutdowns typically prove to be short-lived, history suggests limited economic impact. However, the hit to market confidence could prove more damaging.
Given expectations for slowing growth and the pronounced late-year selloff in equity markets (Chart 2), the "recession" word has gained traction recently. Our recent look at a broad range of indicators points sees little evidence for this in the economic data. That said, negative expectations have the potential to become self-fulfilling. But for now, the only thing we have to fear is fear itself.
Canada - A Solid Year In Spite Of Headwinds
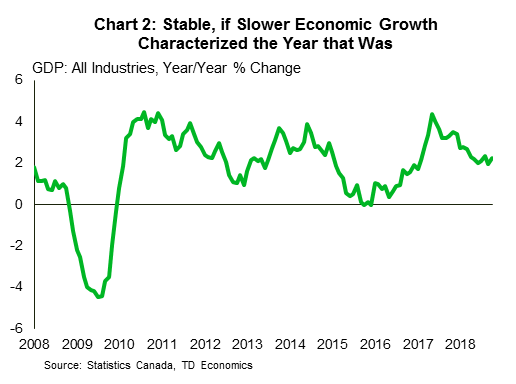
As the year draws to a close, it's a good time to look back on what was. 2018 was a year of adjustment for the Canadian economy. From new mortgage regulations to trade uncertainty and plummeting oil prices, it was also a year of headwinds. Economic growth downshifted from a lofty 2.9% in 2017 to a still-respectable 2.1% in 2018. Underneath the headline, the drivers also shifted. After years of supporting growth, residential investment subtracted from it in 2018. Fortunately, its negative contribution was offset by a reversal in the contribution from net exports, something we expect to continue over the next year.
The data flow this week echoed these themes. Canadian home sales continued their descent in November, falling 2.3% – a third straight monthly drop. Importantly, the drop in sales was met with fewer listings, leaving the housing market in balanced market territory. Adjusted for quality, home prices across the country were up 2.0% from a year ago. The market appears to be showing signs of stabilization, but at a lower level of activity than the heady pace of the past several years.
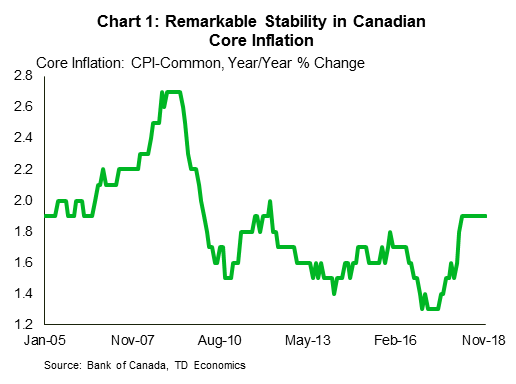
Stable is also the word to describe Canada's inflation backdrop. While headline consumer price growth decelerated to 1.7% in November due to falling oil prices, the Bank of Canada's core measures have been remarkably steady, hovering in a narrow range between 1.8% and 2.1% over the course of the year. In November, the CPI-common measure marked its 10th month at 1.9%), its longest string of steady growth on record (see Chart 1).
The impact of lower oil prices is likely to be felt more noticeably in Canadian economic data over the remainder of 2018, but the fourth quarter at least started off on a strong foot, with GDP growing by 0.3% m/m in October. Encouragingly, growth was widespread across a majority of both goods and services-producing industries, with the notable exception of construction, which pulled back for a fifth straight month. Even with the strong start to the quarter, growth is likely to average just 1.7% in Q4. November saw the worst of the discounts on Canadian oil blends, and voluntary production curtailments are likely to weigh on activity (see our report). This will sap year-end growth, even before mandatory production cuts come into effect in January.
The year also had its mysteries, answers to which may be forthcoming over the next year. The first is that in spite of solid investment intentions and capacity pressures, actual business investment has remained soft. Non-residential business investment in the third quarter of 2018 was more or less where it ended 2017. We look for acceleration in investment in 2019, but the uncertainty around the sector must be acknowledged in light of this year's developments. The second is that despite a record-low unemployment rate and vacancy rates at record highs, wage growth has remained subdued. Surveys suggest that businesses facing vacancies will offer juicier wages to attract applicants, but we're still waiting to see this show up in the data.
U.S.: Upcoming Key Economic Releases
U.S. ISM Manufacturing Index - December
Release Date: January 3, 2018
Previous: 59.3
TD Forecast: 57.3
Consensus: 58.4
As suggested by weaker-than-expected prints in both the Empire Manufacturing and Philly Fed surveys, we look for the ISM Manufacturing index to give back some of its recent strength in December. Although we expect it to recede more than current consensus, we note that the ISM index remains at strong levels and well away from contractionary territory. ISM's employment index should give us confirmation of steady labor demand in the manufacturing sector, while new orders could be atrisk of a pullback after hovering above the strong 60 level for most of the year.

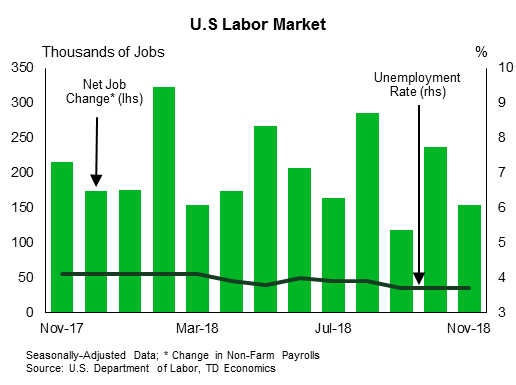
U.S. Employment - December
Release Date: January 4, 2018
Previous: 155k, unemployment rate: 3.7%
TD Forecast: 190k, unemployment rate: 3.7%
Consensus: 183k, unemployment rate: 3.7%,
TD expects payrolls to rebound to an above-consensus 190k for December following a larger than expected slide to 155k for November. Surveys published so far (Empire, Philly Fed) suggest employment likely remained firm in the manufacturing sector and there could be scope for an upside surprise from employment in the services sector (surveys are yet to be published). The construction sector will be particularly interesting to follow since it could continue to reflect weakness in activity. On the back of this, we anticipate the unemployment rate to stay largely unchanged at 3.7%. Lastly, we anticipate wages to rise 0.3% m/m in December largely reflecting a favourable reference week. This should bring the annual print down slightly to 3.0% from 3.1% in November.
Canada: Upcoming Key Economic Releases
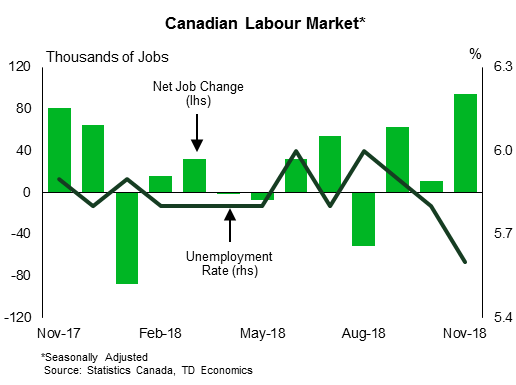
Canadian Employment - December
Release Date: January 4, 2018
Previous: 94k, unemployment rate: 5.6%
TD Forecast: 15k, unemployment rate: 5.6%
Consensus: N/A
TD looks for job growth to slow to 15k in December following the blockbuster 94k increase last month. While the LFS is inherently volatile and has a tendency to mean-revert after such outsized moves, we believe that these gains will be sustained given a large gap between cumulative job growth for 2018 reported in the LFS versus that from payroll (SEPH) data. A 15k increase in net employment will see the unemployment rate hold at the current post-crisis low of 5.6%, although other details should prove more downbeat. We see scope for full time employment to give back some of the 90k jobs created in November, leaving part-time hiring to drive job growth. And while wage growth is forecast to edge higher to 1.6% y/y, this is still quite subdued relative to historical norms especially given the diminished slack in the labour market.
Volatility and Risk Aversion Continue to Dominate December
What a week for bears and volatility! The highly anticipated Fed event delivered volatility that brought down all the major indexes to their knees. The Fed raised rates, reduced their dot plot forecasts, but they signaled that quantitative tightening is on automatic pilot. Stocks dropped and safe-haven assets soared as concerns of tighter liquidity and a partial government shutdown dashed hopes for a Santa rally. With Fed officials lowering their inflation outlook, global growth concerns driving recession worries, expectations for future rate increases and optimism for the US economy are dwindling. For risk appetite to return, we may need to see the Fed talk back the hawkishness.
- A lot of indexes are either in or flirting with bear market territory
- Is oil forming a bottom?
- Brexit and trade war deadlines come into focus
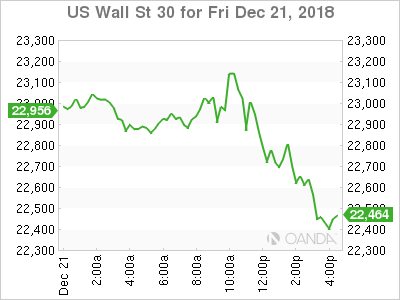
This month, weakness in equities has either come from trade war fears, anemic economic data outside the US, lack of dovish assurances from the Fed, a partial government shutdown, lower oil prices and recession concerns. As we approach holiday trading conditions, some investors are keeping to the sidelines and waiting to see if the bearish momentum continues in January. Both the Dow Jones Industrial Average and S&P 500 are on pace for their worst December performance since the Great Depression.
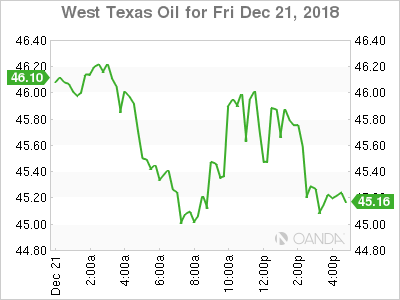
Oil hovers near 18-month lows
The collapse in oil is starting to make US shale producers reduce their spending. Some companies have shutdown rigs and reduced their fracking crews, but in order for oil to stabilize, we will need to see US producers significantly reign in their output. The oil production cuts from OPEC and the reductions we are seeing in shale are currently modest at best. If we continue to see slower economic growth that will weigh on demand and make it difficult for oil to stabilize
Brexit outcome nearing
We are well under 100 days until the Brexit deadline and PM May appears to be trying to run out the clock before pushing her Brexit deal through Parliament. The House of Commons recess is from December 20th to January 7th and the Prime Minister is hoping she can retain as many senior ministers before talks intensify next month. The vote is expected on the week of January 14th and depending on how much she loses that vote by could determine what we see next. If we see a motion of no confidence in the government that could bring about an early general election if it is supported by a majority of MPs. The scenarios remain plentiful on how Brexit will turn out, but the ultimate resolution of a soft-Brexit is still being seen with cable.
Trade war cease-fire winds down
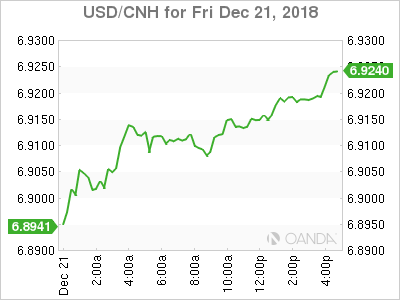
The trade war is hurting China and top policymakers this week signaled they will provide more support to the economy with tax cut and other policy measures. The 90-day tariff truce made between President Xi and President Trump ends on March 1st and if we don’t see more significant progress we could see the yuan continue to fall along with equities. Trump is adamant that China open their markets to the US, address intellectual property theft and forced technology transfer, and narrow the trade deficit. We may not see the final framework for a deal by the ceasefire deadline, but if we see progress, we could see that elevate risk appetite.
Market events to watch this week:
Monday, December 24
- Bank Holiday for Germany, New Zealand and Australia
- 8:30am USD Chicago Fed National Activity
- 6:50pm JPY PPI Services
Tuesday, December 25
- Bank Holiday
- 06:50pm JPY Monetary Policy Meeting Minutes
Wednesday, December 26
- Boxing Day for UK and Canada
- Bank Holiday for Switzerland, Germany, and Italy
- 9:00am USD S&P Corelogic House Prices
Thursday, December 27
- 8:30am USD Jobless Claims
- 10:00am USD Consumer Confidence
- 10:00am USD New Home Sales
- 6:30pm JPY Jobless Rate
- 6:50pm JPY Industrial Production & Retail Sales
Friday, December 28
- 8:00am EUR German Consumer Price Index (CPI)
- 8:30am USD Wholesale Inventories
- 9:45am USD Chicago Purchasing Manager
*All times EDT
Businesses Still Relatively Upbeat in Canada’s Q4 Business Outlook Survey
Highlights:
- The survey was relatively upbeat with business investment intentions holding up well despite lower oil prices.
- There was little change in measures of capacity pressures — which remained elevated — although there was some easing in concerns about those pressures intensifying going forward.
Our Take:
Considering financial market volatility and exceptionally wide discounts on Canadian oil prices over the survey period (early to late November), Canadian businesses remained relatively upbeat in Q4. Expected future sales growth over the next 12 months is about what it was over the last 12. That’s not so bad given the strength in sales over the last year, though, particularly with further evidence that businesses are still bumping up against capacity constraints. Business investment intentions still look solid, supported reportedly by plans to both “increase efficiencies” and expand output. Responses were understandably less positive in the Prairies given lower oil prices although even there investment intentions were reportedly “held up by long-term investment strategies” and plans to “implement new technologies.” Plans to increase employment remained widespread.
Capacity pressures remained elevated — especially outside of the Prairies. The share of businesses saying they would have difficulty meeting an unexpected increase in demand held steady at 56%. Labour shortages remained widespread, although were reportedly slightly less intense.
Firms also reportedly “no longer anticipate capacity pressures to intensify,” a sentiment that could have deepened further since the survey was conducted given financial market volatility and still-low oil prices. Nonetheless, the Q4 BOS data serves as a reminder that the economy still looks to be running at or around capacity at a time when interest rates are still historically low. Growth momentum has slowed, and a number of transitory disruptions should weigh on broader economic data over the next couple of quarters, but at this point it still looks like there is room for interest rates to move gradually higher once again in 2019— although still not likely at the next BoC policy decision in January.
US: Good Times for Consumers, Spending Solid and Inflation Contained
Personal income rose 0.2% in November (month-on-month), slightly below expectations for 0.3%. But, personal spending more than made up for the disappointment, rising 0.4% on top of an upward revision to October (+0.8%, prev. 0.6%).
Inflation readings were soft. Overall prices were up 0.1% month-on-month and 1.8% year-on-year. Core prices (excluding food and energy) rose 0.1%, but picked up on a year-on-year basis to 1.9% (from 1.8% in October).
Removing price growth, real spending was up 0.3% in November. Strength in spending in real terms was led by durable goods (+0.9% m/m) and nondurables (+0.6% m/m), while services spending was more modest (+0.2%).
The personal saving rate edged down again to 6.0%. The savings rate has trended down throughout 2018 after an initial boost thanks to the tax cuts, and now sits at the lowest level since 2013.
Key Implications
Market sentiment seems to be in need of some Christmas cheer, and there was plenty of it in today's report. The November spending data has confirmed the strength that was seen in the retail sales report, suggesting that consumer spending has held up better in Q4 than we had expected in our recent Forecast. We had expected consumer spending of close to 3%, and with two months of the quarter now in, growth is looking like it could be closer to 4%. That means the pace of consumer spending hasn't slowed at all since the middle of the year. A declining savings rate suggests that there will be a limit to how long this can go on, however, and we do expect spending to moderate to a more sustainable level in 2019.
Inflation has done a whole lot of nothing over the past several months, and November continued that story. Core inflation was a little softer than expected in November, but it's pace did pick up a bit, providing reassurance that it isn't moving entirely the wrong way. November's inflation reading is very much consistent with the more gradual pace of Fed rate hikes next year as outlined in their decision earlier this week.
Canadian Firms Remain Cautiously Optimistic
Canadian businesses' spending intentions remained solid at the close of the year, as captured by the Bank of Canada's quarterly Business Outlook Survey (BOS). The 'BOS Indicator' summary measure fell slightly, to 2.2 (from 2.8), but is still elevated by historic standards.
Expectations for future sales dropped somewhat, with the balance of opinion at a net -1% (from 15% in the prior survey). Firms report solid foreign demand, but¬ worry about the impacts of protectionist measures, including tariffs. The alternate measure, 'indicators of future sales', which is based on order books, advance bookings, and similar measures, was also down, moving from 40% to 27% in Q4, but in contrast to expectations, this indicator is sitting near its historic average.
In contrast, investment intentions ticked a bit lower, but remained solid, with a net 25% of firms indicating that they plan to increase their investment spending. Much of the higher spending plans were reported by firms in the service sector. Investment (and hiring) should be helped by ongoing capacity pressures: more than half of firms report that they would have some or significant difficulty meeting an unexpected increase in demand.
Indeed, the strongest element of the survey was the hiring intentions. 41% of firms, on balance, plan to hire over the coming year, up slightly from the prior survey. Unsurprisingly given still robust labour markets, firms continue to see elevated and more intense labour shortages.
Price pressures remain in play: a net 10% of firms plan to increase the pace of price increases, and, for the fourth straight quarter, the majority of firms expect inflation in the 2% to 3% range, or higher.
Senior Loan Officer Survey
The Senior Loan Officer Survey (SLOS), was also released this morning and indicated continued easing of lending conditions for business loans. This marked a fifth consecutive quarter of easier lending terms for businesses amid increased competition among lenders for corporate borrowers. Easing terms have led to stronger demand from businesses, some of which has been driven by increases in refinancing and extending loan facilities by corporate borrowers. That said, approval rates edged lower driven in part by some lenders' risk aversion to undertaking loans with looser terms, such as covenant-lite loans.
On the household side, lending conditions were little changed from the prior quarter. Although mortgage conditions did not change much at the national level, the report noted slightly tighter conditions in British Columbia, Ontario, and the Prairies. Both demand and mortgage approval rates were lower with fewer would-be home buyers qualifying under higher rates and stress test regulations. Non-mortgage lending conditions eased slightly along the price component. Demand for auto loans has remained broadly unchanged, but declined for other products with higher interest rates cited as a culprit.
Key Implications
This was bit of a "more than meets the eye" report. Headlines seem to have focused on the softening of sales expectations, which is perhaps unsurprising given the survey was completed in November, as Canadian energy firms faced record low prices for their products, and some chose to voluntarily curtail production. Elsewhere however, there are a few areas to cheer: order books remain decent, investment intentions solid, and hiring plans are healthy.
Even on the lending side, higher rates may be biting for personal borrowers, but they don't seem to have translated into tightened conditions for businesses. Competition among lenders (and/or a drive to maintain volumes given slowing consumer credit growth) drove a fifth straight easing of conditions, which should serve as another positive support for business investment.
The challenge with the BOS of late is that although the past few quarters have seen continued optimism (even during tense trade negotiations), when the rubber hits the road, words haven't translated into action. Non-residential business investment in 2018Q3 was more or less back to where it ended 2017. So, conditions may be ripe for business investment, and we look for a modest acceleration into 2019, but the uncertainty around the sector must be acknowledged in light of this year's developments.
We'd bet that the Bank of Canada is looking at this data in a similar light. Uncertainties around the oil sector aside, business investment has disappointed their expectations of late, giving all the more reason to hold off on another hike at least until the GDP data confirms rising business investment.