
Sample Category Title
EUR/AUD Daily Outlook
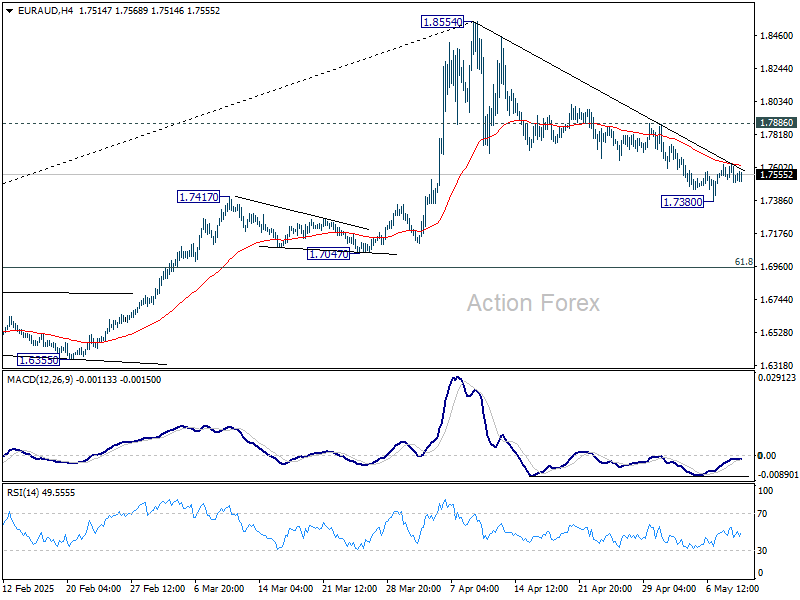
Daily Pivots: (S1) 1.7490; (P) 1.7560; (R1) 1.7616; More...
Intraday bias in EUR/AUD remains neutral for the moment. On the upside, firm break of 1.7886 resistance will argue that fall from 1.8553 has completed as a correction at 1.7380. Intraday bias will be turned back to the upside for retesting 1.8554. However, sustained trading below 55 D EMA (now at 1.7431) will target 61.8% retracement at 1.6953.
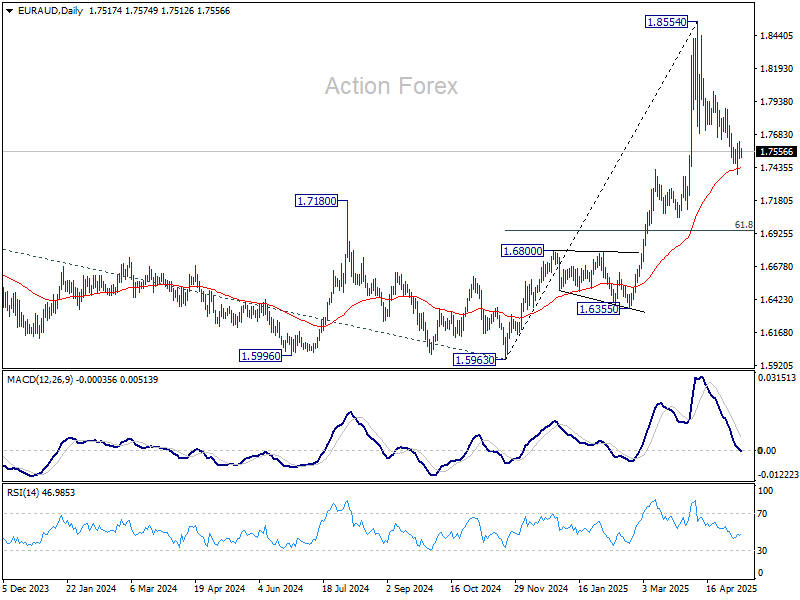
In the bigger picture, up trend from 1.4281 (2022 low) is in progress for 100% projection of 1.4281 to 1.7062 from 1.5963 at 1.8744. Firm break there will pave the way to 138.2% projection at 1.9806, which is close to 1.9799 (2020 high). Outlook will remain bullish as long as 1.7062 resistance turned support (2023 high) holds even in case of deep pullback.
EUR/CHF Daily Outlook
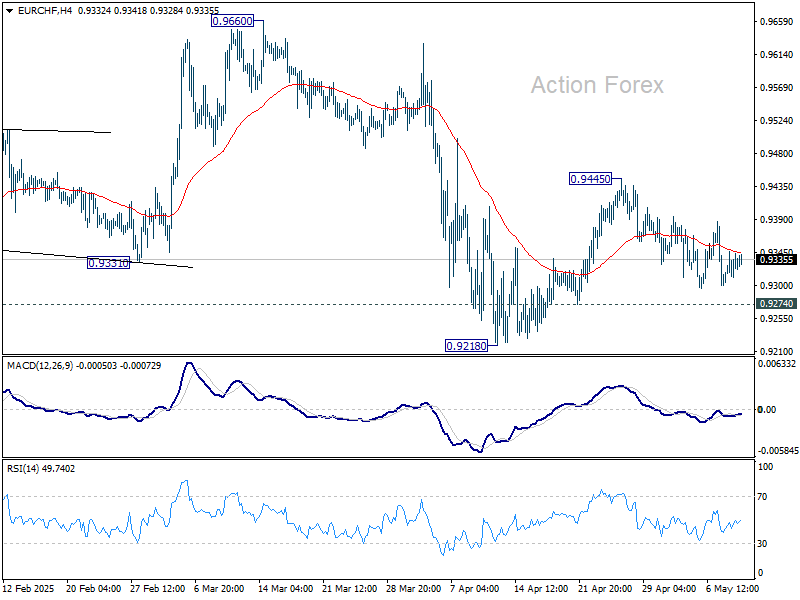
Daily Pivots: (S1) 0.9303; (P) 0.9326; (R1) 0.9362; More....
Range trading continues in EUR/CHF and intraday bias stays neutral. On the upside, above 0.9445 will resume the rebound from 0.9218, either as a corrective move or the third leg of the pattern from 0.9204. However, break of 0.9274 will suggest that that recovery has completed, and bring retest of 0.9204/18 support zone.
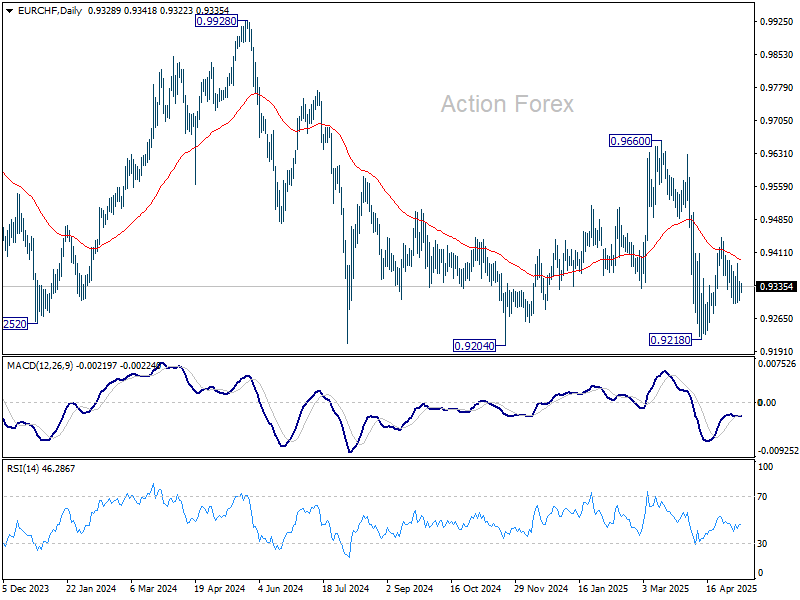
In the bigger picture, prior rejection by long-term falling channel resistance (now at 0.9555) retains medium term bearishness. That is, down trend from 1.2004 (2018 high) is still in progress. Firm break of 0.9204 (2024 low) will confirm resumption. This will remain the favored case as long as 0.9660 resistance holds.
USD/CAD Daily Outlook
Daily Pivots: (S1) 1.3847; (P) 1.3890; (R1) 1.3966; More...
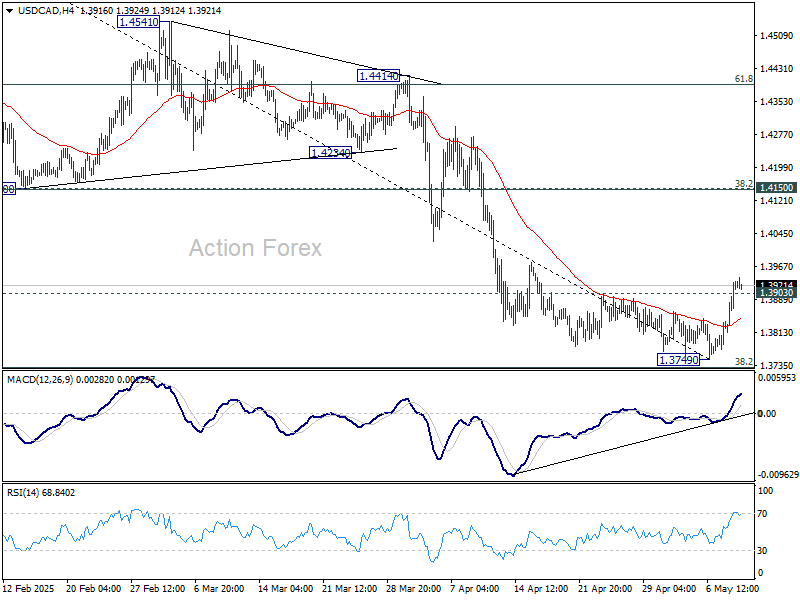
USD/CAD's break of 1.3903 resistance indicates short term bottoming at 1.3749, on bullish convergence condition in 4H MACD, ahead of 1.3727 fibonacci level. Intraday bias is back on the upside for 1.4150 cluster resistance (38.2% retracement of 1.4791 to 1.3749 at 1.4147). For now, risk will remain on the upside as long as 1.3749 holds, in case of retreat.
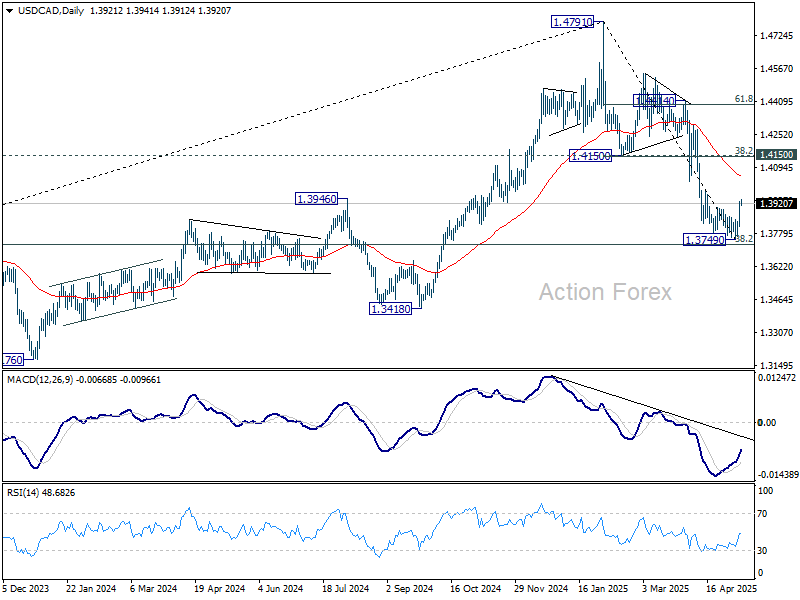
In the bigger picture, price actions from 1.4791 medium term top could either be a correction to rise from 1.2005 (2021 low), or trend reversal. In either case, further decline is expected as long as 1.4150 resistance turned support holds. Firm break of 38.2% retracement of 1.2005 (2021 low) to 1.4791 at 1.3727 will pave the way back to 61.8% retracement at 1.3069.
AUD/USD Daily Report
Daily Pivots: (S1) 0.6375; (P) 0.6420; (R1) 0.6445; More...
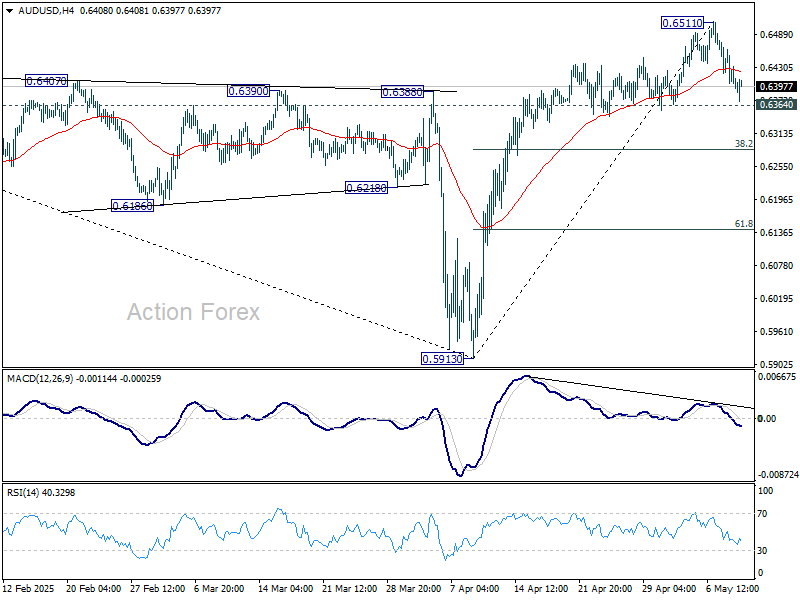
Intraday bias in AUD/USD remains neutral for the moment. On the upside, above 0.6511 will resume the rise from 0.5913 to 61.8% retracement of 0.6941 to 0.5913 at 0.6548. However, considering bearish divergence condition in 4H MACD, break of 0.6364 support should confirm short term topping. Intraday bias will be turned back to the downside for 38.2% retracement of 0.5913 to 0.6511 at 0.6283.
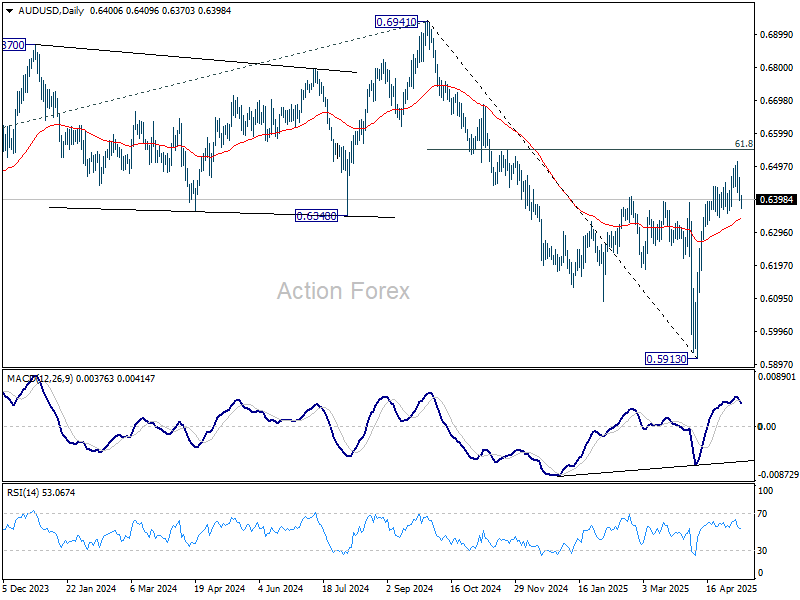
In the bigger picture, as long as 55 W EMA (now at 0.6443) holds, the down trend from 0.8006 (2021 high) should resume later to 61.8% projection of 0.8006 to 0.6169 from 0.6941 at 0.5806. However, sustained trading above 55 W EMA will argue that a medium term bottom was already formed, and set up further rebound to 0.6941 resistance instead.
USD/JPY Daily Outlook
Daily Pivots: (S1) 144.18; (P) 145.18; (R1) 146.91; More...
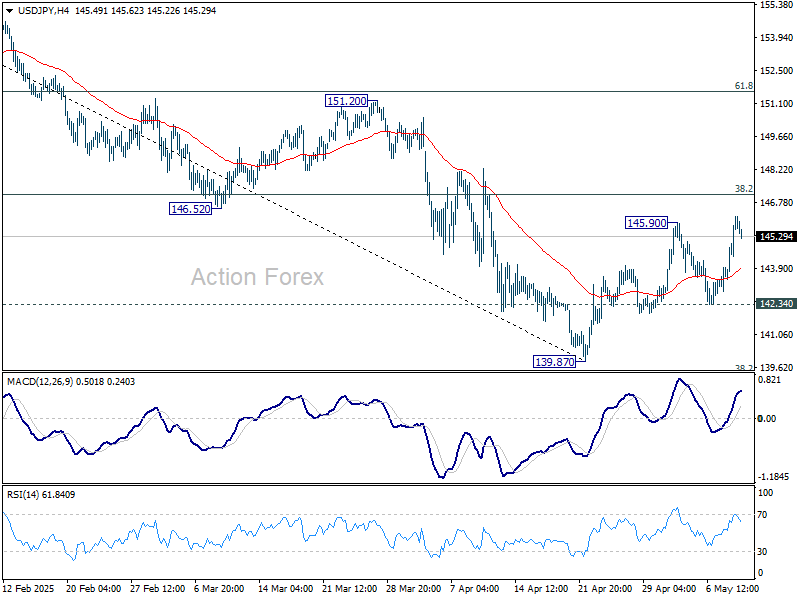
Intraday bias in USD/JPY is back on the upside with breach of 145.90 resistance. Rise from 139.87 is resuming for 38.2% retracement of 158.86 to 139.87 at 147.12. Rejection by 147.12 will retain near term bearishness. Break of 142.34 support will bring retest of 139.87. However, sustained break of 147.12 will indicate near term reversal, and target 61.8% retracement at 151.60.
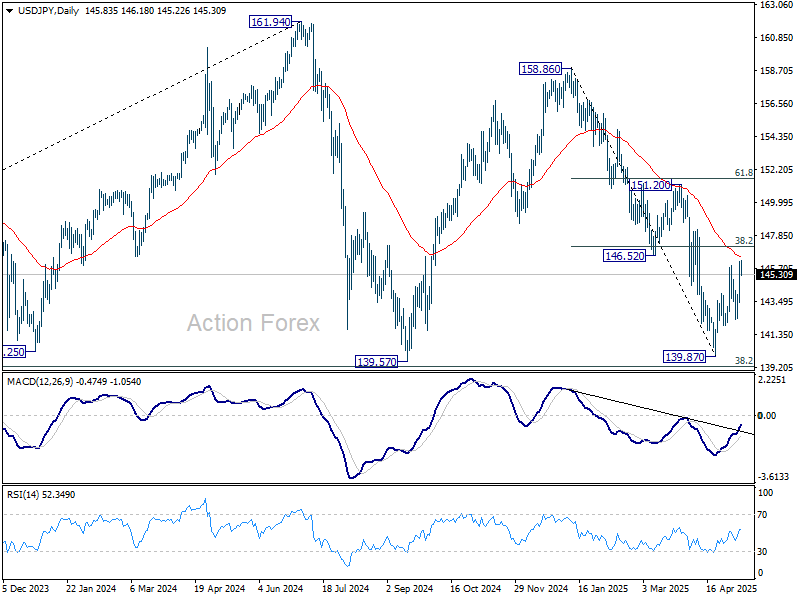
In the bigger picture, price actions from 161.94 are seen as a corrective pattern to rise from 102.58 (2021 low), with fall from 158.86 as the third leg. Strong support should be seen from 38.2% retracement of 102.58 to 161.94 at 139.26 to bring rebound. However, sustained break of 139.26 would open up deeper medium term decline to 61.8% retracement at 125.25.
USD/CHF Daily Outlook
Daily Pivots: (S1) 0.8250; (P) 0.8292; (R1) 0.8359; More….
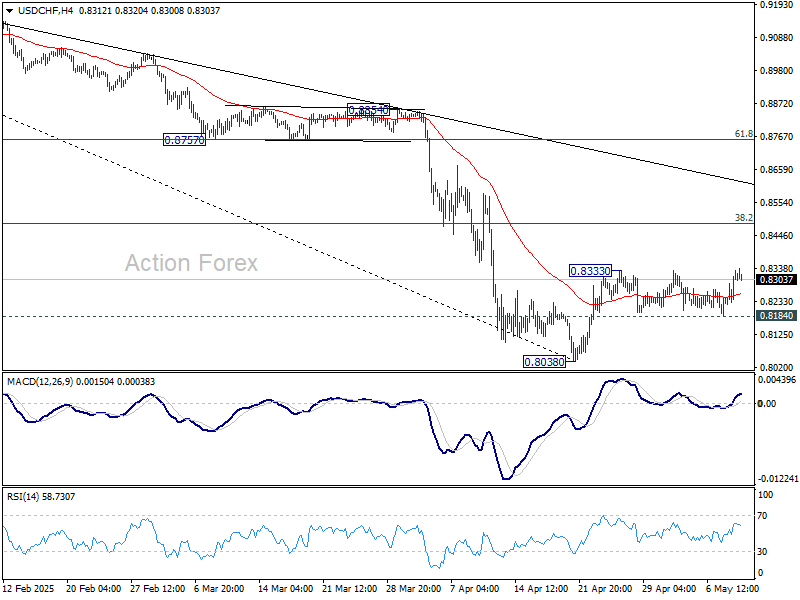
Intraday bias in USD/CHF remains neutral first. One the upside, firm break of 0.8333 will resume the rebound from 0.8038 to 38.2% retracement of 0.9200 to 0.8038 at 0.8482. But strong resistance should be seen there to limit upside. On the downside, sustained break of 0.8184 will bring retest of 0.8038.
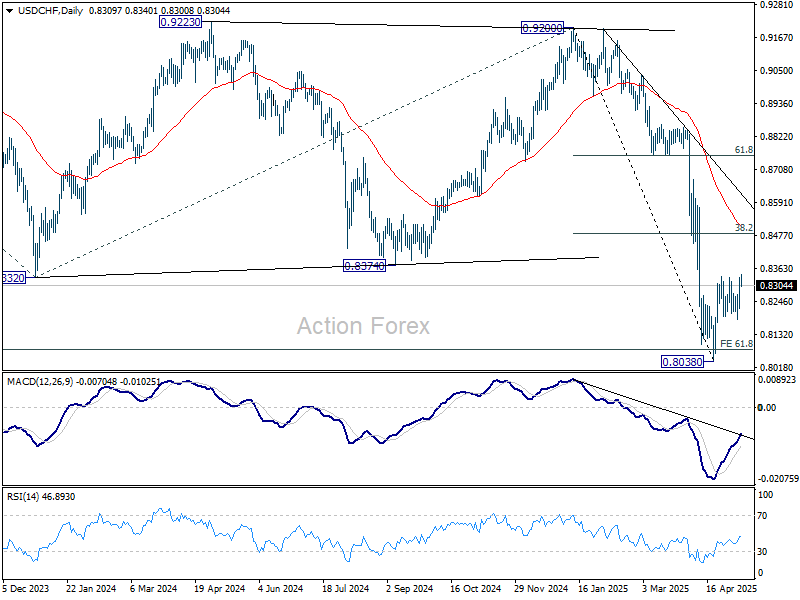
In the bigger picture, long term down trend from 1.0342 (2017 high) is still in progress and met 61.8% projection of 1.0146 (2022 high) to 0.8332 from 0.9200 at 0.8079 already. In any case, outlook will stay bearish as long as 55 W EMA (now at 0.8763) holds. Sustained break of 0.8079 will target 100% projection at 0.7382.
GBP/USD Daily Outlook
Daily Pivots: (S1) 1.3204; (P) 1.3280; (R1) 1.3324; More...
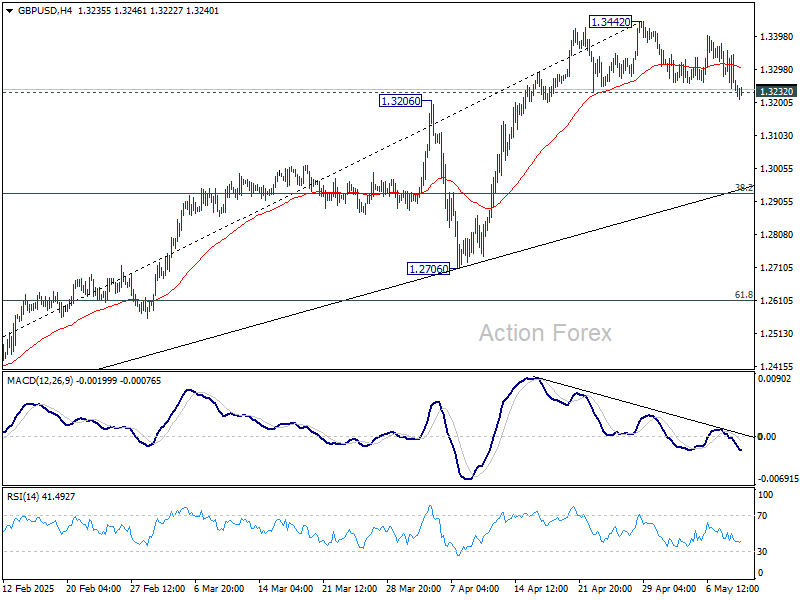
GBP/USD's breach of 1.3232 support indicates short term topping at 1.3442, after rejection by 1.3433 key resistance. Intraday bias is back on the downside for 55 D EMA (now at 1.3056). Firm break there will target 38.2% retracement of 1.2099 to 1.3442 at 1.2929. For now, risk will stay on the downside as long as 1.3442 resistance holds, in case of recovery.
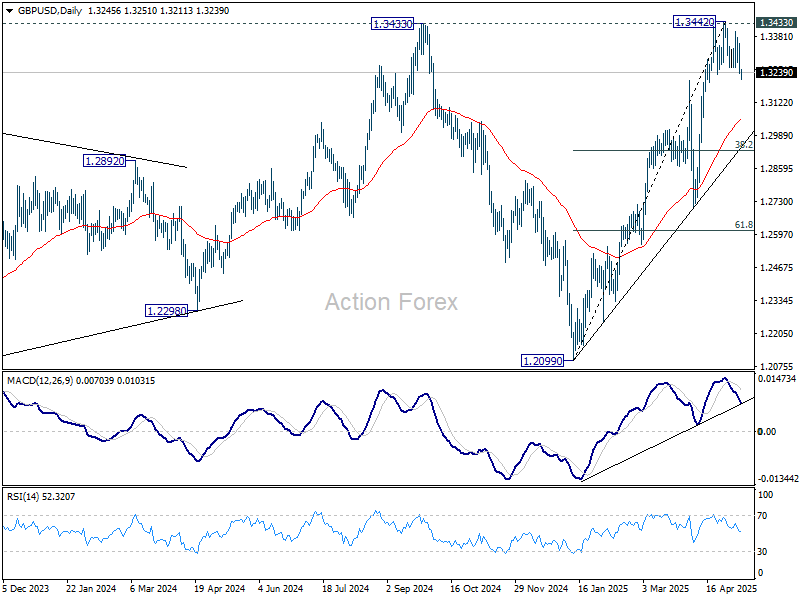
In the bigger picture, price actions from 1.3433 are seen as a corrective pattern to the up trend from 1.3051 (2022 low). Rise from 1.2099 could either be resuming the up trend, or the second leg of a consolidation pattern. Overall, GBP/USD should target 1.4248 key resistance (2021 high) on decisive break of 1.3433 at a later stage.
EUR/USD Lost First Support at 1.1274/76
Markets
Today’s thin eco calendar gives the opportunity to reflect on the past week’s events. First and foremost, the Fed extended its policy rate pause and indicated that the needle in the compass remains pointed at (upside) inflation (risks). The message kicked in yesterday with US yields rising by 7.5 bps (30-yr) to 12.1 bps (5-yr), the belly underperforming the wings. A weak $25bn 30-yr Bond auction contrasted with solid sales of 3-yr and 10-yr Treasuries earlier this week, but didn’t trigger any additional “panic” sales. The likes of Fed Barr, Kugler, Williams, Barkin, Goolsbee and Waller might elaborate on the decision and the Fed’s reaction function in scheduled speeches later today. The sell-off in US T’s also contrasted with the better performance of US equities and the dollar. Both profited from positive trade vibes, coming from the UK-US trade deal (“not a template”), but especially from US President Trump comments suggesting that tariffs against China could be lowered if talks go well. US Treasury Secretary Bessent and trade negotiator Greer meet with Chinese meet with Chinese vice premier He Lifeng in Geneva this weekend in first high-level talks since the trade escalation. The fentanyl issue serves as the icebreaker. Main US equity gauges rallied by up to 1% for Nasdaq. EUR/USD lost first support at 1.1274/76, providing room for a temporary return towards the 1.10-area. Medium-term, we stick to our view that the pair is in a technical buy-the-dip pattern. Monetary policy decisions in Sweden & Norway (status quo) and the Czech Republic & the UK (hawkish 25 bps rate cuts) are another reflection point. Central banks clearly stated that the huge amount of uncertainty actually numbs the short term decision making process. They align with the Powell view that it takes more data to see which risks to the growth and inflation outlook effectively materialize. In the case of the UK and the BoE, the MPC clearly downplayed the doom and gloom scenarios that some investors currently take into account. The UK Gilt curve bear flattened yesterday with yield rising by 6.5 bps (30-yr) to 12.4 bps (2-yr) as the BoE remains on a gradual (quarterly) rate cutting pace. EUR/GBP tested first support at 0.8474 and closed just above that handle. BoE governor Bailey and BoE chief economist Pill will today elaborate on the decision making process. Yesterday’s central bank outcomes put aggressive market pricing on future ECB policy, both from a timing and from a structural perspective, into doubt but didn’t trigger a real momentum change. Daily changes on the German curve varied between +5 and +6 bps yesterday.
News & Views
Chinese exports (USD terms) in April rose 8.1% y/y, way more than the 2% expected. April was the first month capturing the effects of the disruptive import tariffs announced on Liberation Day (April 2). That explains the low consensus bar. Chinese exports to the US indeed slumped around 20% but were compensated by a similar-sized increase to other Asian nations and by an 8% uptick to the EU. It’s expected that this rerouting will pick up in the coming months as well. Chinese imports from the US dropped by 14%, a consequence of the retaliatory Chinese import tariffs. Total imports fell 0.2% y/y compared to the -6% expected. China’s yuan weakens today in a move that already took place ahead of the data. USD/CNY rises for a third day straight to the 7.25 area, erasing a large part of the losses in the wake of the PBOC’s significantly lower fixing on Tuesday.
The Polish zloty yesterday appreciated towards EUR/PLN 4.25 from 4.27 after National Bank of Poland governor Glapinski explained Wednesday’s 50 bps rate cut in more detail. He said inflation has peaked and an improved CPI outlook allowed for some easing. But Glapinski warned the fight isn’t won yet and said the first rate cut since end 2023 doesn’t mean the start of a cycle. The central bank is now back at wait-and-see, he said, adding that future policy moves hinge on the July projection. Were the NBP to cut further, the governor suggested it would be by 25 bps rather than the 50 bps they did earlier this week. MPC member Kotecki in some comments this morning favours a total of 100 bps this year with a follow-up move preferably in September. Wnorowski weighed in as well, with July seen as the earliest possible occasion for another, normal-sized cut.
Habemus a Trade Deal
Not only do we have a new pope this week, but we also have the first deal in Trump’s global trade war - between the UK and the US. Trump’s enthusiastic announcement, complete with a lot of CAPITAL LETTERS, helped inflate sentiment, making this US-UK deal feel bigger than it actually is.
I mean, the fact that the two countries could agree on a few points is a good start, but the UK entered the negotiations with a tariff rate of 10% and left the table with... a tariff rate of 10%. Sure, the tariffs on cars were pulled lower from 27.5% to 10% — leading to an almost 14% jump in Aston Martin. Rolls Royce’s plane engines are exempt from tariffs in exchange for a pledge from British Airways to buy $10bn worth of Boeing planes — Rolls Royce jumped by more than 3.5%. The tariff on UK steel will be cut to zero, while British farmers will benefit from tariff-free quotas — just like their US counterparts. The two countries also agreed to keep working on a digital agreement.
But again, the 10% tariffs remain. So yes, it’s a deal — but is it a big deal? One person at Axios even said that the UK was the "low-hanging fruit of trade deals" and that negotiations won’t be as simple with others. We’ll see. Futures this morning are slightly in the green.
The news of the US-UK deal resonated positively across global financial markets. Major US indices extended gains despite a selloff in US Treasuries that pushed the 10-year yield back to the 4.40% level. Maybe part of the optimism was also fuelled by FOMO after Trump posted “go out and buy stocks now!”
But enthusiasm was dented by questions over the greatness of the deal and the challenges ahead — so sentiment remains fragile.
The dollar index rebounded strongly to an almost one-month high. The EURUSD tumbled to the 1.12 level — the minor 23.6% Fibonacci retracement on the year-to-date rally — and is consolidating near that level this morning. Meanwhile, Cable is preparing to test the 1.32 level and the USDCHF rallied past the month-high levels. The FX moves are a suggestion of how markets could react to further progress in tariff talks.
Note, however, that despite strong gains in some sectors, the FTSE 100 closed yesterday’s session in the red. That was partly due to a hawkish cut from the Bank of England (BoE) — where two members didn’t want to cut rates at all due to inflation uncertainty. It was also partly AstraZeneca’s fault — the stock alone shed 270 points from the index — and partly due to losses in miners, as copper prices extended losses for a third straight session on concerns over slowing demand from China. Gold also came under pressure from hopes of easing global trade tensions.
Bitcoin, on the other hand — another proxy for Trump trade — rallied more than 6% to surpass the $100K mark. We’re near $102K as of this morning.
In summary, yesterday’s price action suggests that investors are eager for good news and react positively — even if the news isn’t that great. It’s all in how it’s delivered — and apparently, that’s all that matters.
Now, all eyes are on the first in-person meeting between US and Chinese high-level officials in Geneva tomorrow to discuss tariffs. The goal isn’t to seal a trade deal — that will probably take months, if not years — but to de-escalate tensions between the two countries. And who knows — maybe they’ll agree to pause tariffs while discussions continue. Impossible to tell. In the best-case scenario, talks go well, both countries commit to finding a reasonable deal, markets rally on Monday, the US dollar continues rebounding, and gold and the franc retreat further. Or… the talks break down, Trump says something he shouldn’t, and we wake up to another hectic week — with a global selloff in equities and the dollar, and a rebound in gold and franc. I’d say it’s a 60-40 chance for good versus bad vibes.
In energy, the week ends on a better note than it started. US crude is back at the $60pb level after an early-week plunge to $55 on news that OPEC would accelerate plans to restore output — for reasons that remain unclear.
But whatever the reasons, the medium-term outlook remains comfortably bearish given higher supply and lower demand expectations. Price rallies remain interesting top-selling opportunities, with a target at $50pb. Minor resistance is at $61.75 — the 23.6% Fibonacci retracement on the YTD decline — while stronger offers may appear near the 50-DMA (currently around $64.70pb) and the $65 level, which matches the April peak and major 38.2% retracement. That level should help distinguish between a continuation of the current bearish trend and a potential medium-term reversal.
On a side note, falling oil prices are supporting consolidation in the energy sector as companies look to benefit from synergies. In that context, this week’s news that Shell is exploring a deal to acquire BP — in what would be a historic merger in Europe — has echoed across the energy space. A combined Shell-BP would rival ExxonMobil in scale.
Alas, BP saw limited gains this week… one to keep an eye on.
US and China Set to Meet Over the Weekend to Resolve Current Deadlock
In focus over the weekend
The Norwegian inflation figures for April will be released today. Inflation surprised strongly on the upside in February and dragged the price level into March. In line with consensus, we expect that core inflation decreased from 3.4% to 3.2% in April, driven by somewhat lower growth in food prices and other Norwegian-produced goods than in April last year.
Over the weekend US and China will kick off trade talks in Switzerland after a long deadlock in the trade war. The main goal of the talks will be to agree on lowering tariffs from the current prohibitively high rates, which are a de facto trade embargo on most goods. We believe they will agree on getting tariffs down to around 60% soon, as the economic pain is growing on both sides.
Economic and market news
What happened overnight
In South Asia, India and Pakistan continue to spiral into further tensions as the conflict worsens. Two Indian fighter jets are reported to have been shot down, artillery bombing in the Indian Kashmir region and drone attacks along India's west boarder which Pakistan has denied.
In China, exports increased by 8.1% y/y in April, significantly more than consensus expectations of 1.9% y/y. Imports declined by just -0.2% y/y, defying consensus expectations of -5.9% y/y. The stronger-than-expected data could provide China with additional incentive to stand firm in the upcoming negotiations with the US in Switzerland over the weekend.
In Japan, real labour earnings for March declined 2.1% y/y, while household spending overshot expectations significantly at 2.1% y/y and 0.4% m/m (cons: 0.2% y/y, -0.5% m/m).
What happened yesterday
In the trade war, the UK and US announced a new trade deal. While the flat 10% universal tariff rate on the UK remains in place, the deal between the US and the UK includes a cut of tariffs on UK cars from 27.5% to 10% and a removal of tariffs on steel and aluminum. In return, the UK will offer improved access to US agricultural and industrial products and an agreement on planes. While the deal is a positive development in the trade war, many details are still to be laid out and the impact is limited.
In Germany, industrial production rose more than anticipated in March by 3.0% m/m (cons: 1.0% m/m). With the data for March, it is now more evident that the German industry has bottomed out as production has stopped declining, also seen in the PMIs for April. Data is volatile from month to month and some front loading to the US could also be at play. So, we have yet to see a clear rebound in the German industry, but at least it looks like we have hit the bottom, and we expect production to start rising this year as lower ECB interest rates feed into the sector.
In Norway, Norges Bank kept rates unchanged and avoided giving any new policy signals. The market reaction was non-existent amid very little news and low expectations. We still expect the first rate cut in September as the central bank signalled in March.
In Sweden, the Riksbank held the interest rate at 2.25% as expected. They did however suggest slight easing of monetary policy going forward. Although the tone was somewhat to the dovish side compared to recent communication, it is still quite a bit more restrictive compared to how the Riksbank communicated upcoming rate cuts last year.
In the UK, the BoE decided to cut the Bank Rate by 25bp to 4.25% yesterday. The vote split showed a surprisingly divided MPC with the statement tilting towards a hawkish bias. However, we do not see this as a broad shift in sentiment within the MPC. The statement revealed that BoE still favours a "gradual" and "careful" approach to easing monetary policy whilst highlighting elevated uncertainty. Price action in GBP was also largely driven by good news on the trade front.
Equities: Equities rallied broadly yesterday, with a distinct shift towards pro-cyclical and pro-Trump market dynamics. US equities outperformed their global peers, with cyclicals leading the charge. Small caps notably outperformed large caps, while the VIX declined. A slight note of caution could be noted as yields rose alongside oil prices. However, in the current environment, these moves should be viewed positively - as a reflection of growth optimism and rising investor confidence in the US economy. It is encouraging to witness both a stronger risk appetite and simultaneous increases in yields and oil prices. In the U.S. yesterday, the Dow was up 0.6%, the S&P 500 rose by 0.6%, the Nasdaq climbed 1.1%, and the Russell 2000 surged 1.9%. This morning, Asian equities are trading higher, led by Japan, and both European and US futures point marginally higher.
FI&FX: There was a sharp rise in global bond yields yesterday driven from the long end, where 10Y German govt yields rose some 6bp, while 10Y US Treasuries rose 5.5bp on the back of the announcement of trade deal between US and UK, where the details point to a very modest set of tariffs. Hence, this boosted the risk-on sentiment with higher yields, stronger equity markets and stronger USD.