Sample Category Title
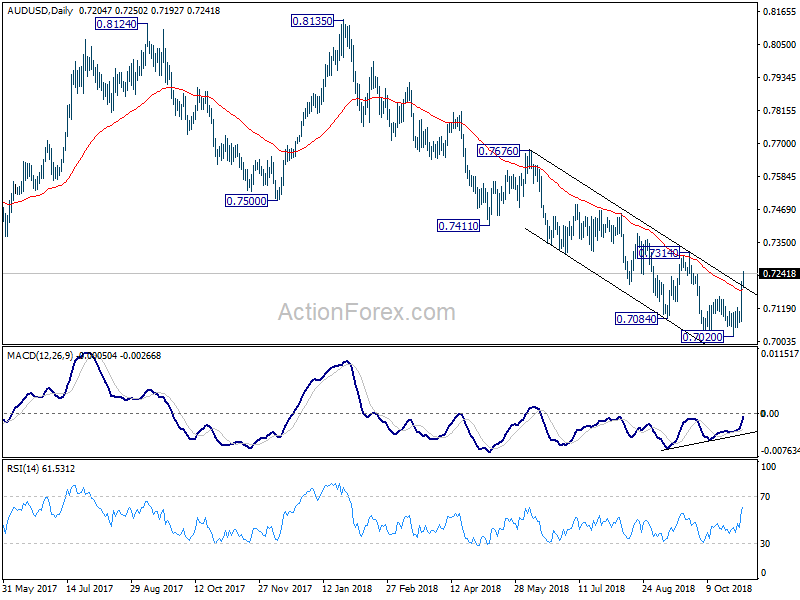
Gold: Yellow Metal Trading Lower In The Asian Session
For the 24 hours to 23:00 GMT, Silver rose 3.33% against the USD and closed at USD14.76 per ounce, tracking gains in gold prices.
In the Asian session, at GMT0400, the pair is trading at 14.68, with silver trading 0.54% lower against the USD from yesterday’s close.
The pair is expected to find support at 14.37, and a fall through could take it to the next support level of 14.07. The pair is expected to find its first resistance at 14.91, and a rise through could take it to the next resistance level of 15.14.
The white metal is showing convergence with its 20 Hr moving average and trading above its 50 Hr moving average.
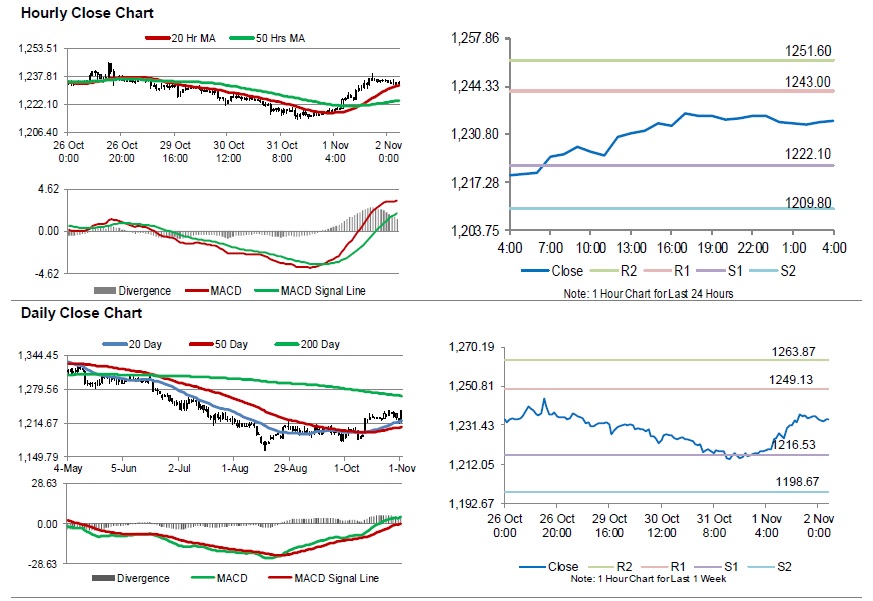
Silver: White Metal Trading On A Weaker Footing In The Morning Session
For the 24 hours to 23:00 GMT, Silver rose 3.33% against the USD and closed at USD14.76 per ounce, tracking gains in gold prices.
In the Asian session, at GMT0400, the pair is trading at 14.68, with silver trading 0.54% lower against the USD from yesterday’s close.
The pair is expected to find support at 14.37, and a fall through could take it to the next support level of 14.07. The pair is expected to find its first resistance at 14.91, and a rise through could take it to the next resistance level of 15.14.
The white metal is showing convergence with its 20 Hr moving average and trading above its 50 Hr moving average.
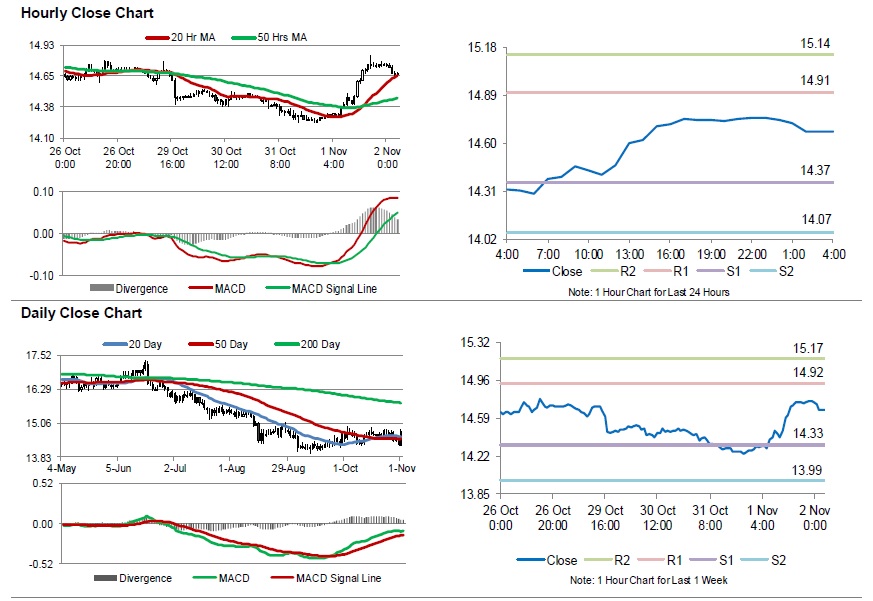
Crude Oil: Oil Trading Lower, Ahead Of Baker Hughes Weekly Rig Count Data
For the 24 hours to 23:00 GMT, Crude Oil declined 2.19% against the USD and closed at USD63.56 per barrel, amid fears that global demand is weakening.
In the Asian session, at GMT0400, the pair is trading at 63.35, with oil trading 0.33% lower against the USD from yesterday’s close.
The pair is expected to find support at 62.51, and a fall through could take it to the next support level of 61.67. The pair is expected to find its first resistance at 64.79, and a rise through could take it to the next resistance level of 66.23.
Crude oil is trading below its 20 Hr and 50 Hr moving averages.
EUR/USD Develops Bullish Momentum And Wave 3 Pattern
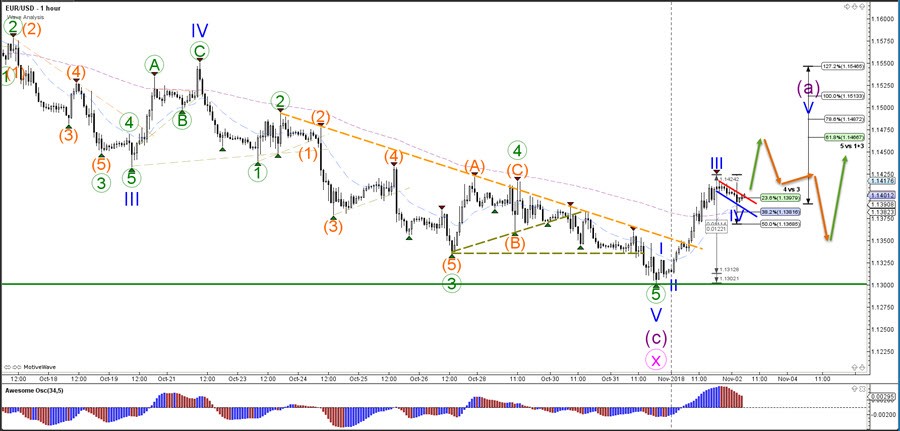
The EUR/USD bullish breakout above that resistance trend line (orange) could indicate the potential for a larger bullish move. A bearish bounce occur first as price makes a retracement back the inverted head and shoulders pattern before a bullish breakout could take place.
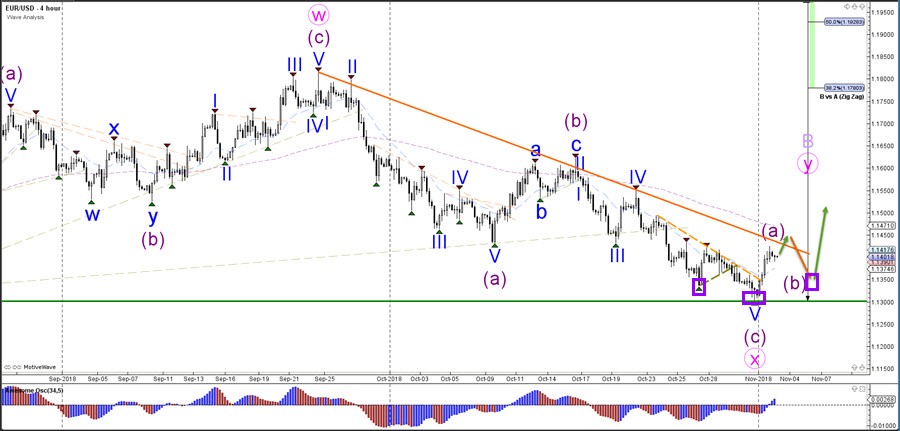
The EUR/USD is showing strong bullish momentum. The push up is probably an impulsive wave 3 (blue) and a continuation could be part of a wave 5 (blue) of wave A (purple). TheFibonacciretracement levels of wave 4 vs 3 are expected to act as potential support levels.
GBP/USD Daily Outlook
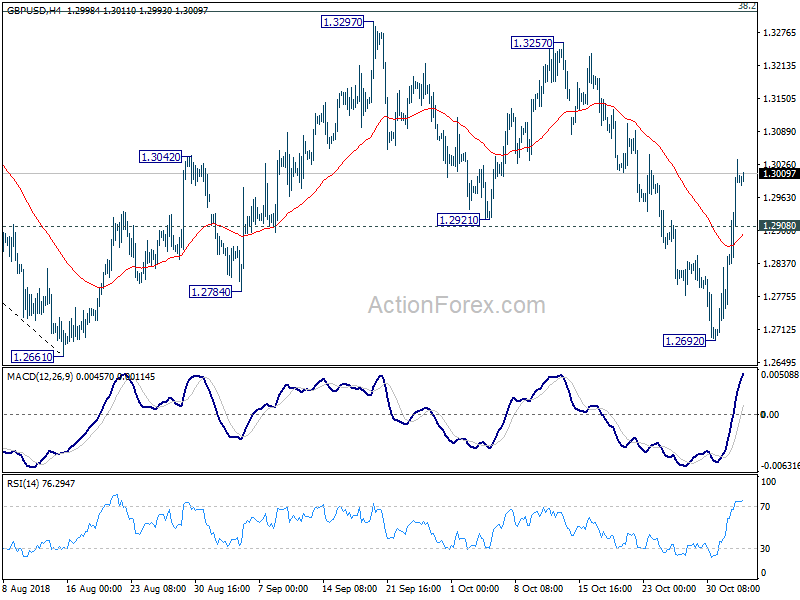
Daily Pivots: (S1) 1.2825; (P) 1.2925; (R1) 1.3099; More...
Intraday bias in GBP/USD remains on the upside for the moment. Rebound form 1.2692 is in progress for 1.3297 resistance. For now, price actions from 1.2661 are seen as a consolidation pattern. We'd expect strong resistance from 1.3316 fibonacci level to limit upside to bring down trend resumption eventually. On the downside, below 1.2908 minor support will turn bias back to the downside for 1.2692 instead.
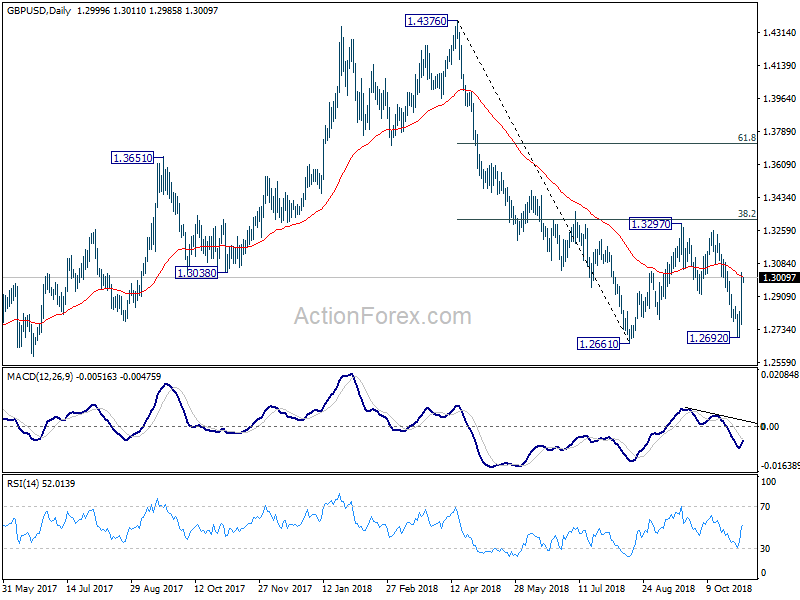
In the bigger picture, whole medium term rebound from 1.1946 (2016 low) should have completed at 1.4376 already, after rejection from 55 month EMA. The structure and momentum of the fall from 1.4376 argues that it's resuming long term down trend. And this will be the preferred case as long as 38.2% retracement of 1.4376 to 1.2661 at 1.3316 holds. However, firm break of 1.3316 would bring stronger rebound to 61.8% retracement at 1.3721. And, the eventual depth of the fall from 1.4376, and the chance of hitting 1.1946 low, will depend on the strength of the interim corrective rebound from 1.2661.
EUR/USD Daily Outlook
Daily Pivots: (S1) 1.1335; (P) 1.1379; (R1) 1.1455; More....
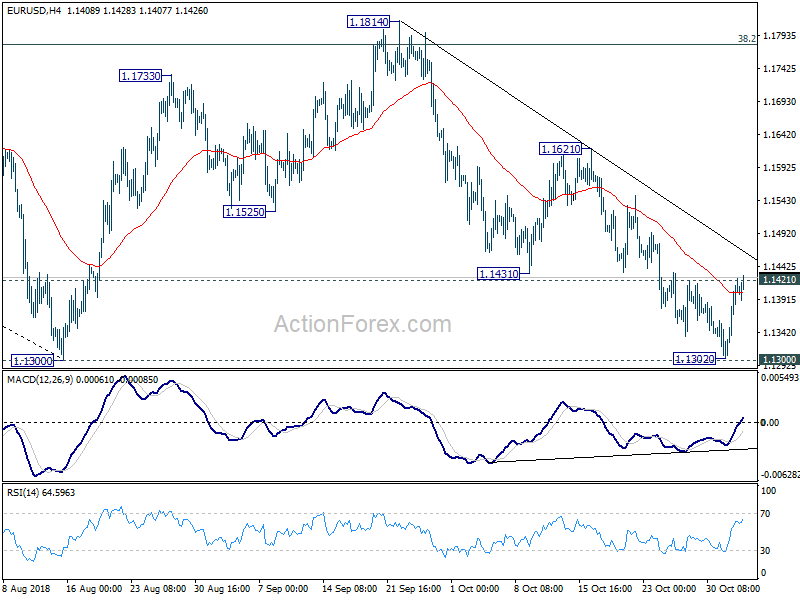
EUR/USD's break of 1.1421 resistance argues that fall from 1.1814 has completed at 1.1302 already, ahead of 1.1300 key support, on bullish convergence condition in 4 hour MACD. Intraday bias is turned back to the upside for 1.1621 resistance and possibly above. For now, price actions from 1.1300 are seen as a consolidation pattern. Hence, upside should be limited by 1.1814 to bring down trend resumption eventually. On the downside, break of 1.300 will resume whole down trend from 1.2555 and target 1.1186 fibonacci level next.
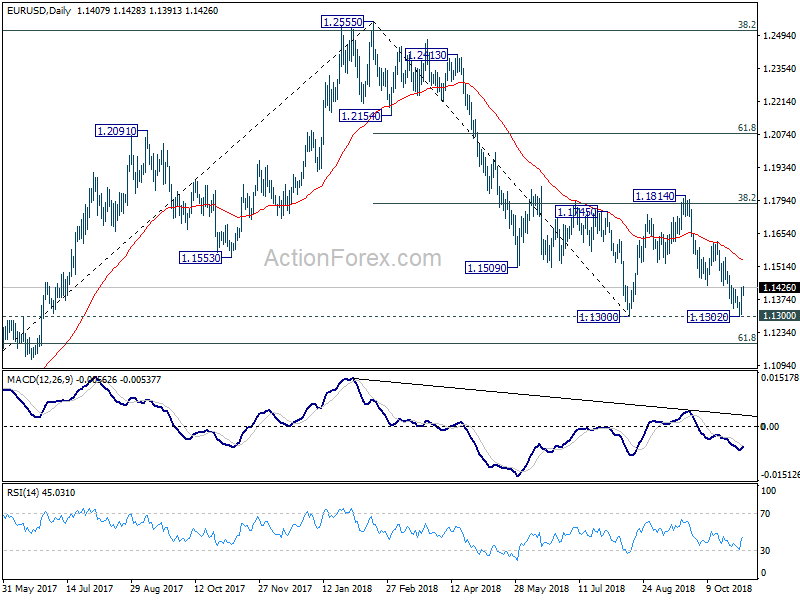
In the bigger picture, corrective pattern from 1.1300 could have completed at 1.1814 after hitting 38.2% retracement of 1.2555 to 1.1300 at 1.1779. Decisive break of 1.1300 will resume the down trend from 1.2555 to 61.8% retracement of 1.0339 (2017 low) to 1.2555 at 1.1186 next. Sustained break there will pave the way to retest 1.0339. On the upside, break of 1.1814 will delay the bearish case and extend the correction from 1.1300 with another rise before completion.
USD/CHF Daily Outlook
Daily Pivots: (S1) 0.9984; (P) 1.0038; (R1) 1.0076; More...
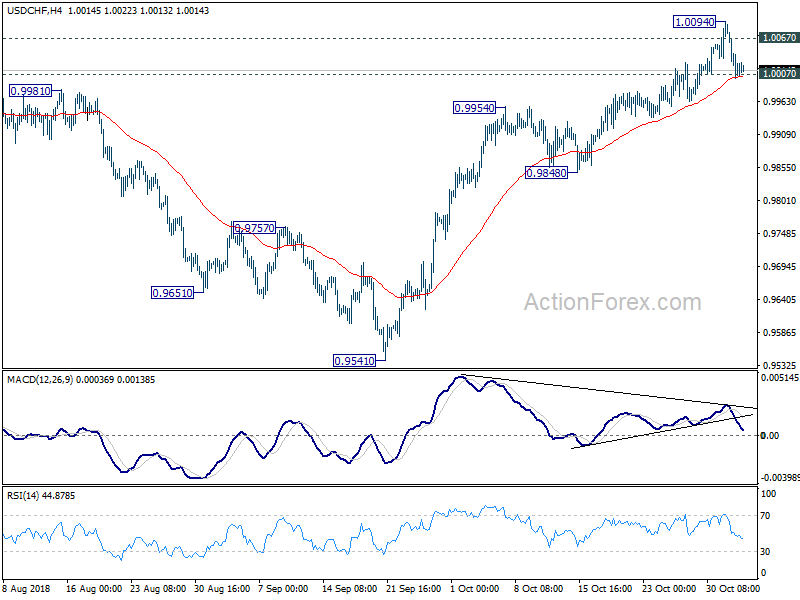
Intraday bias in USD/CHF remains neutral first. Considering bearish divergence condition in 4 hour MACD, break of 1.0007 minor support will suggests near term reversal. Intraday bias will be turned back to the downside for 0.9848/9954 support zone. On the upside, though, break of 1.0094 and sustained trading above 1.0067 will confirm resumption of larger rise from 0.9186 and should target 1.0342 key resistance next.
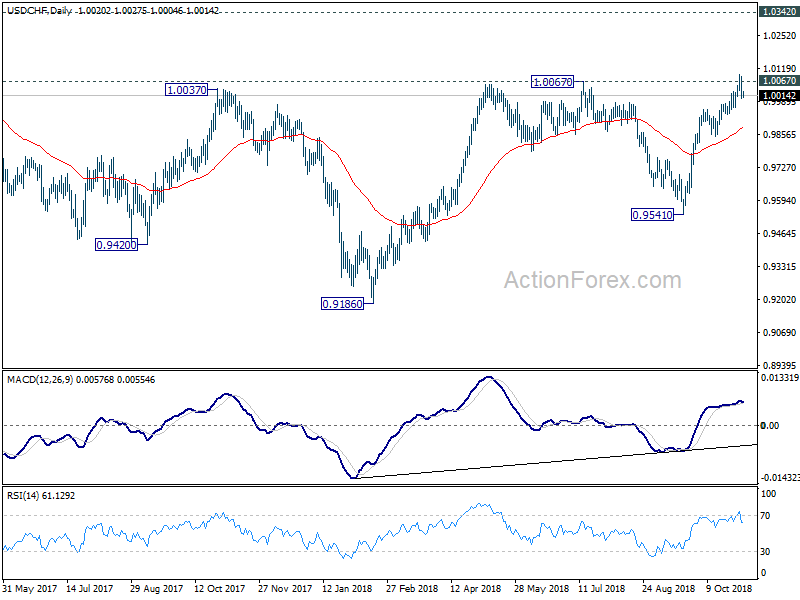
In the bigger picture, the pullback from 1.0067 has completed at 0.9541 already. And rise from 0.9186 is likely resuming. Firm break of 1.0067 will pave the way to retest 1.0342 key resistance. We'd be cautious on strong resistance from there to limit upside to bring another medium term fall to extend long term range trading.
USD/JPY Daily Outlook
Daily Pivots: (S1) 112.53; (P) 112.78; (R1) 112.95; More..
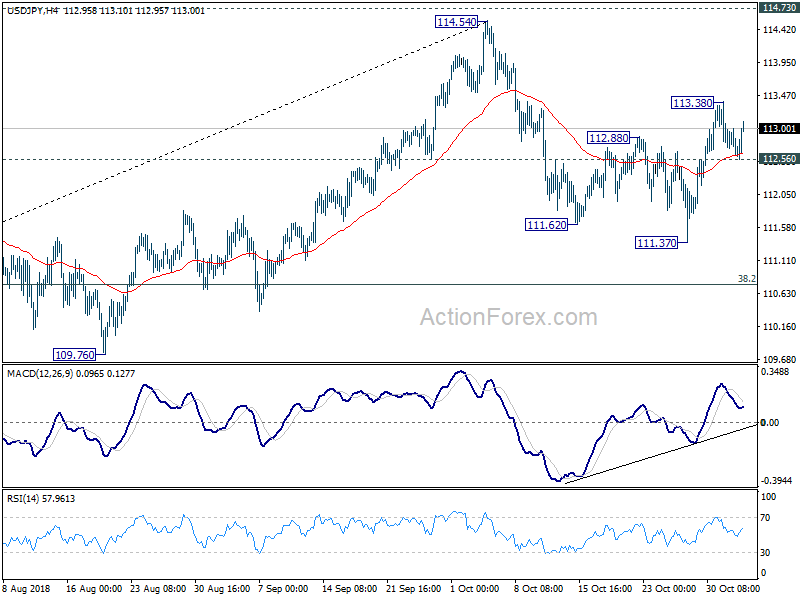
Intraday bias in USD/JPY stays neutral at this point. Further rise is mildly in favor with 112.56 minor support intact. On the upside, above 113.38 will extend the rebound from 111.37 to 114.54/73 key resistance zone. On the downside, break of 112.56 will likely extend the correction from 114.54 to 38.2% retracement of 104.62 to 114.54 at 110.75 before completion.
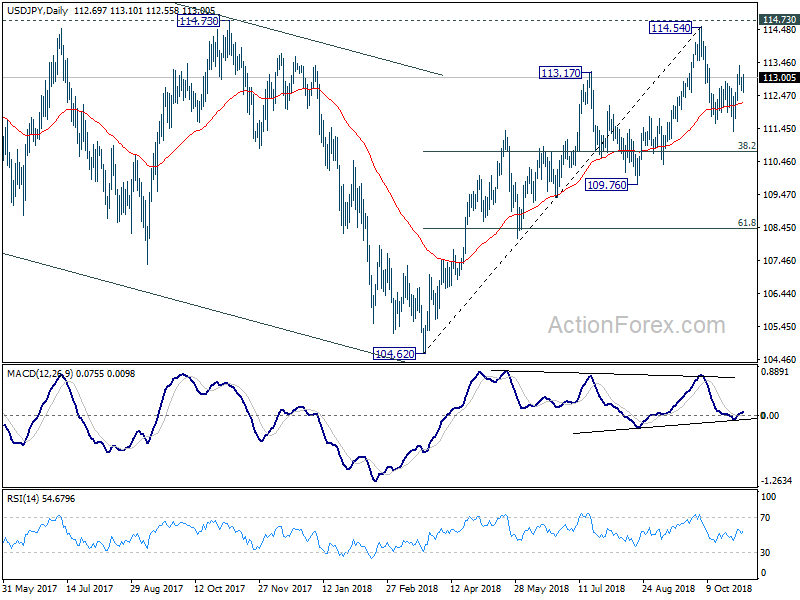
In the bigger picture, corrective fall from 118.65 (2016 high) should have completed with three waves down to 104.62. Decisive break of 114.73 resistance will likely resume whole rally from 98.97 (2016 low) to 100% projection of 98.97 to 118.65 from 104.62 at 124.30, which is reasonably close to 125.85 (2015 high). This will stay as the preferred case as long as 109.76 support holds. However, decisive break of 109.76 will dampen this bullish view and turns outlook mixed again.
USD/CAD Daily Outlook
Daily Pivots: (S1) 1.3047; (P) 1.3109; (R1) 1.3149; More...
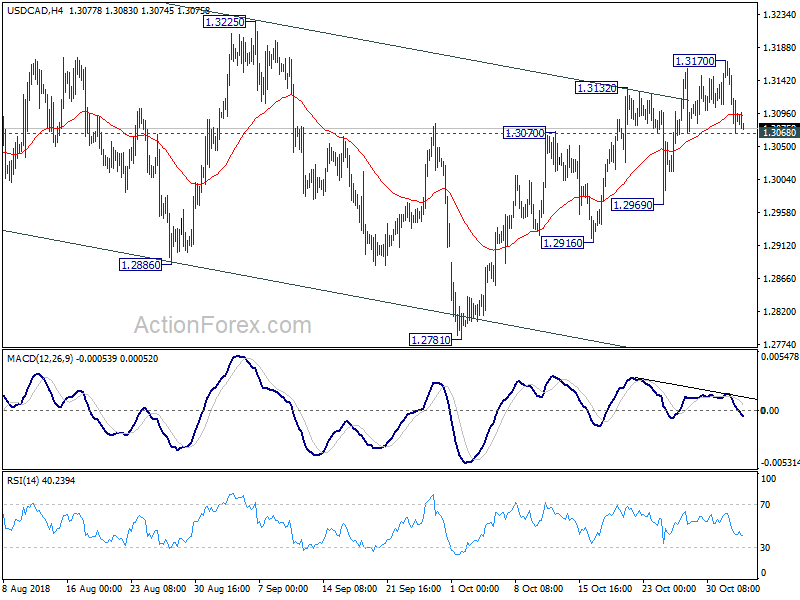
Intraday bias in USD/CAD is turned neutral with a temporary top in place at 1.3170. On the downside, break of 1.3068 minor support will bring turn bias to the downside for 1.2969 support. Firm break there will indicate completion of whole rebound from 1.2781. In that case, whole fall from 1.3385 might extend through 1.2781 support before completion. On the upside, above 1.3170 will extend the rise from 1.2781 to 1.3225 key near term resistance next.
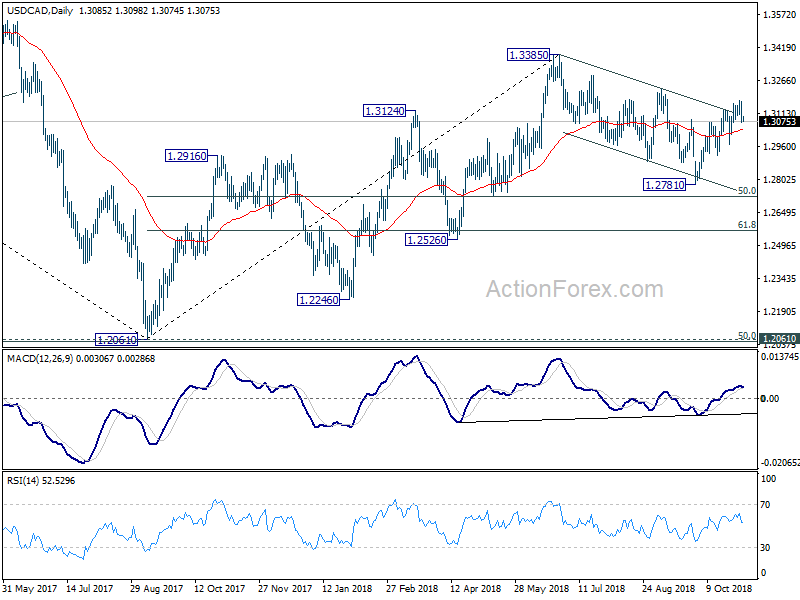
In the bigger picture, current development revives the case that corrective fall from 1.3385 has completed at 1.2781 already. And whole up trend from 1.2061 (2016 low) is ready to resume. Break of 1.3385 will target 61.8% retracement of 1.4689 (2016 high) to 1.2061 at 1.3685. This will now be the favored case as long as 1.2781 support holds.
AUD/USD Daily Outlook
Daily Pivots: (S1) 0.7115; (P) 0.7164; (R1) 0.7256; More...
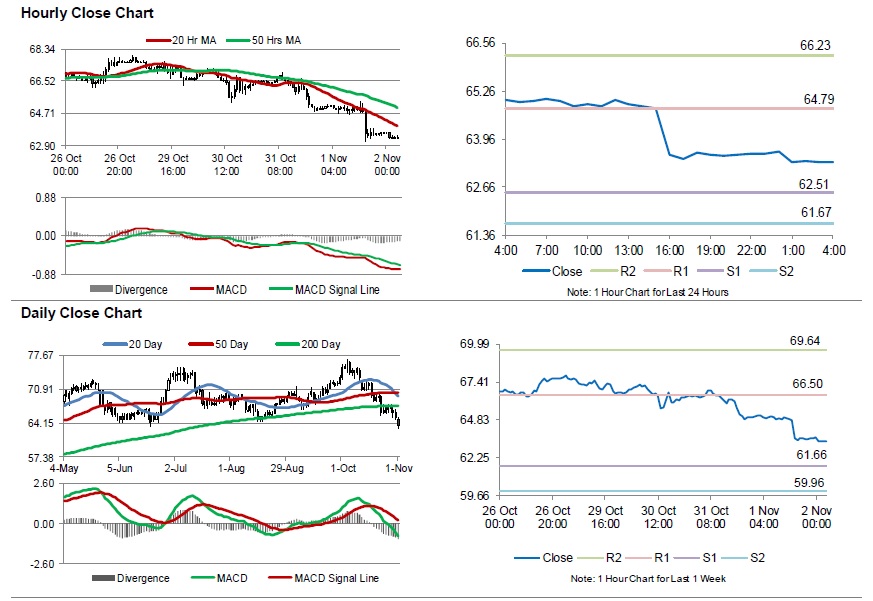
AUD/USD's rally accelerates further to as high as 0.7250 so far today. The case for medium term reversal continues to build up, with bullish convergence condition in daily MACD and break of falling channel resistance. Intraday bias stays on the upside for 0.7314 resistance next. Decisive break there will confirm the bullish case. However, rejection from 0.7314, followed by break of 0.7159 resistance turned support, will retain bearishness and turn focus back to 0.7020 low.
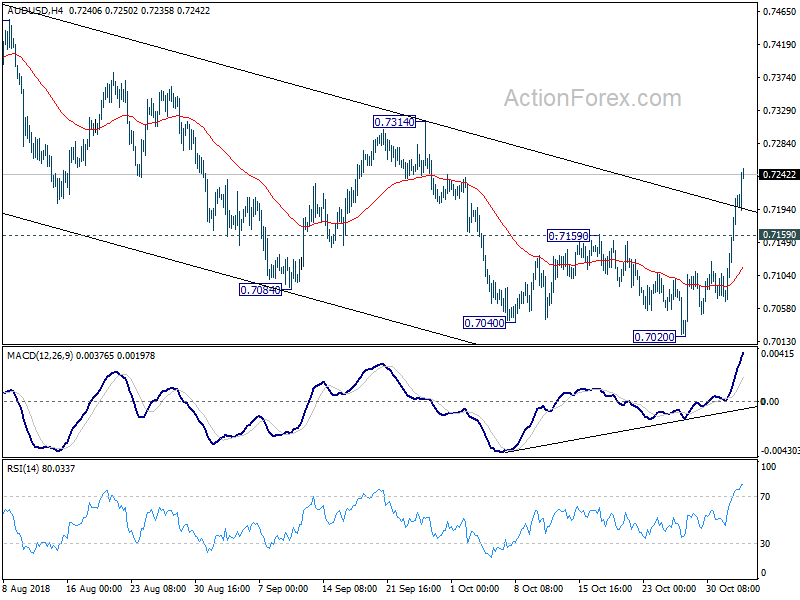
In the bigger picture, fall from 0.8135 is tentatively treated as resuming long term down trend from 1.1079 (2011 high). Decisive break of 0.6826 will target 0.6008 key support next (2008 low). On the upside, break of 0.7314 resistance is needed to indicate medium term bottoming. Otherwise, outlook stays bearish even in case of strong rebound. However, firm break of 0.7314 will suggest that whole decline from 0.8135 has completed and bring stronger rise back to 55 week EMA (now at 0.7467).