Sample Category Title
US ISM: Manufacturing Activity Slips But Continues to Expand at a Healthy Pace in October
The Institute for Supply Management (ISM) manufacturing index dropped 2.1 percentage points to 57.7 in October. Markets were expecting a more modest decline of 0.8 percentage points to 59. Although this marks the second consecutive month of decline in the headline index, overall activity remains consistent with an ongoing healthy expansion in the U.S. manufacturing sector.
With the exception of supplier deliveries, the main subcomponents of the index declined in the month, but still remain at healthy levels. New orders fell 4.4 points to 57.4, and production shed 4 points to 59.9. Employment fell back a bit (-2) to 56.8.
The trade components of the report were disappointing. New export orders fell to 52.2, and imports fell to 54.3. These levels remain well below those recorded at the time the U.S. administration levied tariffs on steel and aluminum imports this past March.
Thirteen of eighteen manufacturing industries reported growth in October. Four industries reported contraction: wood products, primary metals, nonmetallic mineral products, and fabricated metal products.
Key Implications
The U.S. manufacturing sector continues to expand at a healthy pace, although momentum appears to be waning. American manufacturers are facing a number of headwinds that are acting to hold back a further expansion in activity, and the USMCA doesn't appear to be offering much relief. New tariffs implemented on September 24th on Chinese imports are the latest in a number of challenges cited by survey respondents, which include rising input costs, component shortages, and difficulty finding qualified labor. Moreover, these same constraints are being echoed in other surveys as well, suggesting that the U.S. economy is operating closer to its capacity, with building price pressures becoming ever more likely to be passed along to end users.
More broadly, this report affirms the divergence theme that has driven capital out of emerging markets and into the U.S., strengthening the dollar this year. In contrast to healthy U.S. activity, global PMIs released earlier are signaling a material slowdown in foreign manufacturing activity in October, particularly in China and its supply chain partners in East Asia. As global growth continues to slow from its peak in the first half of this year, a potential escalation in trade tensions between the U.S. and China could result in an even greater slowdown in demand than anticipated, and may result in further bouts of financial market volatility.
Trump had very good conversation with Xi, with heavy emphasis on trade
Trump tweeted that he had "very good conversation" with Chinese President Xi Jinping, "with heavy emphasis on Trade".
https://twitter.com/realDonaldTrump/status/1057997981922873344
However, White House economic adviser Larry Kudlow, threatens that Trump would act aggressively on China if they failed to reach an agreement.
https://twitter.com/LiveSquawk/status/1057992787772235776
Sounds like Kudlow doesn't know who's his boss.
AUD/USD Mid-Day Outlook
Daily Pivots: (S1) 0.7057; (P) 0.7083; (R1) 0.7097; More...
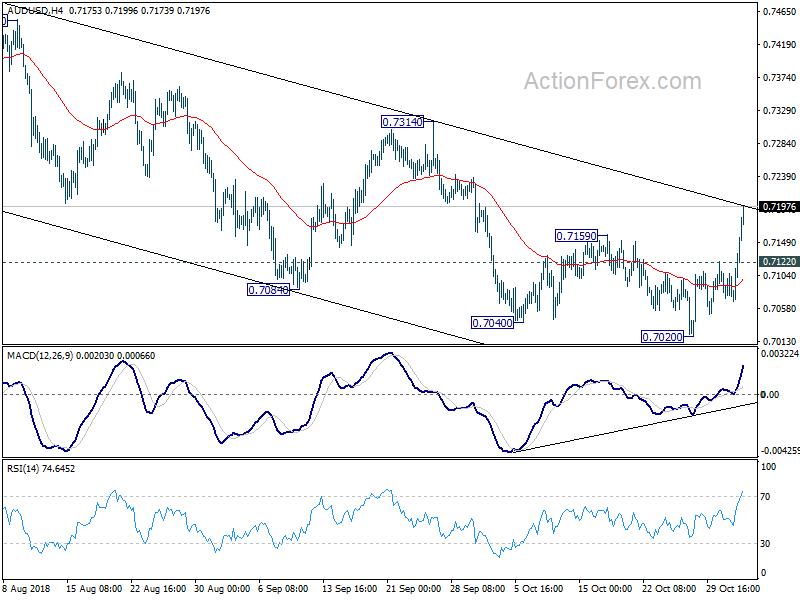
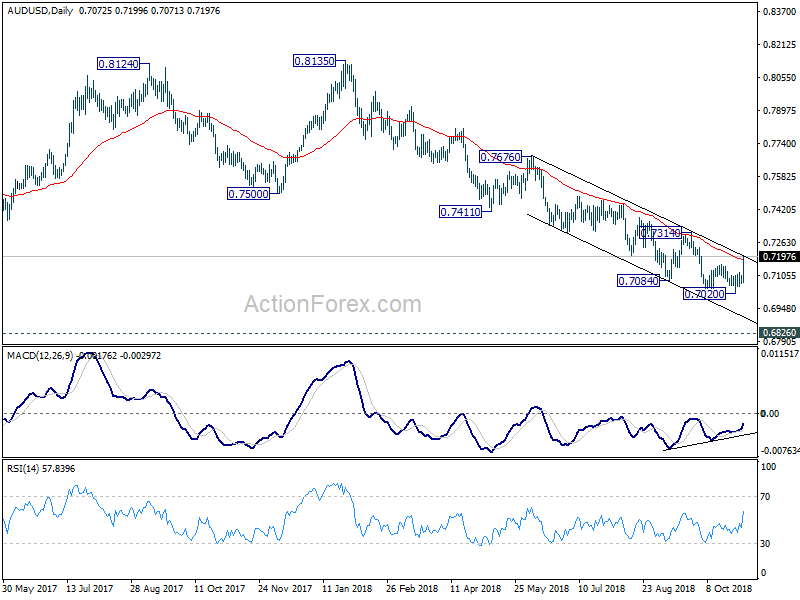
AUD/USD's rebound from 0.7020 accelerates to as high as 0.7199 so far today. The solid break of 0.7159 resistance serves as the first sign of medium term reversal, on bullish convergence condition in 4 hour MACD. Intraday bias is now on the upside for 0.7314 resistance for confirmation. On the downside, though, 0.7122 minor support will retain bearishness and turn bias back to the downside for 0.7020 low.
In the bigger picture, fall from 0.8135 is tentatively treated as resuming long term down trend from 1.1079 (2011 high). Decisive break of 0.6826 will target 0.6008 key support next (2008 low). On the upside, break of 0.7314 resistance is needed to indicate medium term bottoming. Otherwise, outlook stays bearish even in case of strong rebound.
EUR/USD Mid-Day Outlook
Daily Pivots: (S1) 1.1289; (P) 1.1325; (R1) 1.1350; More....
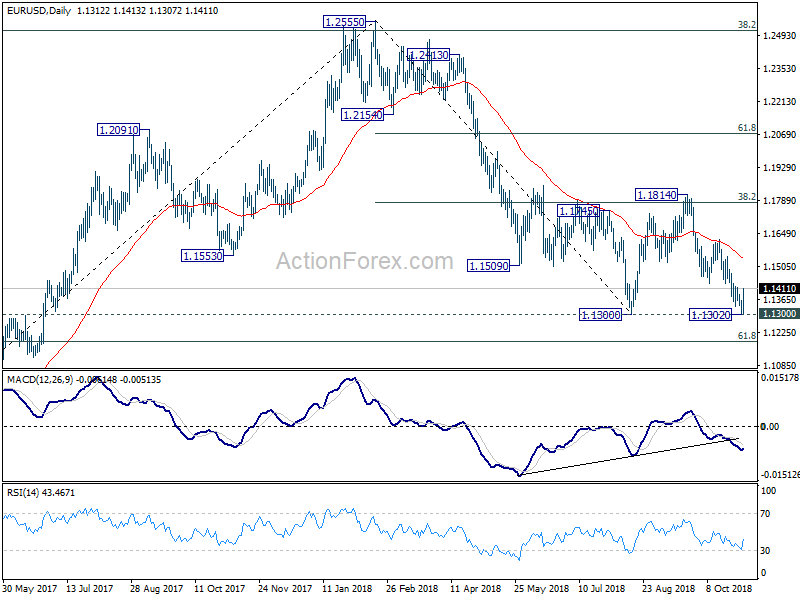
EUR/USD's rebound from 1.1302 continues today and focus is now on 1.1421 minor resistance. Decisive break there will indicate short term reversal, on bullish convergence condition in 4 hour MACD, after supported by 1.1300. In that case, consolidation pattern from 1.1300 could have started the third leg and further rise should be seen to 1.1621 resistance and above. But we'd expect strong resistance from 1.1814 to limit upside to bring down trend resumption eventually. On the downside, break of 1.300 will resume whole down trend from 1.2555 and target 1.1186 fibonacci level next.
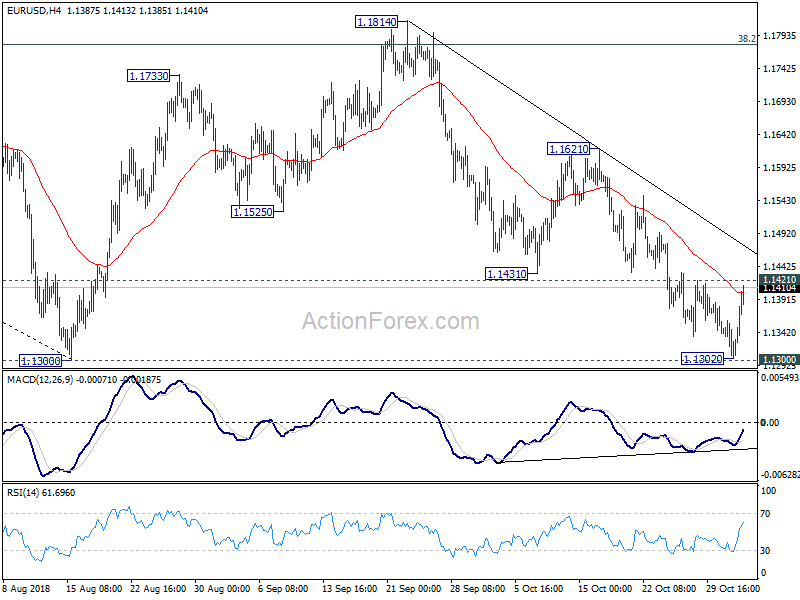
In the bigger picture, corrective pattern from 1.1300 could have completed at 1.1814 after hitting 38.2% retracement of 1.2555 to 1.1300 at 1.1779. Decisive break of 1.1300 will resume the down trend from 1.2555 to 61.8% retracement of 1.0339 (2017 low) to 1.2555 at 1.1186 next. Sustained break there will pave the way to retest 1.0339. On the upside, break of 1.1814 will delay the bearish case and extend the correction from 1.1300 with another rise before completion.
USD/JPY Mid-Day Outlook
Daily Pivots: (S1) 112.73; (P) 113.05; (R1) 113.31; More..
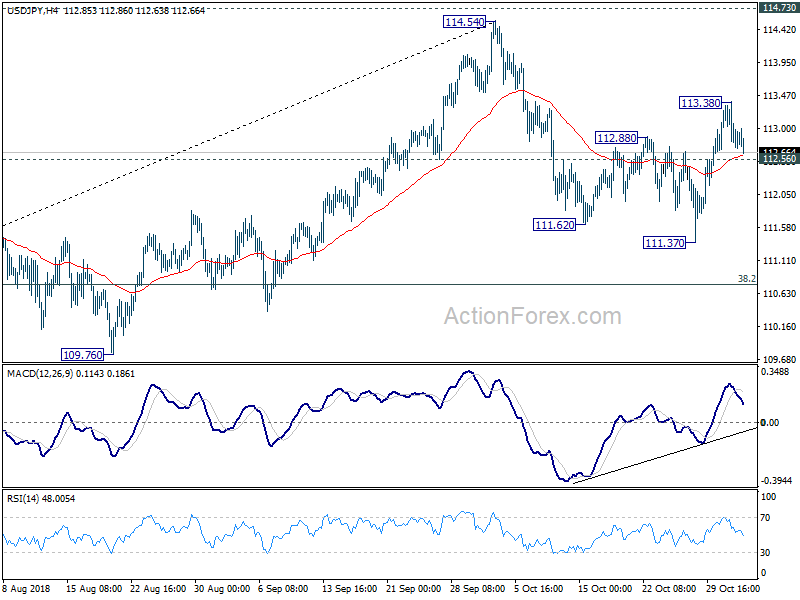
Intraday bias in USD/JPY remains neutral first. As long as 112.56 minor support holds, another rise is mildly in favor. On the upside, above 113.38 will extend the rebound from 111.37 to 114.54/73 key resistance zone. On the downside, break of 112.56 will likely extend the correction from 114.54 to 38.2% retracement of 104.62 to 114.54 at 110.75 before completion.
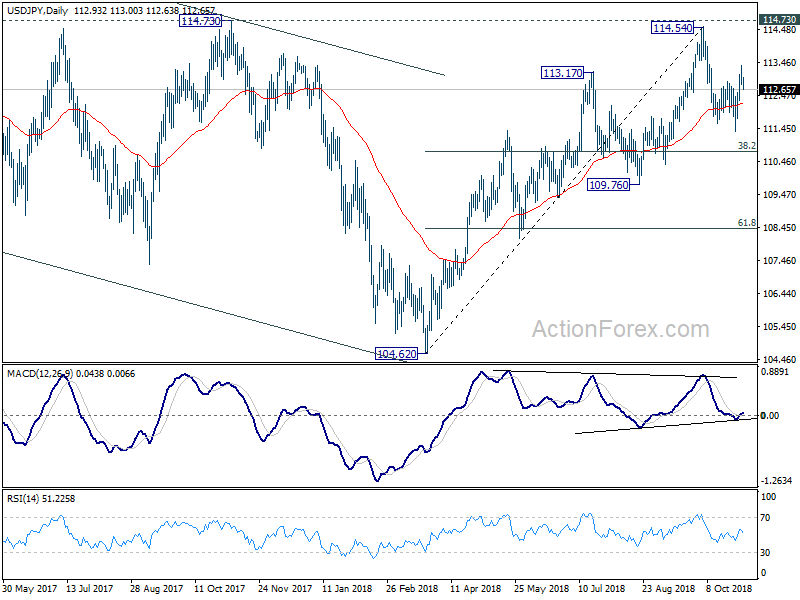
In the bigger picture, corrective fall from 118.65 (2016 high) should have completed with three waves down to 104.62. Decisive break of 114.73 resistance will likely resume whole rally from 98.97 (2016 low) to 100% projection of 98.97 to 118.65 from 104.62 at 124.30, which is reasonably close to 125.85 (2015 high). This will stay as the preferred case as long as 109.76 support holds. However, decisive break of 109.76 will dampen this bullish view and turns outlook mixed again.
USD/CHF Mid-Day Outlook
Daily Pivots: (S1) 1.0045; (P) 1.0072; (R1) 1.0112; More...
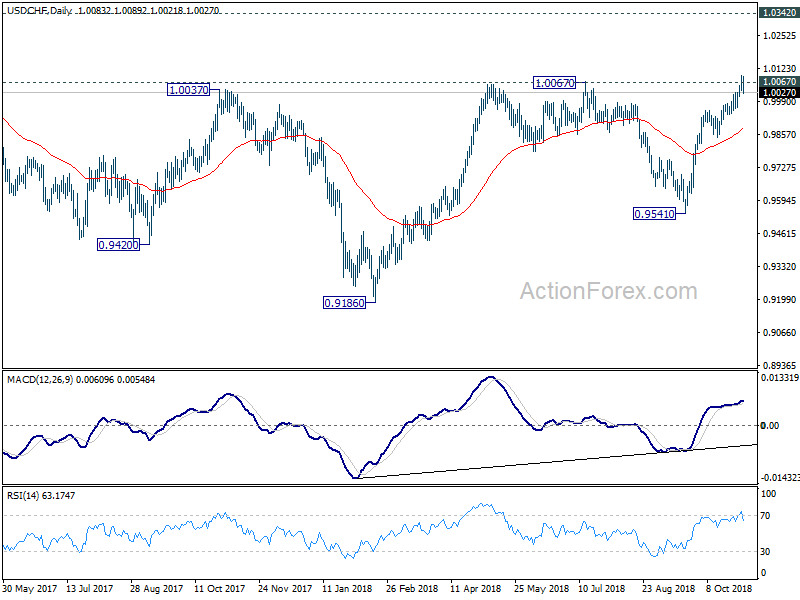
Intraday bias in USD/CHF is turned neutral as the pair fails to sustain above 1.0067 key resistance and retreats sharply. Considering bearish divergence condition in 4 hour MACD, break of 1.0007 minor support will suggests near term reversal. Intraday bias will be turned back to the downside for 0.9848/9954 support zone. On the upside, though, break of 1.0094 and sustained trading above 1.0067 will confirm resumption of larger rise from 0.9186 and should target 1.0342 key resistance next.
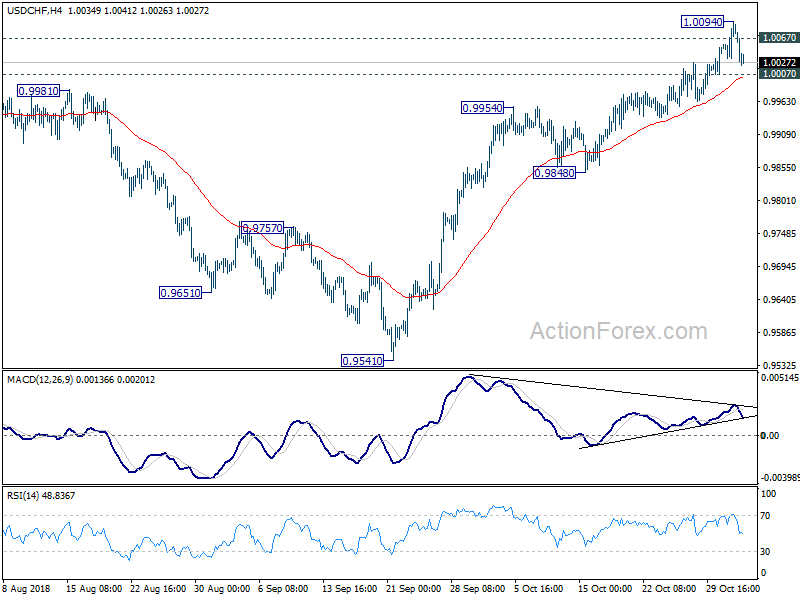
In the bigger picture, the pullback from 1.0067 has completed at 0.9541 already. And rise from 0.9186 is likely resuming. Firm break of 1.0067 will pave the way to retest 1.0342 key resistance. We'd be cautious on strong resistance from there to limit upside to bring another medium term fall to extend long term range trading.
EURGBP Momentum Heads South; Medium-Term Picture also Looks Bearish
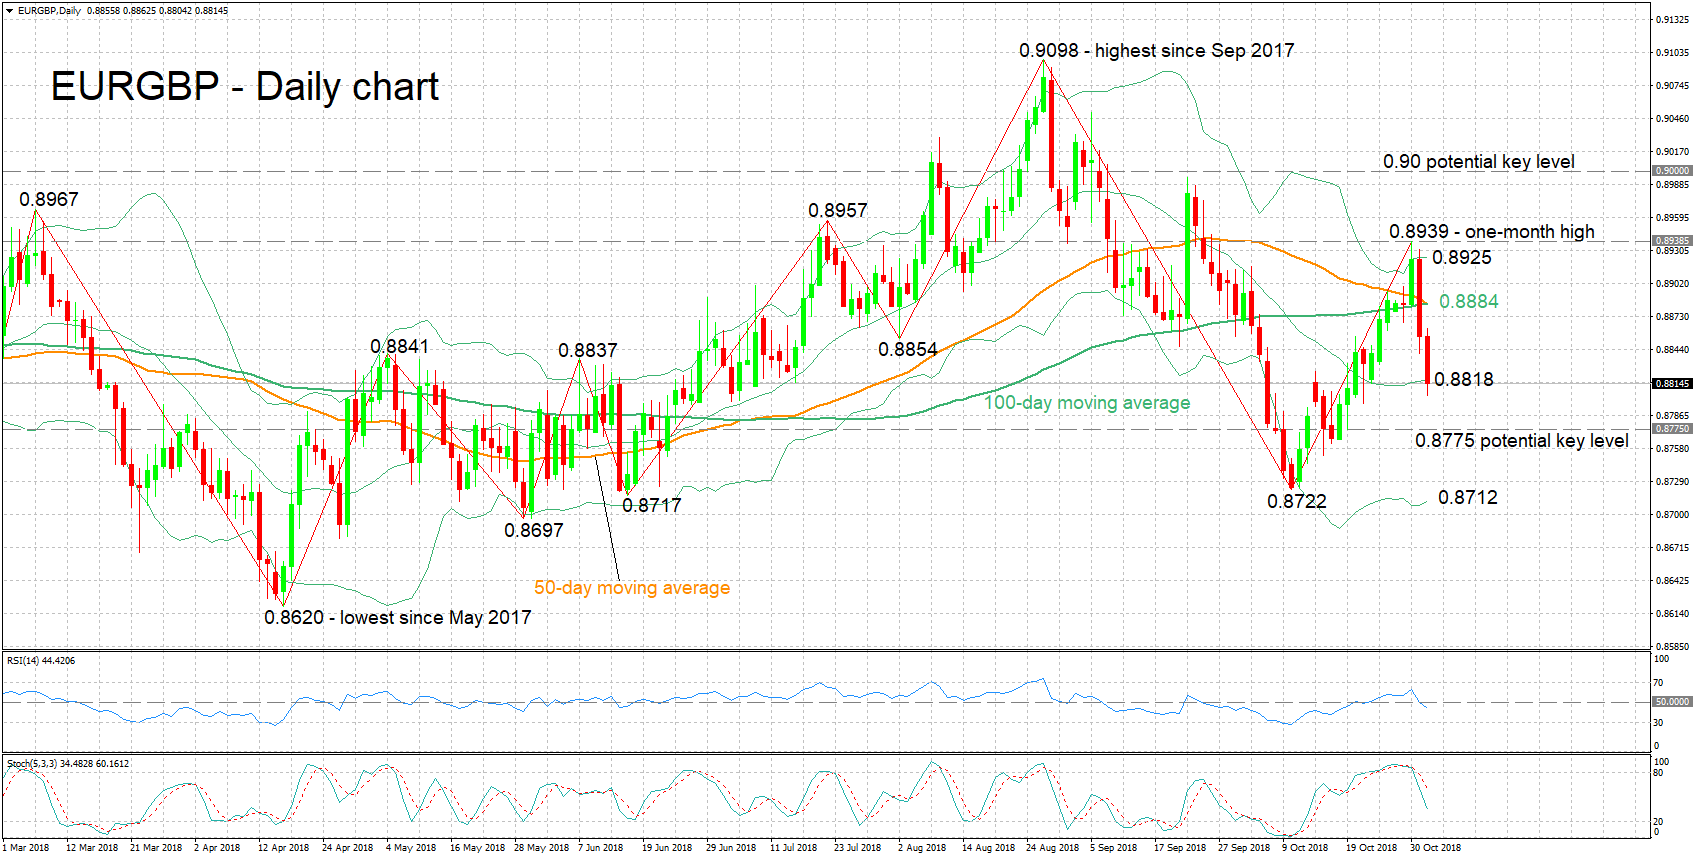
EURGBP has moved considerably lower after touching a one-month high of 0.8939 on Tuesday. The pair is currently trading not far above a nine-day low of 0.8804 touched earlier on Thursday.
The RSI turned lower over the past couple of days, entering bearish territory below 50; this is a sign of short-term momentum shifting to the downside. Also, the stochastics are projecting a bearish picture in the very short-term, as the %K line has moved below the slow %D one and both lines are heading lower.
Price action is marginally below the middle Bollinger line – a 20-day moving average line – though it may still be meeting immediate support around this level. A decisive violation would turn the attention to the zone around 0.8775 which was one of congestion from late April to late June. Steeper losses would shift the focus to the lower Bollinger band at 0.8712; the area around this point encapsulates a few bottoms from previous months. Lower still, the 0.8620 nadir would be eyed.
On the upside, resistance could occur around the 50- and 100-day MA lines which have converged at 0.8884; a couple of tops and a bottom from the recent past lie close to this mark. Further up, the region around Tuesday’s peak of 0.8939 may act as a barrier – the upper Bollinger band at 0.8925 is close to this high – with the 0.90 handle coming within scope in the event of stronger advances.
Trading activity taking place below the 50- and 100-day MAs, which look increasingly likely to post a bearish cross, is pointing to a mostly negative picture in the medium-term.
Overall, both the short- and medium-term outlooks are looking predominantly bearish at the moment.
ISM manufacturing dropped to 57.7, employment dropped to 56.8
US ISM manufacturing index dropped to 57.7 in October, down from 59.8 and missed expectation of 59.0. That's the lowest level since April this year. Price paid component rose to 71.6, up from 66.9 and beat expectation of 67.5 Employment component dropped to 56.8, down from 58.8.
From Timothy R. Fiore Chair ISM Manufacturing Business Survey Committee:
- Comments from the panel reflect continued expanding business strength.
- Demand remains moderately strong, with the New Orders Index easing to below 60 percent for the first time since April 2017, the Customers' Inventories Index remaining low but improving, and the Backlog of Orders Index remaining steady.
- Consumption softened, with production and employment continuing to expand, but at lower levels compared to September. I
- Inputs — expressed as supplier deliveries (increased), inventories and imports — retained September's levels. Continued supply chain delivery difficulties led to an increased consumption of inventory, and import expansion was stable. Lead-time extensions continue, while steel and aluminum prices are stabilizing. Supplier labor issues and transportation difficulties continue to disrupt production, but at more manageable levels.
- The expansion of new export orders softened, but five of six major industries contributed, up from two in September. Prices pressure continues, with the index returning above 70 percent. Overall, the manufacturing community continues to expand, but at the lowest level since April 2018.
Quotes from respondents:
- "Tariffs are causing inflation: increased costs of imports, increased cost of freight and increased domestic costs from suppliers who import." (Chemical Products)
- "Protein prices continue under pressure from heavy U.S. supplies and export concerns related to trade tariffs. Higher costs related to trade tariffs are starting to be passed on to the cost of goods sold." (Food, Beverage & Tobacco Products)
- "NAFTA 2.0/USMCA does nothing to help our company, as it does not address Section 232 tariffs." (Plastics & Rubber Products)
- "Mounting pressure due to pending tariffs. Bracing for delays in material from China — a rush of orders trying to race tariff implementation is flooding shipping and customs." (Miscellaneous Manufacturing)
- "Steel tariffs continue to negatively affect our cost, even though we utilize U.S. sources for steel. Oil prices put meaningful upward pressure on cost. Continued tightness with truck drivers is expected." (Petroleum & Coal Products)
Hawkish Carney Signals Overheating Economy Could Accelerate BOE Rate Hikes
As widely anticipated, BOE voted unanimously to keep all monetary policies unchanged in November. The Bank rate stays unchanged at 0.75%. Meanwhile, purchases of gilts and corporate bonds remain at 435B pound and 10B pound, respectively. The central bank sent a more hawkish-than-expected message to the market. While reiterating "gradual and limited" monetary stance, BOE noted more rate hikes might be needed as there could be overheating in the economy in 2H19. Meanwhile, its desire to hike interest rates could materialise amidst smooth Brexit. Sterling extends today’s rally. It has been boosted by the Brexit Secretary Dominic Raab’s suggestion that UK might reach a Withdrawal Agreement with the EU by November 21. This is yet to be confirmed by EU representatives.
Under the assumptions that there would be three more rate hikes by late 2021, as well as a smooth Brexit transition, the members forecast GDP growth would reach +1.3% this year, down from +1.4% projected in August. GDP growth would then improve to +1.7% y/y in 2019, down from August’s estimate in +1.8%. The central bank added that the outlook would “depend significantly on the nature of EU withdrawal, in particular the form of new trading arrangements, the smoothness of the transition to them and the responses of households, businesses and financial markets".
Despite the assumption of a smooth Brexit, BOE noted in the quarterly inflation report that the impact of Brexit “cannot be determined in advance, under all circumstances, the MPC will respond to any material change in the outlook”. As noted in the report, “the monetary policy response to Brexit, whatever form takes, will not be automatic and could be in either direction”. Concerning post-Brexit monetary policy, Carney indicated interest rates can go in both directions. He noted that no-deal Brexit would also trigger rate hike, as weak sterling and tariff could send import prices much higher.
UK’s economic developments and monetary policy outlook have almost been directed by Brexit negotiations. The progress of Brexit negotiations has been slow. It remains uncertain whether a special summit, let alone a deal, would be held this month. Even if the challenges from EU are overcome and a deal it struck by December, the UK parliament would be voting on it in January 2019, before the Brexit day on March 29, 2019. While our base case remains a last-minute deal, we expect the limited time frame would lead BOE to stand on the sideline at least until 2Q19.
GBP/USD Mid-Day Outlook
Daily Pivots: (S1) 1.2698; (P) 1.2765; (R1) 1.2833; More...
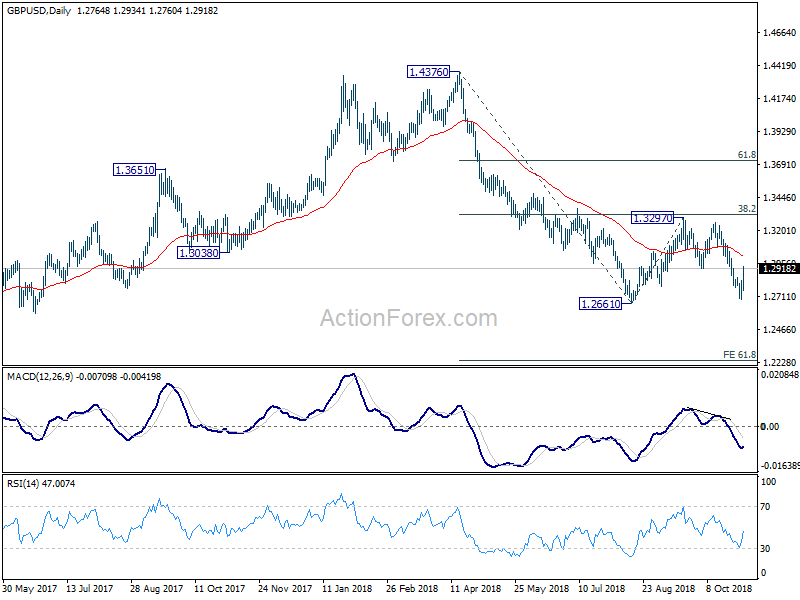
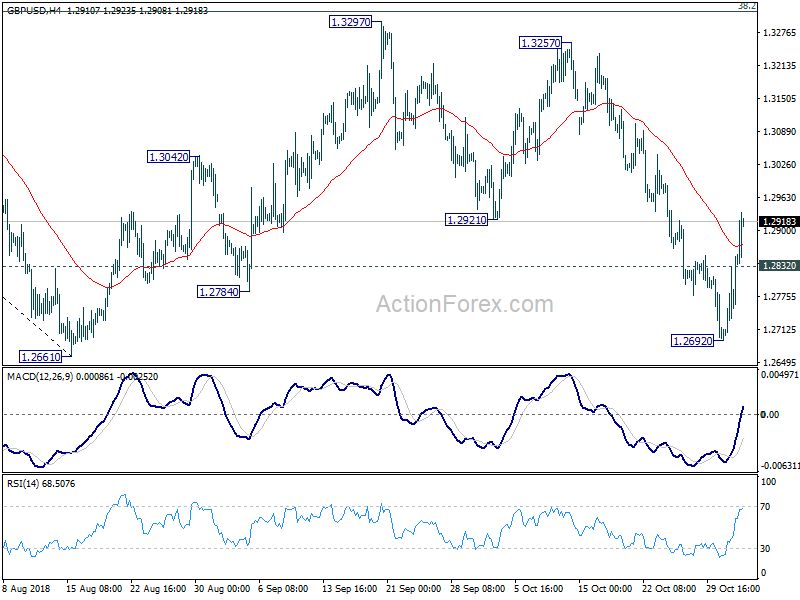
GBP/USD's rebound from 1.2692 extends higher today. Breach of 1.2921 support turned resistance suggests that fall from 1.3297 has completed. And, consolidation pattern from 1.2661 is extending with another rising leg. Intraday bias is now on the upside for 1.3297 resistance We'd expect strong resistance from 1.3316 fibonacci level to limit upside to bring down trend resumption eventually. On the downside, below 1.2832 minor support will turn bias back to the downside for 1.2692 instead.
In the bigger picture, whole medium term rebound from 1.1946 (2016 low) should have completed at 1.4376 already, after rejection from 55 month EMA. The structure and momentum of the fall from 1.4376 argues that it's resuming long term down trend. And this will be the preferred case as long as 38.2% retracement of 1.4376 to 1.2661 at 1.3316 holds. However, firm break of 1.3316 would bring stronger rebound to 61.8% retracement at 1.3721. And, the eventual depth of the fall from 1.4376, and the chance of hitting 1.1946 low, will depend on the strength of the interim corrective rebound from 1.2661.