Sample Category Title
Gold Pares Gains as Risk Appetite Improves
US futures get week off to a positive start
Risk appetite is gradually improving throughout the morning in Europe and the US is following in its lead with futures comfortably higher ahead of the open on Wall Street.
I’m still far from confident that we’re through the other side of this particular storm and the coming week could be just as turbulent as the ones that preceded it, but a positive start will come as a relief to investors. If we can get through the first few days – or even a full week – without a major down day, then investors may slowly start to come around to the idea that the worst has passed, with the S&P 500 and NASDAQ having already entered into correction territory and the Dow not far behind.
With a week to go until the midterms, more than a quarter of S&P 500 companies reporting and a number of notable data points to come - including the jobs report on Friday and inflation, income and spending today – I don’t see this week lacking more volatility. Today’s inflation numbers will be of particular interest ahead of next week’s Fed meeting, coming against the backdrop of an unstable market and policy makers that seem determined to persevere with rate hikes.
Gold pares gains as risk appetite improves
The return of risk appetite has taken the edge off Gold which has pulled a little away from its recent highs. Bullish momentum did appear to be gradually slipping away in recent days so perhaps we’re now seeing a little bit of a corrective move in the yellow metal, although that will only last as long as US markets hold up. As we’ve seen in recent months, appetite for Gold spiked when the US market gave way and I see no reason to think it will be any different in the coming weeks.
Oil on the other hand is not benefiting from improved sentiment in the market, with Brent and WTI both posting losses of around 0.5% on the day. I wonder whether the declines here are linked to the underperformance we saw in Chinese stocks overnight on the back of data that showed profits at industrial firms slowed for a fifth month. The impact of tariffs is gradually showing up in the data and this may be lowering people’s growth outlook for the country and weighing on demand expectations.
Merkel paves the way for successor
Europe is never too far away from the spotlight and this morning it’s Germany rather than Italy that’s hitting the headlines. A poor showing by the CDU and SPD in regional elections in Hesse has proven to be the straw that breaks the camel’s back for Merkel, who is reported to have told lawmakers that she doesn’t intend to run for party Chairwoman again in December, laying the groundwork for her to be replaced as Chancellor, maybe in the not-too distant future.
Merkel has been a stabilising force for the eurozone throughout the last decade but her popularity and that of her party or any party that associates with it has been plummeting, giving rise to the far right AfD. The rather muted reaction in the markets possibly reflects the position Merkel finds herself in. In years gone by, this would have been seen as a major political casualty but in the current environment of rising populism, Merkel’s handling of the refugee crisis – no matter how admirable – is now harming her party. A new face may help to stem the bleeding.
DAX Outlook: Recovery Accelerates On Weaker Euro/German Political News
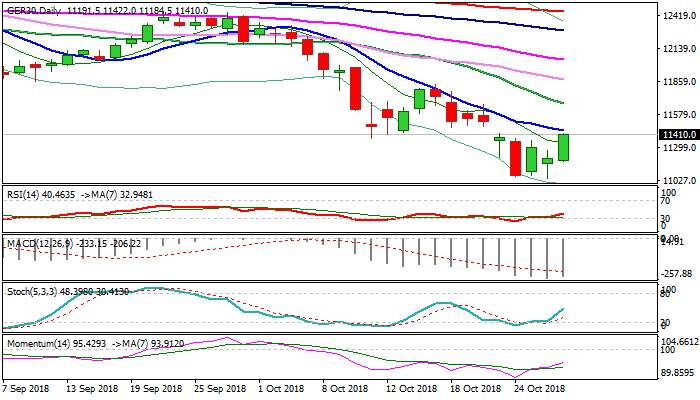
The index rose nearly 2% in European trading on Monday, supported by weaker Euro and political news from Germany, as German Chancellor Angela Merkel said she will not seek re-election as a head of her CDU party in December.
Reversal signal is developing on daily chart after triple downside rejection last week and today's bounce, signaled basing.
Recovery generated initial bullish signal on break above 11343 (Fibo 38.2% of 11836/11039), with fresh advance pressuring pivots at 11449 (falling 10SMA) and 11485 (weekly 200SMA) and also to looking to cover last week's gap (Mon/Tue 11524/11359).
Sustained break here would generate further signal for extension of recovery leg towards barriers at 11531 (Fibo 61.8% of 11836/11039) and 11678 (falling 20SMA).
Near-term recovery is supported by strengthening momentum and reversal of daily slow stochastic/RSI, with rally above thick hourly cloud (11217/11363) adding to bullish near-term signals.
Res: 11449, 11485, 11531, 11678
Sup: 11363, 11217, 11184, 11039
The Analytical Overview Of The Main Currency Pairs
The EUR/USD currency pair
Technical indicators of the currency pair:
Prev Open: 1.13722
Open: 1.13992
% chg. over the last day: -0.14
Day's range: 1.13834 – 1.14114
52 wk range: 1.1299 – 1.2557
On Friday, the EUR/USD currency pair was showing a variety of trends. This week the investors are waiting for the Eurozone Inflation Report, which will be published on Wednesday. At the moment, the EUR\USD currency pair is consolidating in the 1.13700-1.14100 range. Positions should be opened from these marks. A technical correction is possible soon.
The Economic News Feed for 29.10.2018:
Consumer Spending Trends (USA) – 14:30 (GMT+2:00).
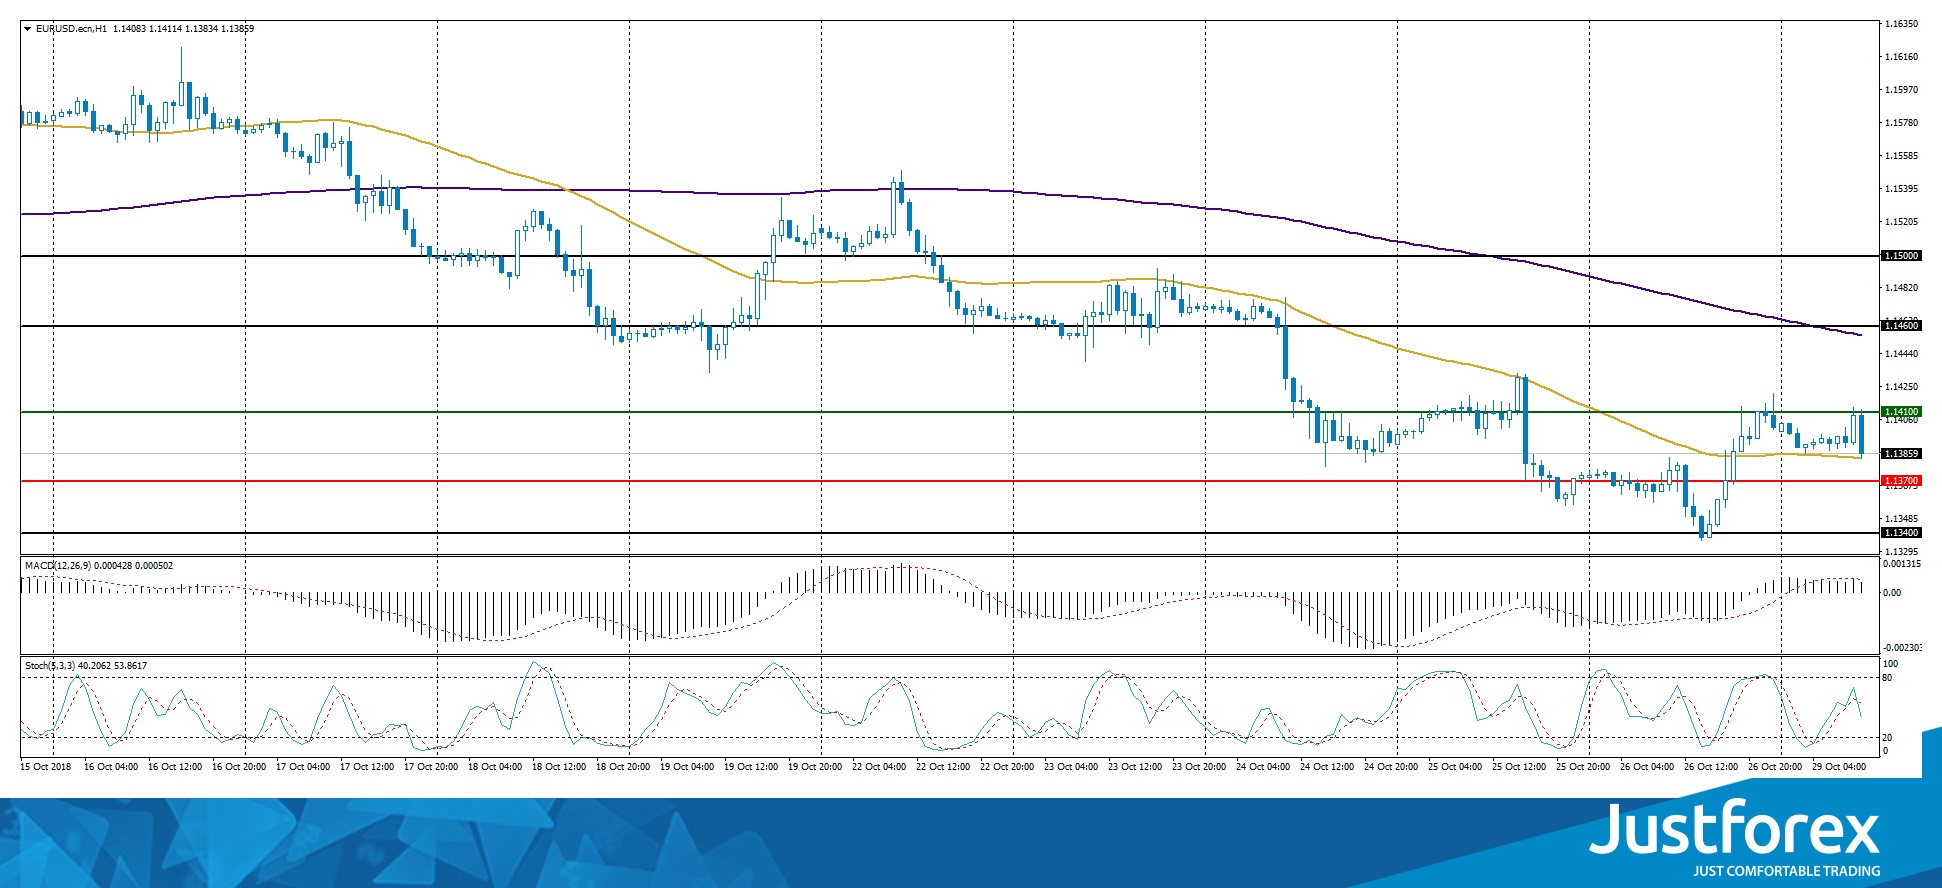
The price fixed between 50 MA and 200 MA, which act as dynamic support and resistance levels.
The MACD histogram is in the positive zone but below the signal line, which gives a weak signal towards the EUR\USD purchase.
The Stochastic Oscillator is in the neutral zone, the %K line crosses the %D line. There are no precise signals.
Trading recommendations
Support levels: 1.13700, 1.13400, 1.13000
Resistance levels: 1.14100, 1.14600, 1.15000
If the price fixes below the local support level of 1.13700, we can expect further descent of the EUR/USD quotes. The movement will tend towards 1.13400-1.13200.
Alternatively, the price fixes above the resistance level of 1.14100. In this case, you should look for the market entry points to open long positions. The movement will tend toward 1.14600-1.14800.
The GBP/USD currency pair
Technical indicators of the currency pair:
Prev Open: 1.28154
Open: 1.28274
% chg. over the last day: +0.12
Day's range: 1.28059 – 1.28159
52 wk range: 1.2662 – 1.4378
The GBP/USD currency pair is in the sideward trend. The investors are waiting for the additional drivers. At the moment, the key support and resistance levels are 1.27900 and 1.28400 respectively. We recommend you open the positions from the key levels. A technical correction is possible soon.
The Economic News Feed for 29.10.2018:
Chancellor's Autumn Forecast Statement (UK) – 14:30 (GMT+2:00);
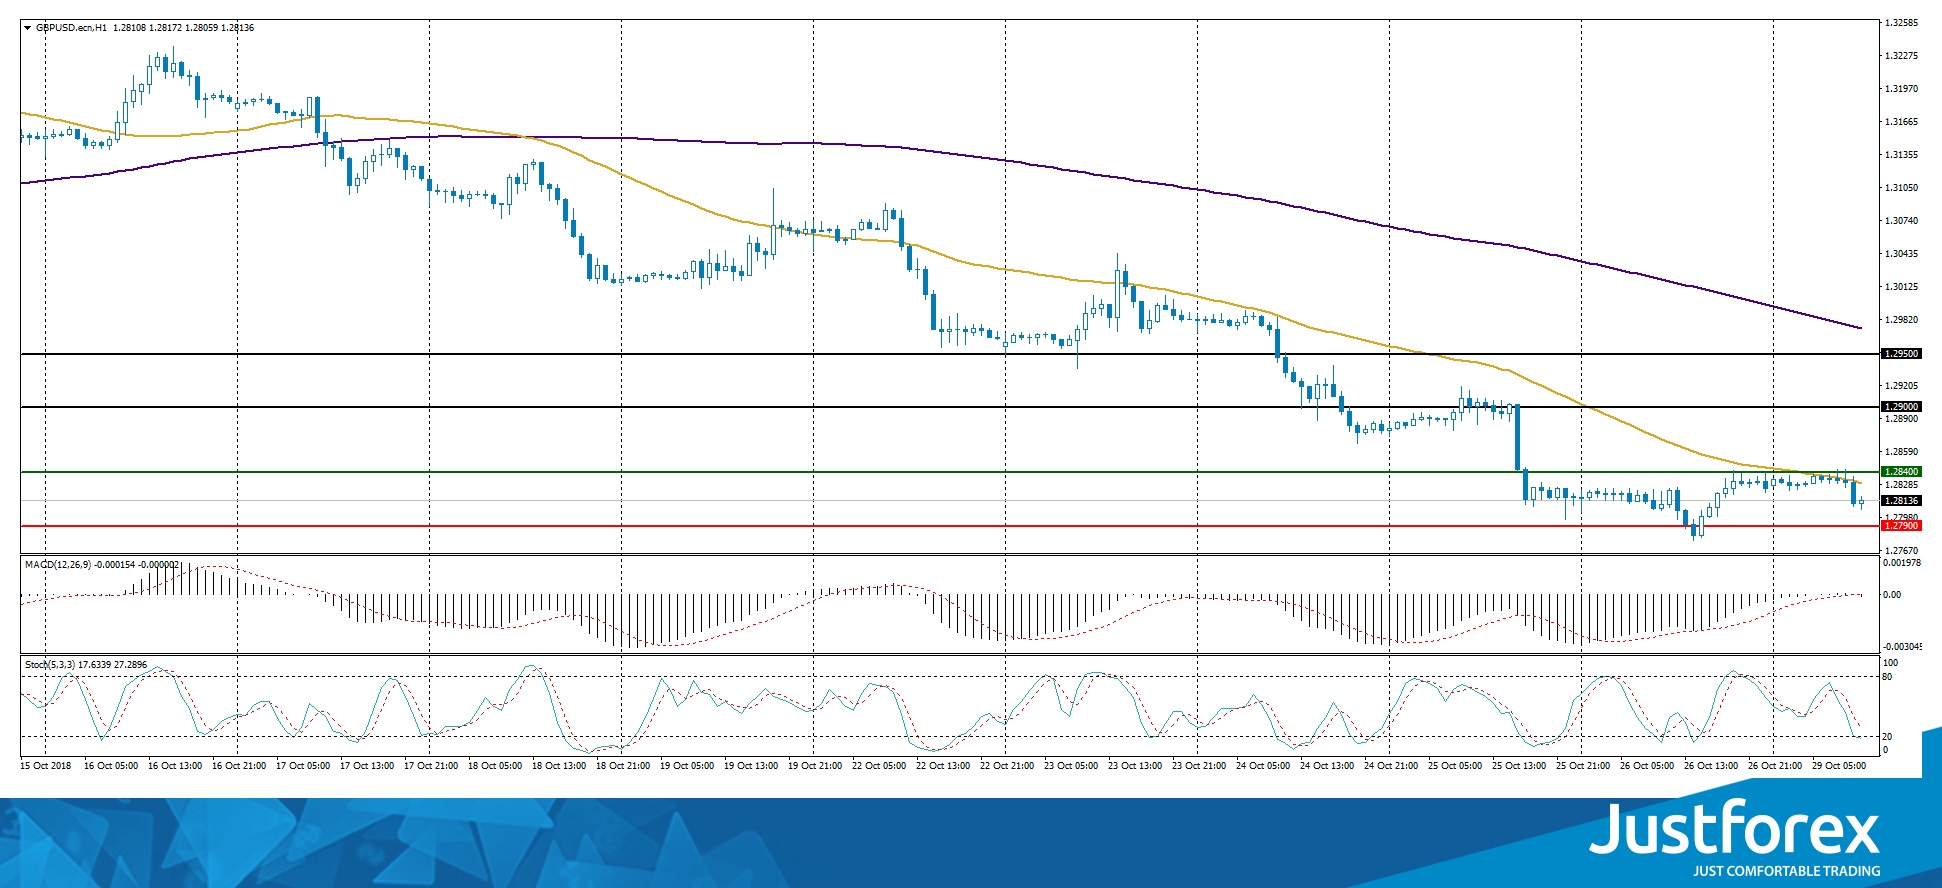
The indicators do not provide precise signals: the price is testing 50 MA, which currently acts as a dynamic resistance line.
The MACD histogram is near 0.
The Stochastic Oscillator is in the neutral zone, the %K line is below the %D line, which indicates bearish sentiments.
Trading recommendations
Support levels: 1.27900, 1.27600, 1.27000
Resistance levels: 1.28400, 1.29000, 1.29500
If the price fixes below the support line of 1.27900, we can expect a further descend of the GBP/USD currency pair. The movement will tend toward 1.27600-1.27400.
Alternatively, if the price fixes above 1.28400, you should look at buying GBP/USD. The movement will tend toward 1.29000.
The USD/CAD currency pair
Technical indicators of the currency pair:
Prev Open: 1.30677
Open: 1.30958
% chg. over the last day: -0.07
Day's range: 1.30992 – 1.31146
52 wk range: 1.2248 – 1.3387
Last week the Bank of Canada raised the key interest rate by 25 basis points to 1.75%. The demand for the CAD has grown significantly. The local support and resistance levels are 1.30800 и 1.31200, respectively. Positions should be opened from these levels.
The Economic News Feed for 29.10.2018 is calm.
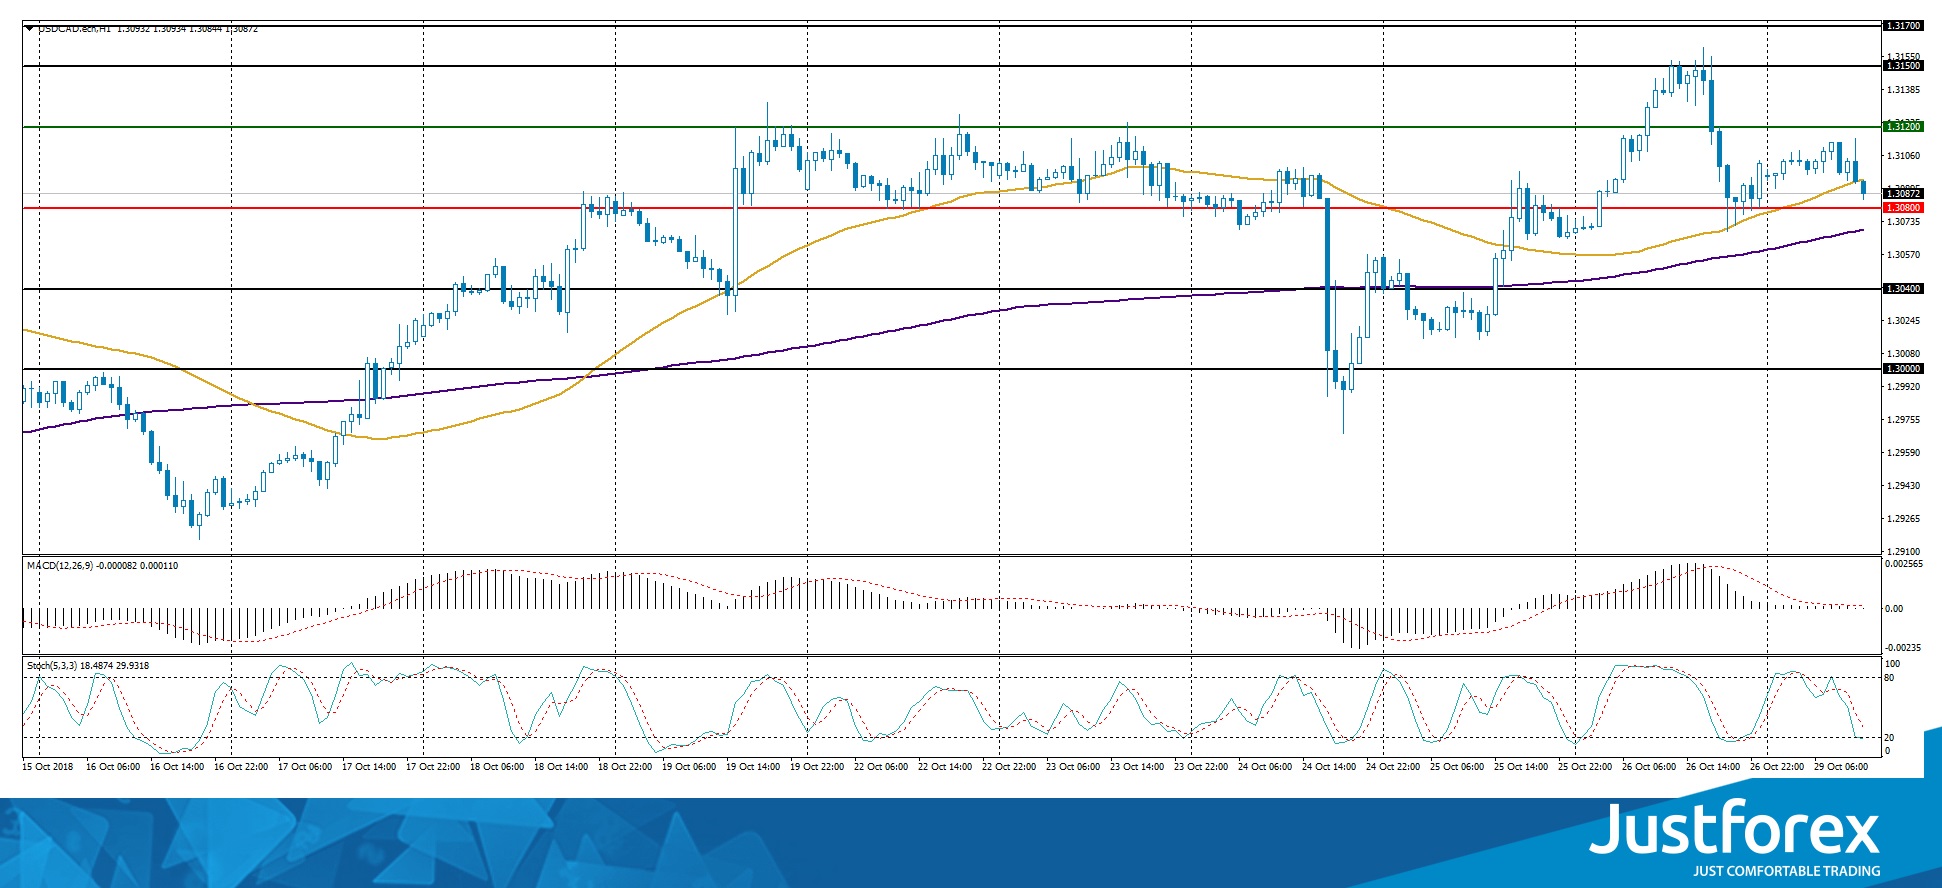
There are no precise signals, the price is testing 50 МА.
The MACD histogram is around 0.
The Stochastic Oscillator is in the neutral zone, the %K line is below the %D line, which indicates bearish sentiments.
Trading recommendations
Support levels: 1.30800, 1.30400, 1.30000
Resistance levels: 1.31200, 1.31500, 1.31700
If the price fixes above 1.31200, we can expect further growth of the USD/CAD quotes. The movement will tend towards 1.31500-1.31700.
Alternatively, the currency pair can drop toward 1.30400-1.30000.
The USD/JPY currency pair
Technical indicators of the currency pair:
Prev Open: 112.397
Open: 111.862
% chg. over the last day: +0.07
Day's range: 111.930 – 112.800
52 wk range: 104.56 – 114.74
The USD/JPY currency pair is showing a variety of trends. At the moment, the key support and resistance levels are 111.850 and 112.250. Positions should be opened from these levels. We recommend you keep an eye on the US government bonds yield.
The Economic News Feed for 29.10.2018 is calm.
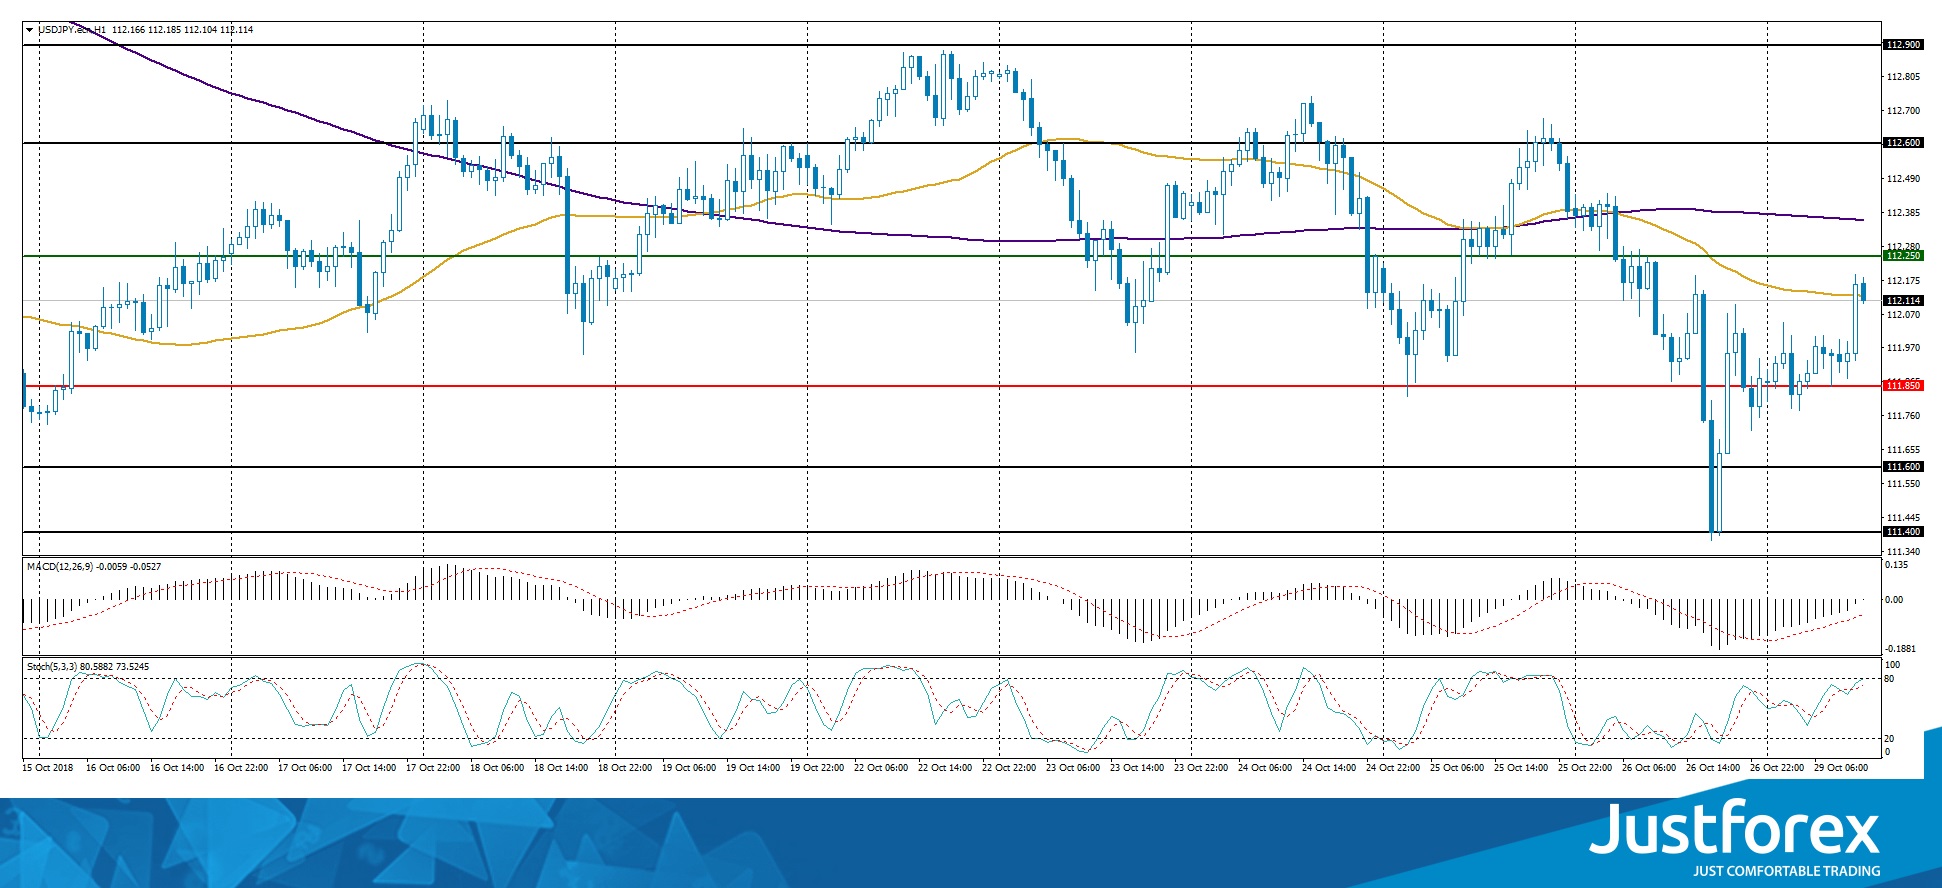
The indicators do not provide precise signals, the price has crossed 50 MA.
The MACD histogram is around 0.
The Stochastic Oscillator is in the neutral zone, the %K line has crossed the %D line. There are no signals at the moment.
Trading recommendations
Support levels: 111.850, 111.600, 111.400
Resistance levels: 112.250, 112.600, 112.900
If the price fixes below the support level 111.850, we can expect further descent of the USD/JPY quotes. The movement will tend toward 111.600-111.400.
Alternatively, the currency pair can grow to 112.600-112.900.
XAU/USD Analysis: Will Surge
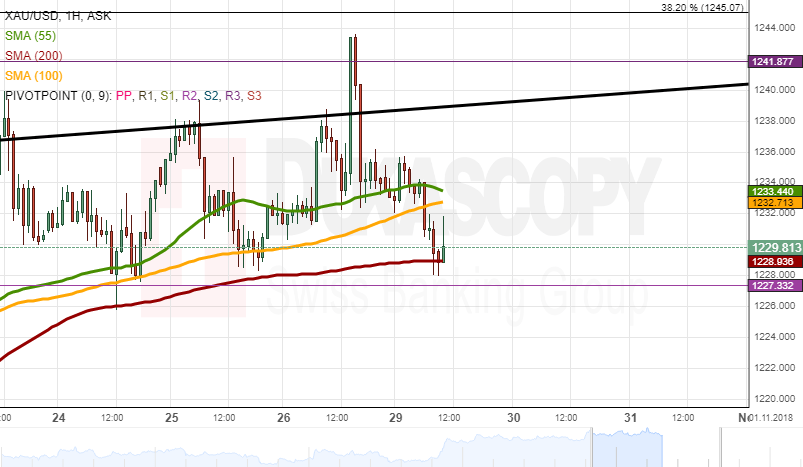
During Friday's trading session, the yellow metal broke the resistance of the monthly R3 at 1,241.87 to end the trading day at 1,231.99 mark. On Monday morning, the gold was trading between the 100-hour and the 200-hour simple moving averages at the 1,228.92 mark.
In regards to the near-term future, most likely, the gold will trade upwards to break the 100-hour and 55-hour SMAs resistances. The 200-hour simple moving average will support the surge during the day.
However, the yellow metal could pass through the support of the 200-hour SMA to pass through the monthly R2 at 1,227.33 on Monday.
USD/JPY Analysis: Trades Near Weekly PP
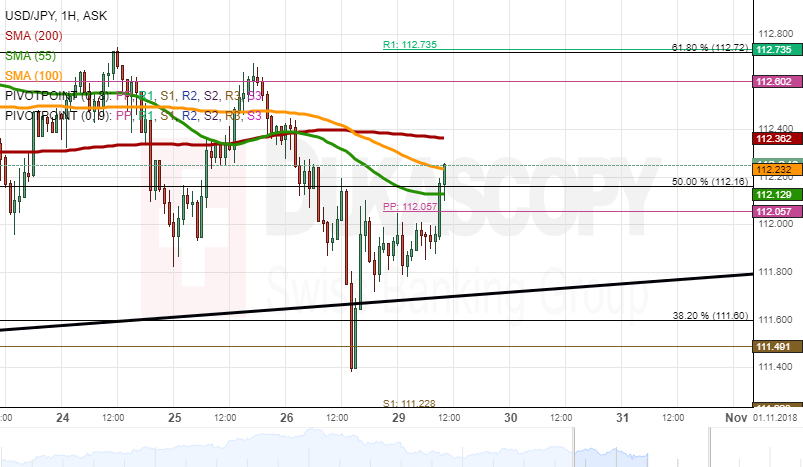
During Friday's trading session, the currency pair passed through the bottom boundary of the dominant ascending pattern to end the trading day at 111.90. On Monday morning, the US Dollar returned to the dominant pattern to trade near the weekly PP at the 112.12 mark.
In regards to the near-term future, most likely, the US Dollar will trade below the weekly PP at 112.05 due to the resistance of the 50.00% Fibo and the resistance of the 55-hour simple moving averages.
Besides, the resistance of the 55-hour simple moving average could push the rate to pass through the pattern line to push the rate to trade near the 38.20% Fibo.
GBP/USD Analysis: Trades At 1.2800 Level
During Friday's trading session, the British Pound surged towards the 62.20 % Fibo to end the trading day at 1.2824 mark. On Monday morning, the rate was resisted by the 55-hour SMA to trade at the 1.2814 mark.
In regards to the near-term future, most likely, the British pound will pass through the support of the monthly S1 at 1.2778 due to the resistance of the 55-hour simple moving average.
On the other hand, the support of the monthly S1 at 1.2778 could support the rate to stimulate the currency exchange pair to break the resistance of the 55-hour SMA to surge towards the 62.20% Fibo on Monday.
GBP/CAD 4H Chart: Decline Is Likely To Continue
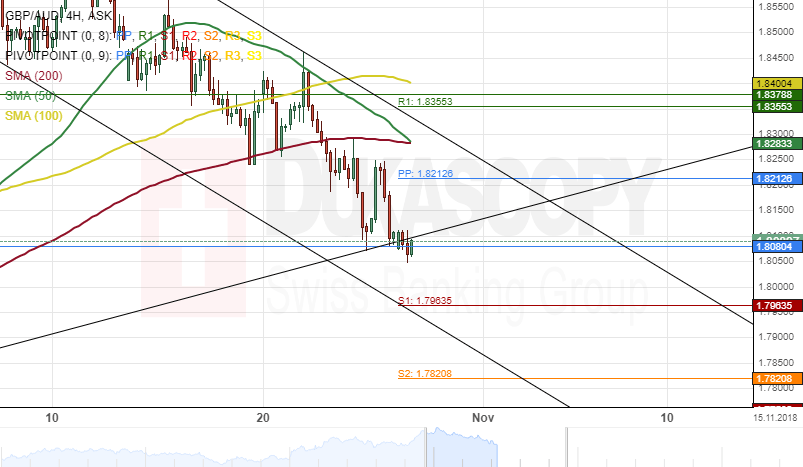
A junior descending channel pattern has guided the movement of the GBP/CAD exchange rate lower.
Everything being equal, it is likely that the Pound Sterling continues its decline against the Canadian Dollar this week. The first target for bearish traders will be at October 3 swing low of 1.66. Thereafter, a brief retracement towards the upper boundary of the junior descending channel at 1.6647 could follow.
Meanwhile, technical indicators on the daily time-frame suggest that the currency exchange rate is in the oversold zone.
GBP/AUD 4H Chart: Pressure By SMAs
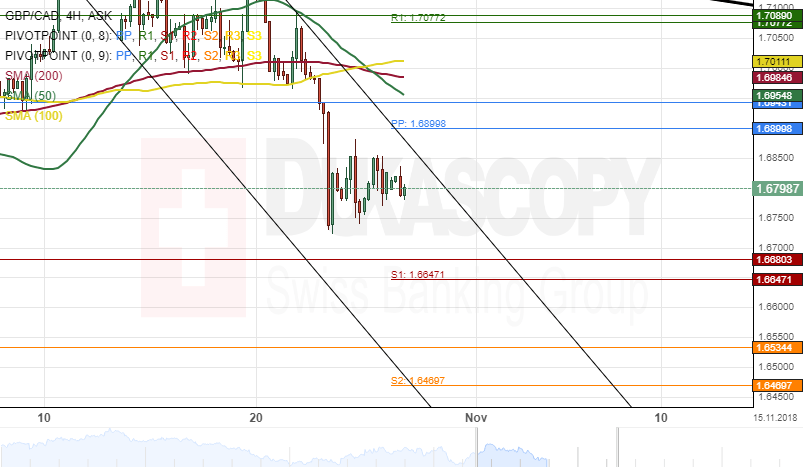
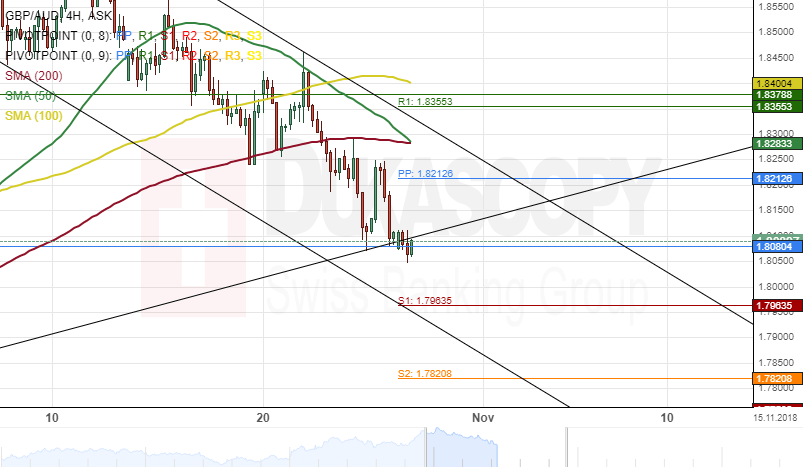
The British Pound has declined significantly against the Australian Dollar after the currency pair pulled back from a resistance level formed by the monthly pivot point at 1.8700.
The exchange rate breached the lower boundary of a two-month ascending channel pattern and the monthly PP at 1.8080 during the early hours of Monday's trading session.
If this support level holds, the currency exchange rate could aim at a resistance cluster formed by the 50– and 200-hour SMAs at 1.8281 during the next 48 hours.
On the other hand, if the rate passes the support level as mentioned earlier, bearish traders could target the weekly S1 at 1.7963 within this session.
EUR/USD Analysis: Resisted By 55-Hour SMA
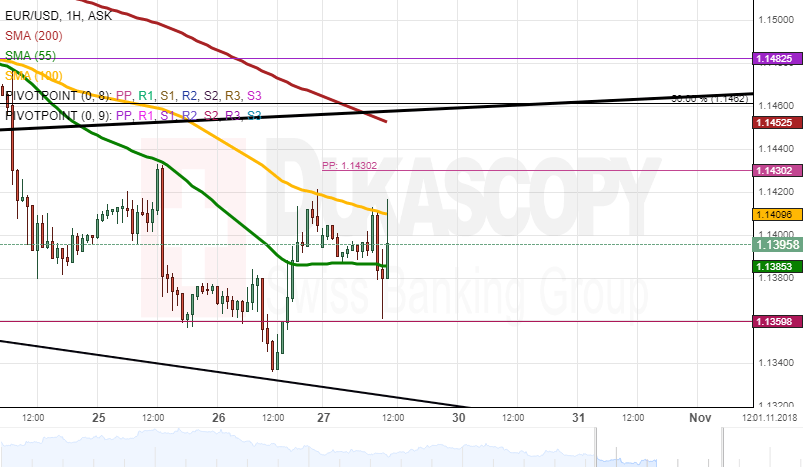
During Friday's session, the currency pair passed through the monthly S2 at 1.1359, but afterwards, the rate recovered itself to end the trading day at 1.1389. On Monday morning, the European Single Currency was resisted by the 55-hour SMA to trade at the 1.1379 mark.
In regards to the near-term future, most likely, the currency pair will trade sideways above the monthly S2 at 1.1359 due to a lack of any significant fundamental news for the currency exchange pair during the trading day.
However, the resistance of the 55-hour SMA could push the rate to pass through the support of the monthly S2 to trade at 1.1300 on Monday.
Bears Taking Over GBPUSD
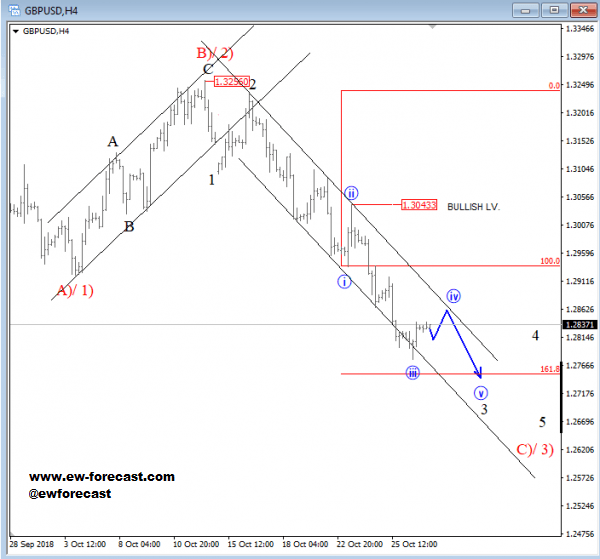
Cable is currently turning down into a third leg of decline which can either be wave C) or 3), but in both cases there is room for more weakness it seems as five wave structure is unfolding down from 1.3250. That said, be aware of more weakness after any short-term bounce which can stop at the upper trendline resistance.
GBPUSD, 4h