
Sample Category Title
ECB officials highlight intensifying risks, signal openness to more rate cuts
ECB Vice President Luis de Guindos told the European Parliament today that while the Eurozone economy likely managed modest growth in Q1, risks to the outlook have intensified.
He pointed to exceptional uncertainty stemming from new trade barriers, financial market tensions, and geopolitical instability, all of which could weigh on business investment and consumer spending in the months ahead.
"In this environment, consumers may become cautious about the future and hold back spending," de Guindos added.
Separately, Finnish ECB Governing Council member Olli Rehn also flagged the growing headwinds, suggesting the central bank may need to cut interest rates below neutral levels and maintain maximum flexibility.
Rehn emphasized that underlying inflation pressures are easing and that the escalation of US trade tariffs is largely contributing to increased downside risks for Eurozone inflation.
EUR/USD Mid-Day Outlook
Daily Pivots: (S1) 1.1322; (P) 1.1358; (R1) 1.1401; More...
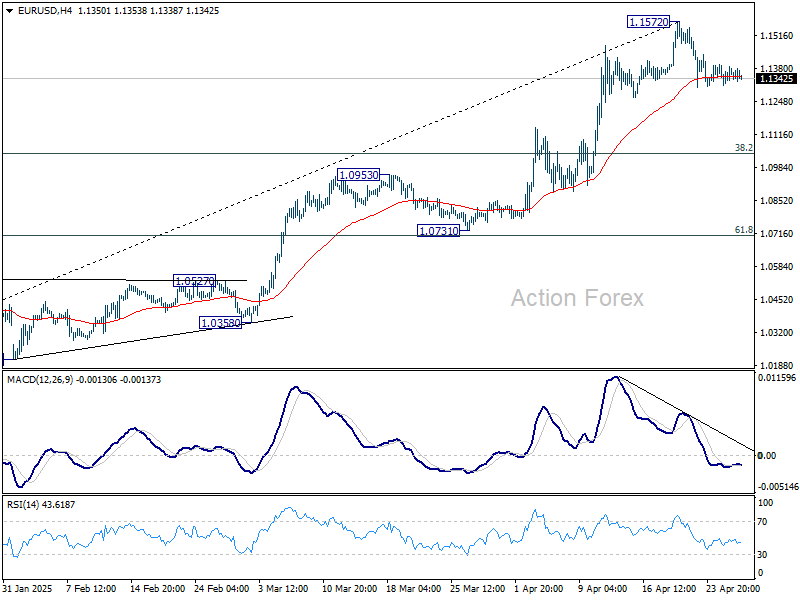
Intraday bias in EUR/USD stays mildly on the downside at this point. Correction from 1.1572 short term top could still extend lower. Nevertheless, strong support should be seen from 38.2% retracement of 1.0176 to 1.1572 at 1.1039 to contain downside. On the upside, break of 1.1572 will resume larger up trend.
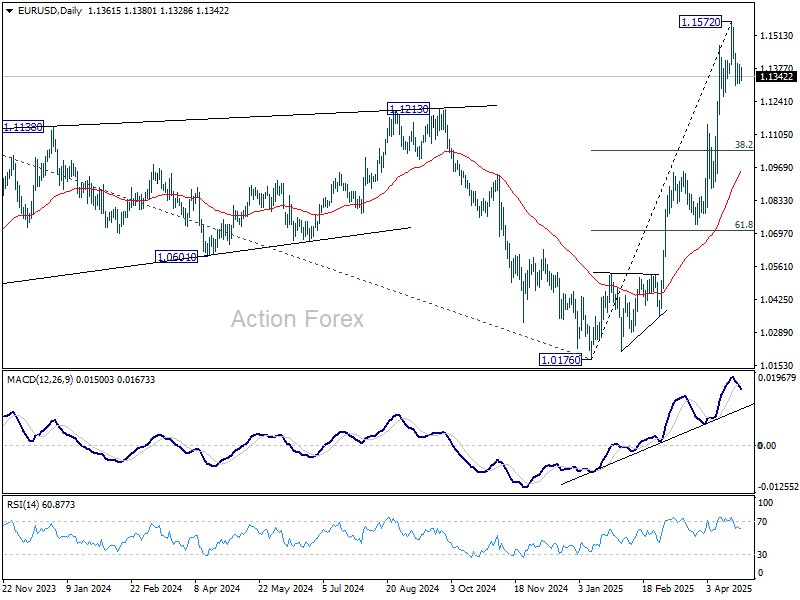
In the bigger picture, rise from 0.9534 long term bottom could be correcting the multi-decade downtrend or the start of a long term up trend. In either case, further rise should be seen to 100% projection of 0.9534 to 1.1274 from 1.0176 at 1.1916. This will now remain the favored case as long as 55 W EMA (now at 1.0792) holds.
USD/CHF Mid-Day Outlook
Daily Pivots: (S1) 0.8246; (P) 0.8290; (R1) 0.8321; More….
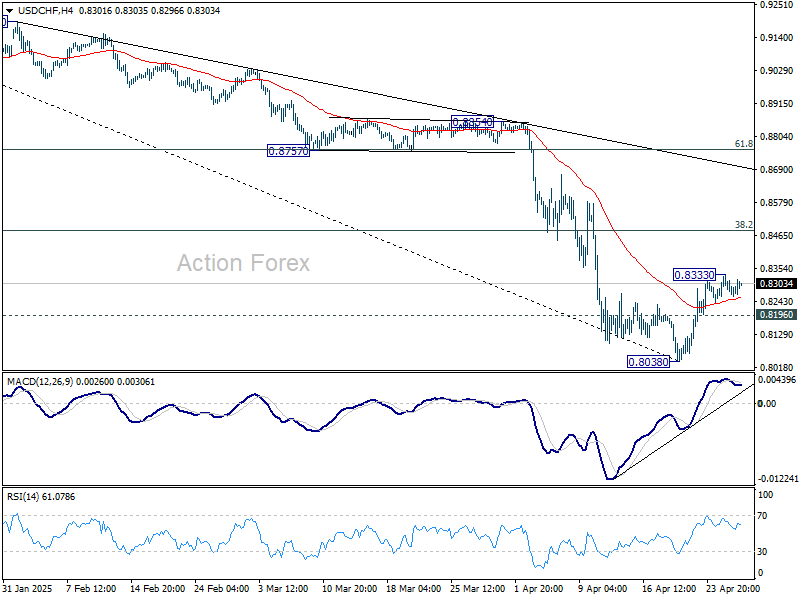
Intraday bias in USD/CHF is turned neutral first with 4H MACD staying below signal line. On the upside, above 0.8333 will resume the rebound from 0.8038 short term bottom. But upside should be limited by 38.2% retracement of 0.9200 to 0.8038 at 0.8482. On the downside, below 0.8196 minor support will bring retest of 0.8038. Firm break there will resume larger down trend.
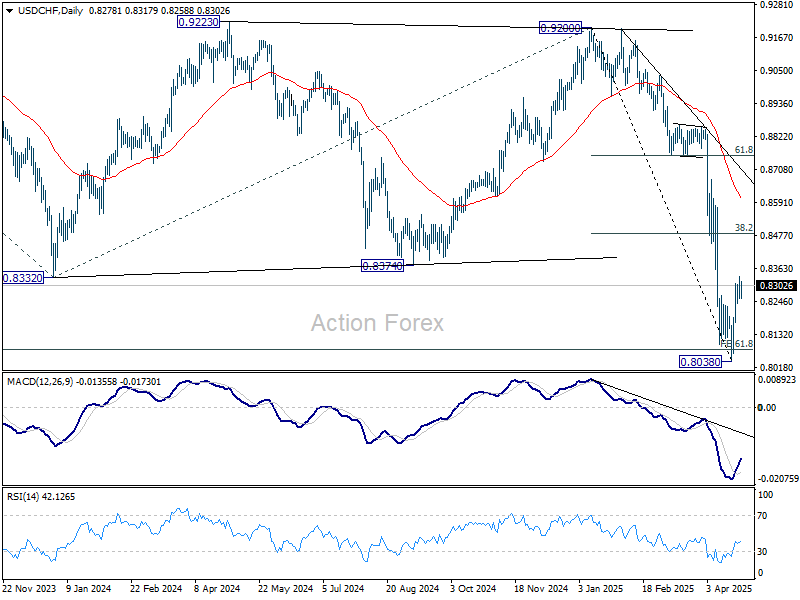
In the bigger picture, long term down trend from 1.0342 (2017 high) is still in progress and met 61.8% projection of 1.0146 (2022 high) to 0.8332 from 0.9200 at 0.8079 already. In any case, outlook will stay bearish as long as 55 W EMA (now at 0.8783) holds. Sustained break of 0.8079 will target 100% projection at 0.7382.
USD/JPY Mid-Day Outlook
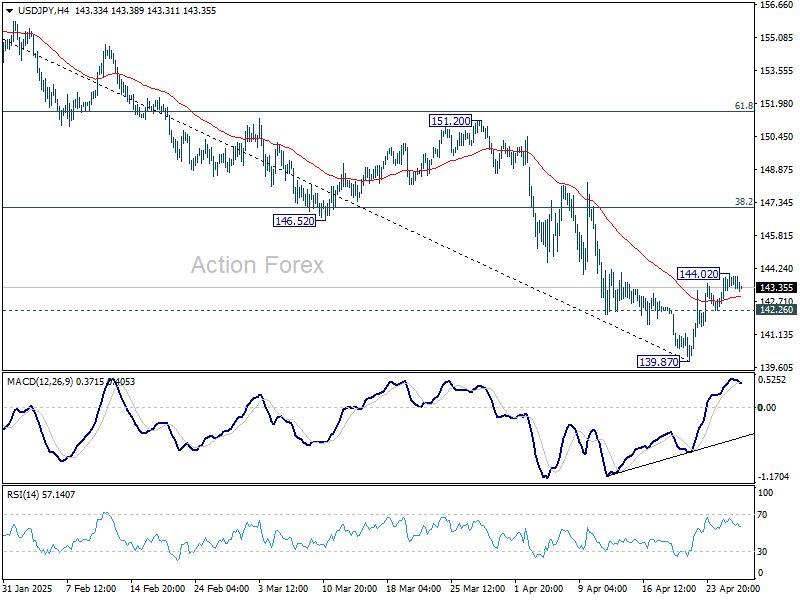
Daily Pivots: (S1) 142.82; (P) 143.42; (R1) 144.28; More...
Intraday bias in USD/JPY is turned neutral first with 4H MACD crossed below signal line. On the upside, above 144.02 will resume the rebound from 139.87. But ear term outlook will stay bearish as long as 38.2% retracement of 158.86 to 139.87 at 147.12 holds. On the downside, break of 142.26 will argue that the recovery from 139.87 short term bottom has completed as a corrective move. Retest of 139.87 should then be seen next in this case.
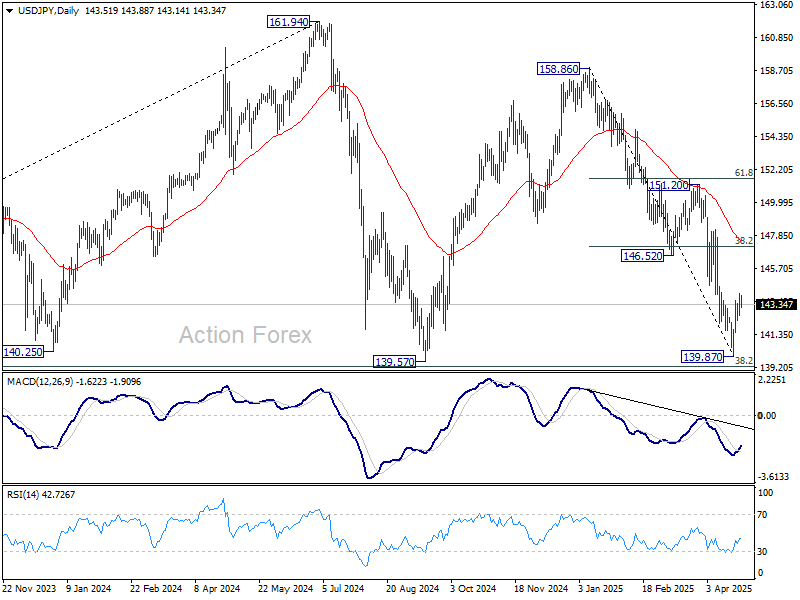
In the bigger picture, price actions from 161.94 are seen as a corrective pattern to rise from 102.58 (2021 low), with fall from 158.86 as the third leg. Strong support should be seen from 38.2% retracement of 102.58 to 161.94 at 139.26 to bring rebound. However, sustained break of 139.26 would open up deeper medium term decline to 61.8% retracement at 125.25.
GBP/USD Mid-Day Outlook
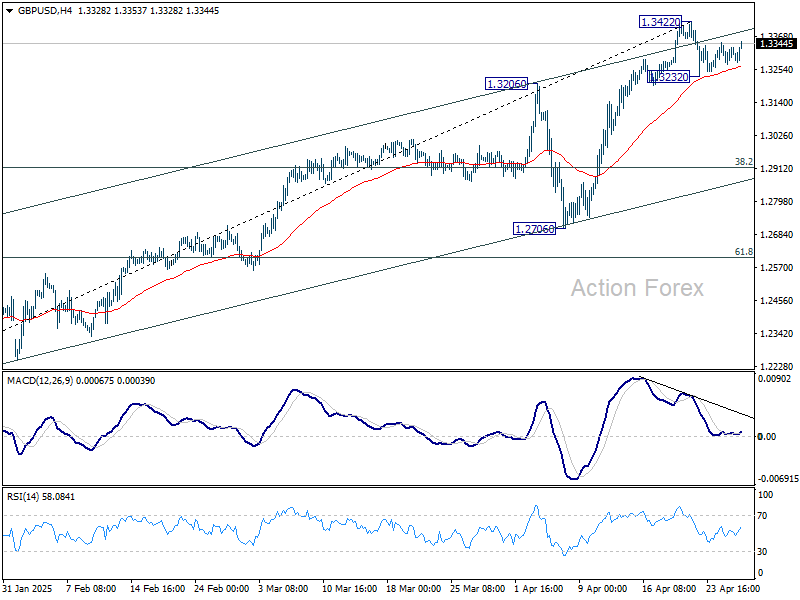
Daily Pivots: (S1) 1.3268; (P) 1.3318; (R1) 1.3361; More...
Intraday bias in GBP/USD is turned neutral first with today's recovery. Correction from 1.3422 short term top could still extend, and break of 1.3232 will turn intraday bias back the downside. But in this case, downside should be contained by 38.2% retracement of 1.2099 to 1.3422 at 1.2917. On the upside, firm break of 1.3422/33 resistance zone will resume larger up trend.
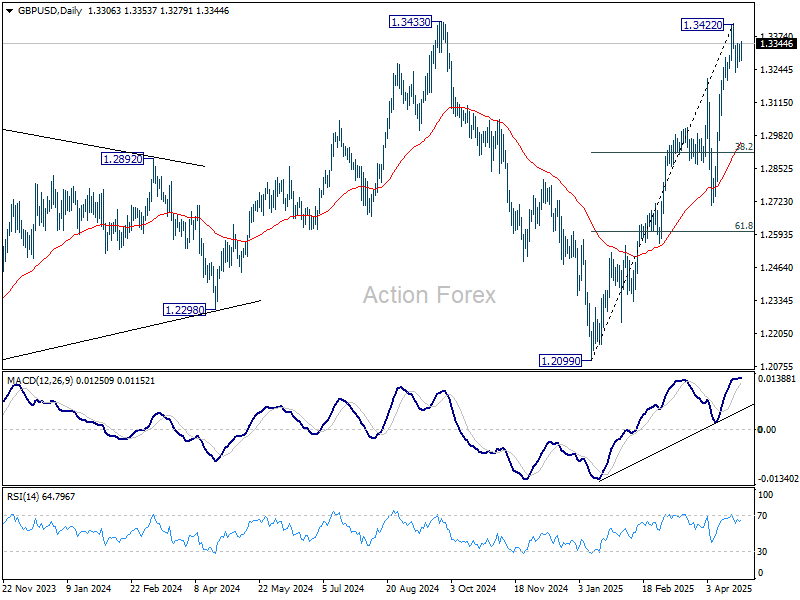
In the bigger picture, price actions from 1.3433 are seen as a corrective pattern to the up trend from 1.3051 (2022 low). Rise from 1.2099 could either be resuming the up trend, or the second leg of a consolidation pattern. Overall, GBP/USD should target 1.4248 key resistance (2021 high) on break of 1.3433 at a later stage.
Markets Stay Subdued Ahead of Big Data and Earnings; Trade Talks Remain in Focus
Trading remains notably subdued across global financial markets today as investors adopt a cautious stance. On deck are quarterly earnings from four of the "Magnificent Seven"—Amazon, Apple, Meta Platforms, and Microsoft. On top of that, key releases including US and Eurozone GDP, US non-farm payrolls, and Eurozone CPI flash inflation data will provide critical insights into the impacts of recent trade tensions on the economy.
Sentiment is caught between two powerful forces. On the pessimistic side, growing risks of a global recession stemming from escalating trade disruptions are weighing heavily. According to a Reuters poll, three-quarters of economists have downgraded their 2025 global growth forecasts, cutting the median forecast to 2.7% from 3.0% just a few months ago. Alarmingly, 60% of surveyed economists rated the risk of a global recession this year as either "high" or "very high." Investors will be keenly watching this week’s economic releases for validation—or rejection—of these rising recession fears.
However, there is also a glimmer of optimism. Any tangible breakthrough in ongoing trade negotiations could quickly improve sentiment. US Treasury Secretary Scott Bessent emphasized that "it’s up to China to de-escalate," highlighting that China's trade surplus with the US makes their current tariff burden "unsustainable." Bessent also hinted that India could soon become one of the first countries to finalize a new trade agreement with the US, keeping markets alert for needed boost to sentiment.
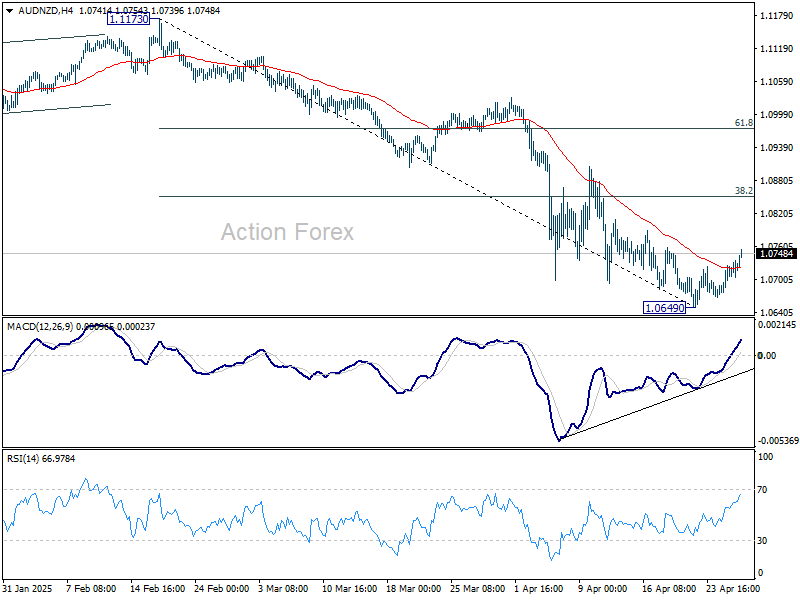
In the currency markets, Kiwi is the weakest performer of the day so far, followed by Swiss Franc and Loonie. On the stronger side, Ten is leading gains, followed by Sterling, and then Aussie. Dollar and Euro are sitting in the middle of the pack.
Technically, AUD/NZD's extended recovery suggests that a short term bottom was formed at 1.0649, on bullish convergence condition in 4H MACD. Stronger rally is in favor for the near term. But outlook will stay bearish as long as 38.2% retracement of 1.1173 to 1.0649 at 1.0849 holds. Another decline through 1.0649 is expected at a later stage once the current consolidation completes—especially if RBA moves toward faster rate cuts in response to weakening economic conditions.
In Europe, at the time of writing, FTSE is up 0.16%. DAX is up 0.55%. CAC is up 0.87%. UK 10-year yield is up 0.039 at 4.521. Germany 10-year yield is up 0.052 at 2.515. Earlier in Asia, Nikkei rose 0.38%. Hong Kong HSI fell -0.04%. China Shanghai SSE fell -0.20%. Singapore Strait Times fell -0.31%. Japan 10-year JGB yield fell -0.025 to 1.315.
IMF warns US tariffs to outweigh Germany’s stimulus, recommends just one more ECB cut
Higher infrastructure spending in Germany will offer some support to Europe’s growth outlook, but it won’t be enough to offset the damage caused by US tariffs, according to Alfred Kammer, director of the European department at the IMF.
Speaking to CNBC, Kammer stressed that "it’s the tariffs and the trade tensions which weigh on the outlook rather than the positive effects on the fiscal side."
He noted that the IMF has delivered a "meaningful downgrade" to growth forecasts for Europe’s advanced economies and an even steeper downgrade for the emerging Eurozone countries over the next two years. The IMF cut its Eurozone growth forecasts by -0.2% for each of the next two years, now projecting growth of just 0.8% in 2025 and 1.2% in 2026.
Kammer also outlined a clear policy recommendation for ECB. Acknowledging the success of the disinflation efforts, he suggested that ECB has room for "one more 25-basis-point cut in the summer," after which it should hold rates steady at around 2%, barring major shocks.
ECB’s Villeroy reaffirms gradual rate cut, sees no recession risk
French ECB Governing Council member Francois Villeroy de Galhau expressed confidence today that there is no imminent recession risk for either France or Europe, while inflation continues to decline.
Speaking to RTL Radio, Villeroy also reaffirmed that the ECB retains "a gradual margin for rate cuts", despite global uncertainties.
Villeroy also issued a strong warning about the risks stemming from US trade policies. He criticized the administration's protectionist stance, saying it was "playing against the US economy and unfortunately also against the world economy."
He stressed that protectionism ultimately leads to "less growth and more inflation."
China reaffirms growth target, holds back on major stimulus
China pledged its full confidence in achieving this year’s growth target of around 5%, vowing to implement timely and multiple support measures as the country is now in full-fledged trade war with the US. However, no major stimulus was announced immediately, giving the impression that Beijing is not in a rush to roll out large-scale interventions. Authorities appear inclined to first monitor the trade shock’s timing and magnitude before deciding on more aggressive measures.
Zhao Chenxin, deputy head of the National Development and Reform Commission, stressed at a press conference today that China retains "ample policy reserves and plenty of policy space," and highlighted plans to stabilize employment and strengthen public employment services.
At a Politburo meeting chaired by President Xi Jinping last week, officials called for a “timely reduction” in interest rates and reserve requirement ratios to support the economy. Additional measures to aid struggling businesses, boost consumption among middle- and lower-income groups, and promote further development in technology and artificial intelligence were also emphasized.
As a touch of optimism, official data released over the weekend showed China’s industrial profits returning to growth in the first quarter. Cumulative profits rose 0.8% yoy to CNY 1.5T, reversing a -0.3% decline seen in the first two months.
GBP/USD Mid-Day Outlook
Daily Pivots: (S1) 1.3268; (P) 1.3318; (R1) 1.3361; More...
Intraday bias in GBP/USD is turned neutral first with today's recovery. Correction from 1.3422 short term top could still extend, and break of 1.3232 will turn intraday bias back the downside. But in this case, downside should be contained by 38.2% retracement of 1.2099 to 1.3422 at 1.2917. On the upside, firm break of 1.3422/33 resistance zone will resume larger up trend.
In the bigger picture, price actions from 1.3433 are seen as a corrective pattern to the up trend from 1.3051 (2022 low). Rise from 1.2099 could either be resuming the up trend, or the second leg of a consolidation pattern. Overall, GBP/USD should target 1.4248 key resistance (2021 high) on break of 1.3433 at a later stage.
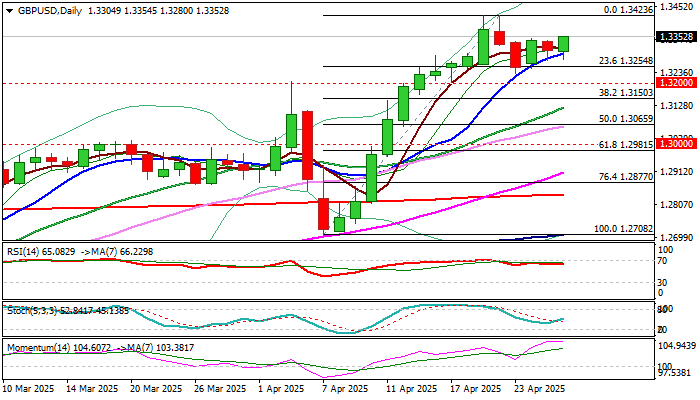
GBPUSD: Cable Remains Constructive But Likely Continue to Face Strong Headwinds from Key 1.3434 Barrier
Cable edged higher early Monday and pressure pivotal barrier at 1.3350 (Fibo 61.8% of 1.3423/1.3232 pullback / former recovery peak of Apr 24).
Series of higher lows since 1.3232 correction low, with fresh recovery being tracked by ascending 10DMA add to near term bullish bias, with sustained break of 1.3350 needed to confirm that corrective phase is over, and larger bulls look for fresh attack at key 1.3434 barrier (2024 top).
On the other hand, sharp drop in confidence in the UK economy (at the historical low) and signal that already fragile economy may weaken further, add to warnings that larger bulls may stall on approach to 1.3434.
Growing optimism on fading threats from the negative impact from US trade tariffs and initial signals of Ukraine war peace talks may offer fresh support to US dollar and push sterling in defensive.
The notion is supported by overbought weekly studies, fading bullish momentum and strong upside rejection last week (weekly candle with long upper shadow).
Also, momentum is overstretched and turned sideways on daily chart, along with RSI being close the border of overbought zone, although daily studies are overall still bullish.
Expect prolonged consolidation while the price action remains limited by 1.3423 (recent recovery peak) and 1.3254 (Fibo 23.6% of 1.2708/1.3423 upleg / correction low).
Loss of 1.3254/ 1.3200 to weaken near term structure and risk deeper correction towards 1.3150 (Fibo 38.2%) and 1.3121 (20DMA).
Res: 1.3400; 1.3434; 1.3515; 1.3588
Sup: 1.3298; 1.3254; 1.3200; 1.3150
Canadian Dollar in Holding Pattern on Election Day
The Canadian dollar is showing limited movement on Monday. In the European session, USD/CAD is trading at 1.3868, up 0.10% on the day. There are no economic releases out of the US or Canada today.
Liberals expected to win Canadian election
It's Election Day in Canada. Prime Minister Mark Carney, who has only been in office since March, is favored to win the election. Carney's Liberal Party was badly trailing the Conservatives but US President Trump has ignited Canadian nationalism and turned the election race upside down.
Trump has talked about annexing Canada and although most Canadians don't expect that to happen, there is strong resentment against the US tariff policy, which has hit Canada even though the two countries have a free trade agreement.
Carney is viewed as a strong leader who can stand up to Trump and the markets have priced in a Liberal majority. If the Liberals are forced to make a coalition with the smaller parties, the new government would be considered less stable and that would likely trigger some CAD weakness. If the Conservatives manage to pull out a surprise election victory, the Canadian dollar would likely get a boost.
Canada's retail sales dips in February, rebounds in March
Canada's retail sales declined 0.4% m/m in February but bounced back in March with a strong gain of 0.7%. On an annualized basis, retail sales slipped to 4.7% in February, down from a revised 5.3% in January.
The improvement in March was driven by consumers making purchases ahead of US tariffs, but consumer spending is likely to deteriorate. The Bank of Canada will be keeping a close eye and will have to consider further rate cuts if upcoming economic data is weak. The BoC maintained the cash rate at 2.75% earlier this month and meets next on June 4.
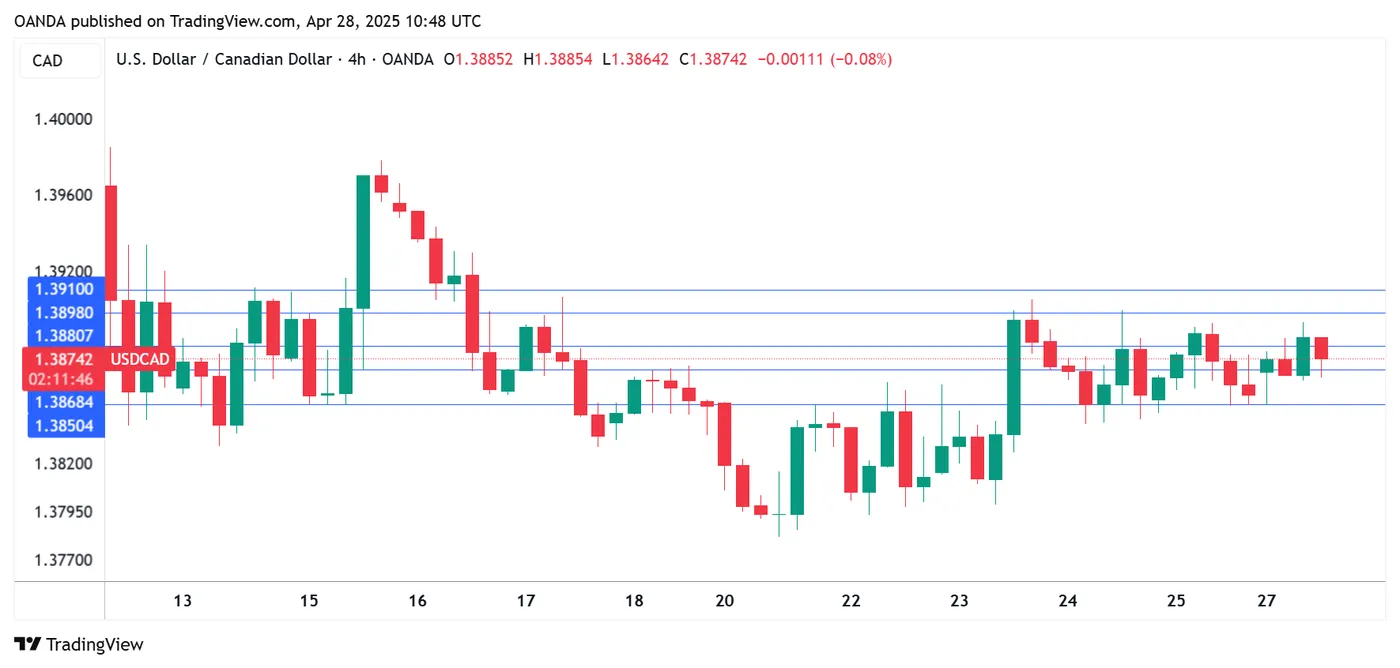
USD/CAD Technical
USD/CAD is testing resistance at 1.3868. Above, there is resistance at 1.3880 and 1.3910
1.3850 and 1.3838 are the next support levels
USD/CAD 4-Hour Chart, April 28, 2025
Brent Crude Analysis: Trade Talks, OPEC+, and Technical Levels
- Brent Crude prices are consolidating amid US-China trade talks, US-Iran nuclear deal progress, and upcoming OPEC+ meeting.
- Technical analysis shows Brent Crude in a tight range with key support and resistance levels identified.
- OANDA client sentiment data shows a majority of traders are long on WTI, suggesting potential for a price decline.
Brent Crude prices continue to consolidate at the start of the week as market participants grapple with a host of challenges.
Among the challenges, market participants are looking for clearer answers from the ongoing US-China trade talks, which have sent mixed signals. At the same time, the US and Iran are making progress on a nuclear deal, with plans to meet again in Europe soon. OPEC+ is set to meet on May 5 to decide on production plans for June.
OAU-PRS-236-MarketPulse-variant2-Square
Some members of OPEC+ are likely to propose increasing oil production faster for the second month in a row during their meeting on May 5. These developments have raised the issue of supply once more at a time when global markets are still trying to make sense of how proposed tariffs and trade deals may shake up demand.
Supply had been expected to increase as the Trump administration had promised to loosen regulation and pump more oil. However, looking at the rig count and the number of active oil rigs went up by two to 483 as of April 25, 2025. However, this is still 23 fewer rigs than at the same time last year.
Drilling activity has increased though for a second consecutive week. This is the first time this has happened since February. The question is however, will the rig count and drilling activity continue to rise if Oil prices remain under pressure?
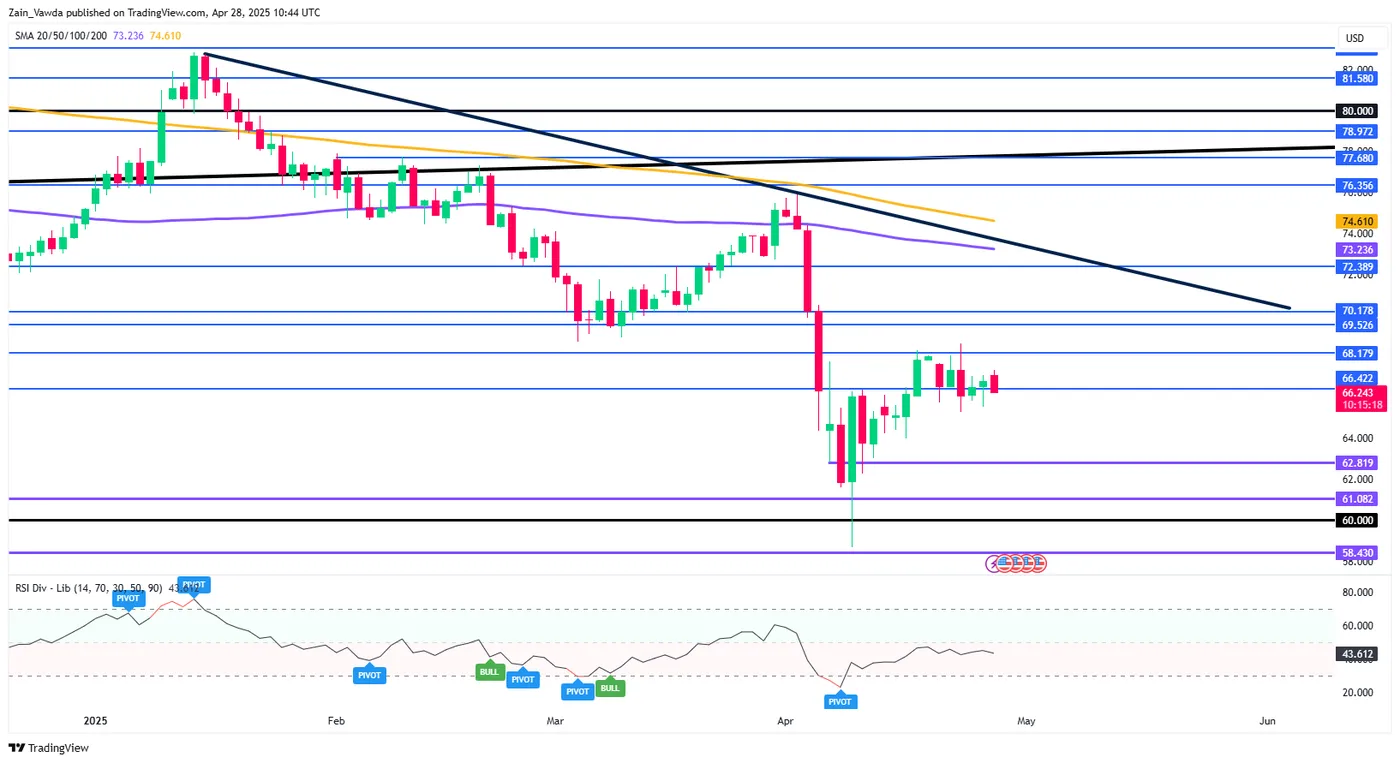
Technical Analysis - Brent Crude
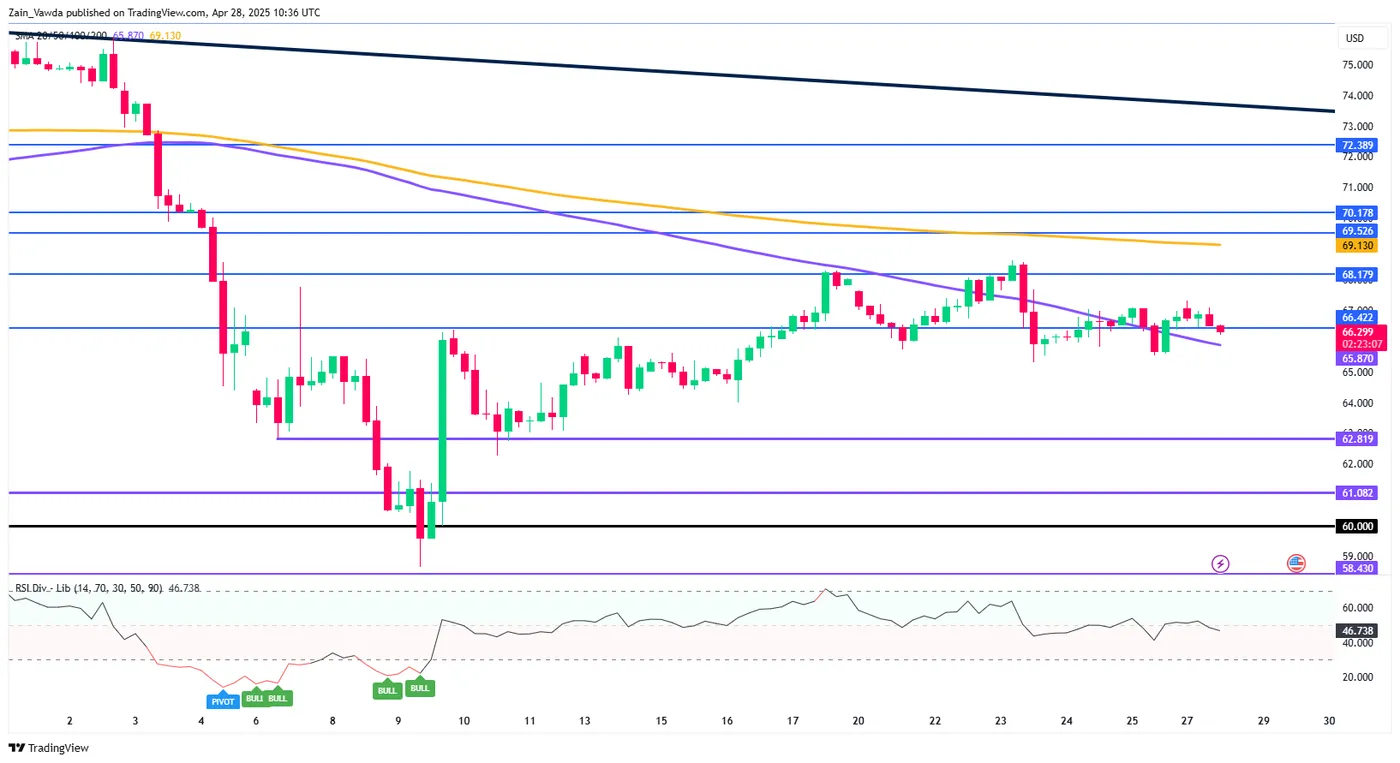
From a technical analysis standpoint, Brent has remained in a tight range since April 17.
Friday's daily candle closed as a hammer candlestick hinting at further upside. A small push higher in the Asian session has failed to continue after the European open.
Support is currently being tested at 66.44.
Brent Crude Oil Daily Chart, April 28, 2025
Source: TradingView (click to enlarge)
Dropping down to an H4 chart, and you can get a better sense of the indecision in oil markets at present.
Price action has seen a lower low being printed which was then followed by a higher high. For now, immediate support at 65.59 needs to hold if bulls are to push prices higher.
The first key area of resistance that needs to be broken rests at around 67.100 which could open up a retest of resistance at 68.17 and the 200-day MA at 69.13.
Brent Crude Oil Four-Hour Chart, April 28, 2025
Source: TradingView (click to enlarge)
Client Sentiment Data
Looking at OANDA client sentiment data and market participants are long on WTI with 83% of traders holding long positions. I prefer to take a contrarian view toward crowd sentiment and thus the fact that so many traders are long means WTI prices could decline further.
Steady Start as Trade Talk Limbo Continues
Asian markets started the week calmly, with investors waiting for updates on US trade talks and possible new stimulus measures from China before making big moves.
A regional index gained 0.6%, while S&P 500 futures dropped 0.6%, hinting that the recent four-day rally in US markets might be slowing down. Gold fell by as much as 1.6% as traders sold off, feeling its recent surge was overdone. Meanwhile, Treasuries and the Dollar stayed steady, but cryptocurrency prices declined.
Investors are watching for signs of progress in US trade discussions, especially after Trump indicated he’s unlikely to delay his planned tariffs again. Export-reliant Asian economies, which have faced tough US tariffs, seem to be negotiating more effectively than their Western counterparts.
Chinese authorities continue to state that there have been no calls with the US over a trade deal. Chinese officials said they plan to provide more support for jobs and the economy. They are confident the government will hit its economic goals this year. The PBOC also promised to keep enough money flowing in the market and will lower banks' reserve requirements and interest rates when needed.
The dollar stayed stable on Monday as investors anxiously awaited updates on U.S. trade policy and a busy week of economic reports that might show the impact of Trump's trade war.
For a full breakdown on the week ahead read Markets weekly outlook - Data dump ahead as tariff concerns linger
Currently at 143.69/yen and 1.1325/euro, the dollar has steadied but remains on track for its biggest monthly drop in over two years due to shaken confidence in U.S. assets under Trump’s policies.
Currency Strength Chart, Strongest - Weakest: USD, JPY, GBP, AUD, CAD, EUR, NZD, CHF
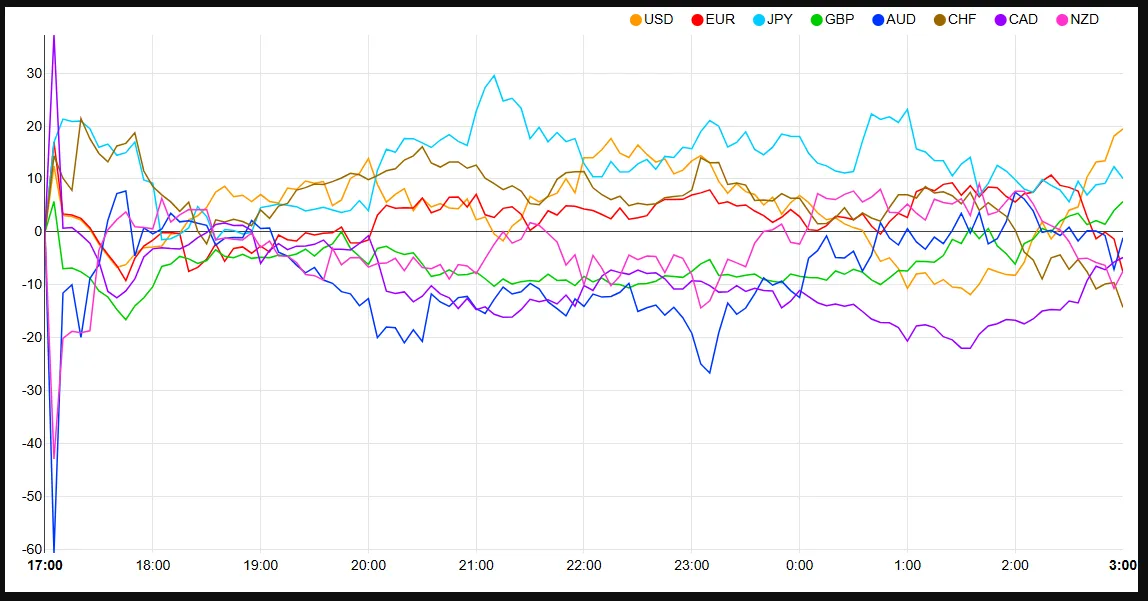
Source: FinancialJuice
Oil prices rose slightly this morning as the market stayed cautious about ongoing U.S.-China trade talks.
Gold prices slid this morning surrendering the $3300/oz handle to trade at $3285/oz at the time of writing. Risks for Gold have shifted to the downside as optimism around a trade deal remains.
Market participants are starting to believe that the worst may be behind us where tariffs are concerned and this will make it difficult for Gold bulls in the short- term.
Economic data releases
From a data standpoint, it’s a bit of a quiet start to the week as traders brace for a barrage of data releases starting Wednesday. In the interim overall sentiment will be the primary market driver.
Chart of the day - DAX
From a technical standpoint, the DAX has continued its advance in line with other risk assets.
The index is currently testing a key level of resistance at 22405 with a daily candle close above likely opening up further upside.
Immediate resistance rests at 22620 before the 22800 and 23200 handle come into focus.
For now immediate support is provided by the 50-day MA at 22282 before the 22000 and 21600 handles come into focus.
DAX Daily Chart, April 28, 2025
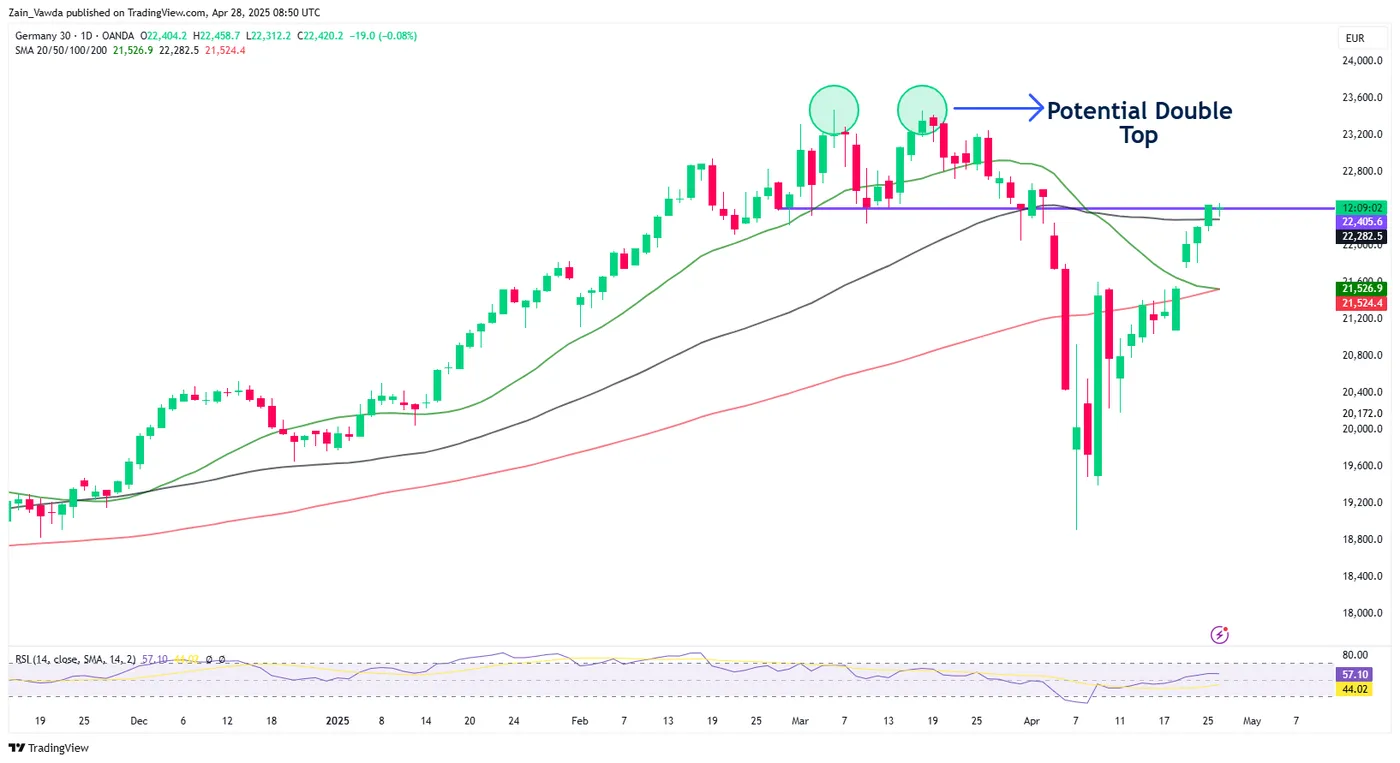
Source: TradingView.com (click to enlarge)