
Sample Category Title
EUR/CHF Daily Outlook
Daily Pivots: (S1) 0.9340; (P) 0.9389; (R1) 0.9415; More....
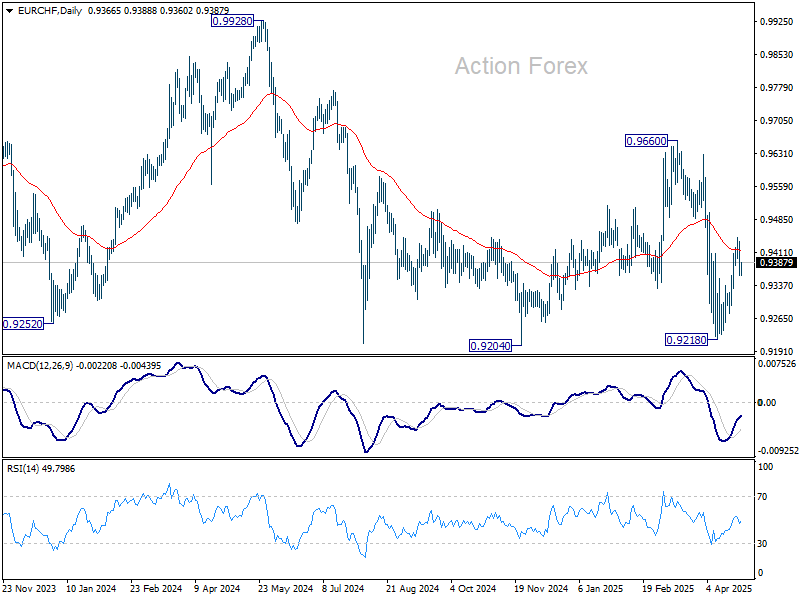
Intraday bias in EUR/CHF remains neutral for the moment. Rebound from 0.9218 is either a corrective move, or the third leg of the pattern from 0.9204. Break of 0.9445 will resume the rebound towards 0.9660 resistance. However, on the downside, break of 0.9336 will bring retest of 0.9204/18 support zone.
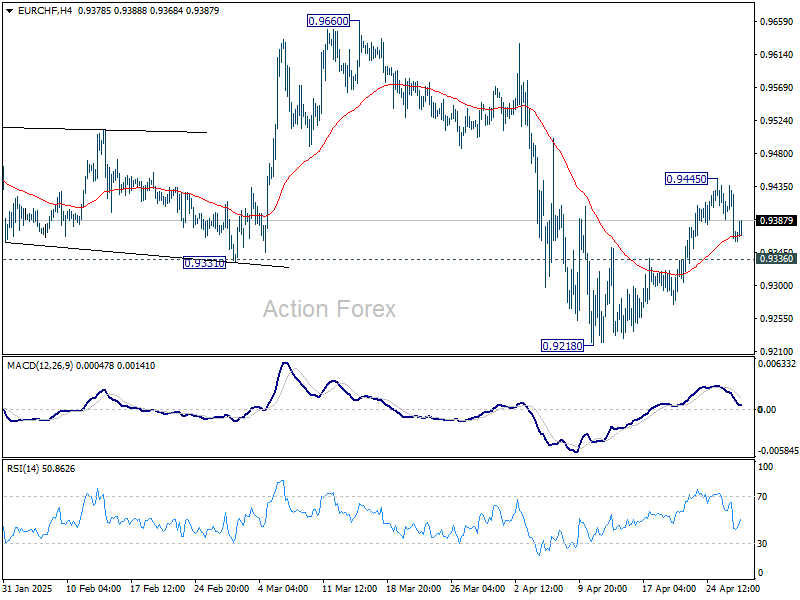
In the bigger picture, prior rejection by long-term falling channel resistance (now at 0.9555) retains medium term bearishness. That is, down trend from 1.2004 (2018 high) is still in progress. Firm break of 0.9204 (2024 low) will confirm resumption. This will remain the favored case as long as 0.9660 resistance holds.
EUR/USD Daily Outlook
Daily Pivots: (S1) 1.1358; (P) 1.1391; (R1) 1.1454; More...
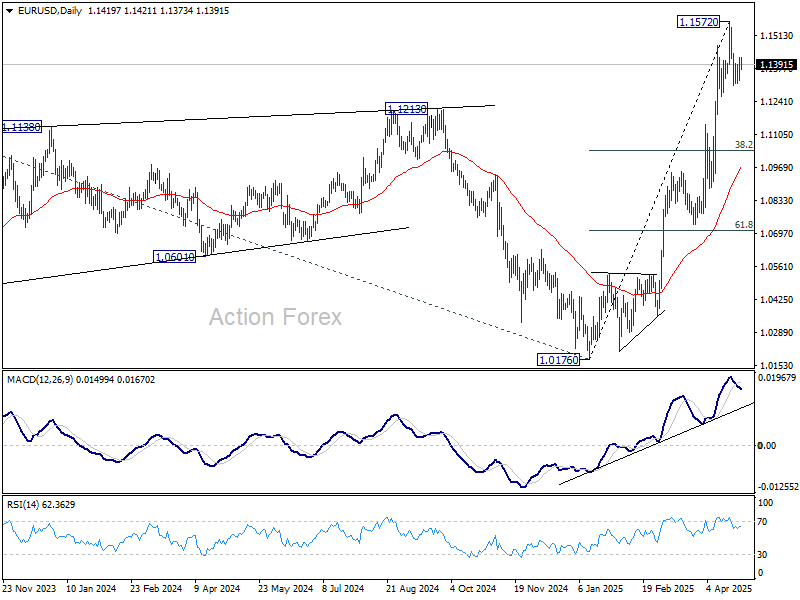
Intraday bias in EUR/USD is turned neutral first. On the downside,, break of 1.1306 will extend the correction from 1.1572. But strong support should be seen from 38.2% retracement of 1.0176 to 1.1572 at 1.1039 to contain downside. On the upside, break of 1.1572 will resume larger up trend.
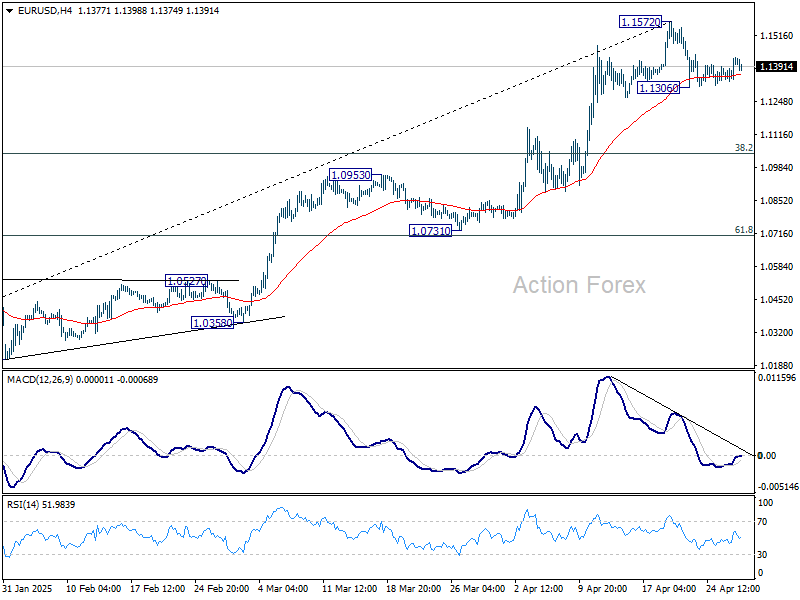
In the bigger picture, rise from 0.9534 long term bottom could be correcting the multi-decade downtrend or the start of a long term up trend. In either case, further rise should be seen to 100% projection of 0.9534 to 1.1274 from 1.0176 at 1.1916. This will now remain the favored case as long as 55 W EMA (now at 1.0792) holds.
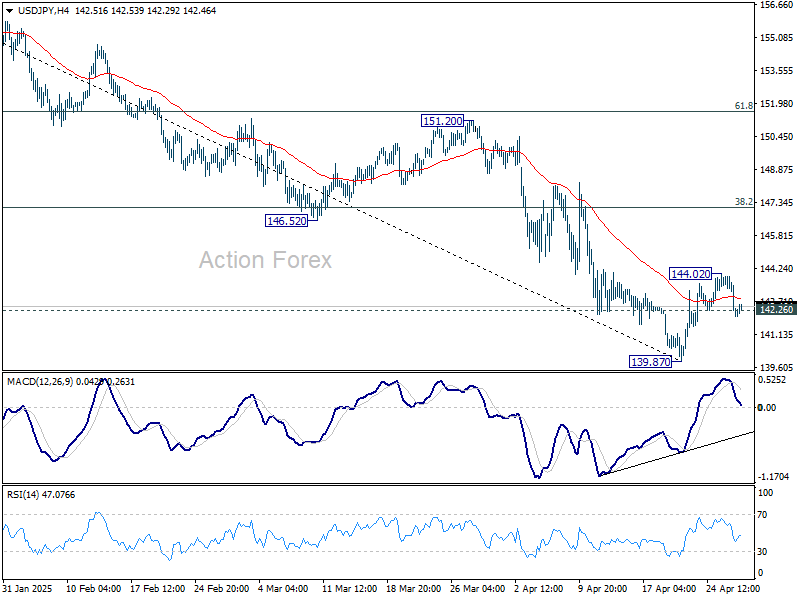
USD/JPY Daily Outlook
Daily Pivots: (S1) 141.37; (P) 142.64; (R1) 143.28; More...
Intraday bias in USD/JPY remains neutral for the moment. On the upside, above 144.02 will resume the rebound from 139.87. But ear term outlook will stay bearish as long as 38.2% retracement of 158.86 to 139.87 at 147.12 holds. On the downside, firm break of 142.26 will argue that the recovery from 139.87 short term bottom has completed as a corrective move. Retest of 139.87 should then be seen next in this case.
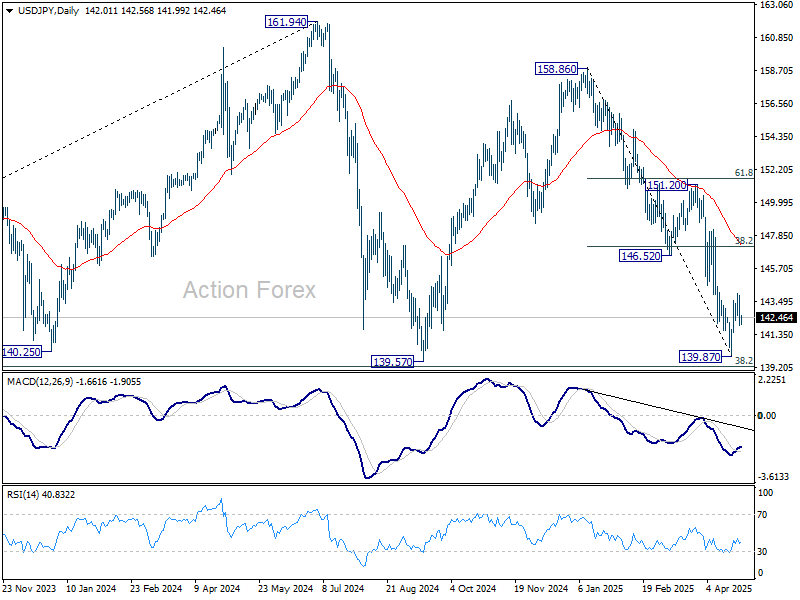
In the bigger picture, price actions from 161.94 are seen as a corrective pattern to rise from 102.58 (2021 low), with fall from 158.86 as the third leg. Strong support should be seen from 38.2% retracement of 102.58 to 161.94 at 139.26 to bring rebound. However, sustained break of 139.26 would open up deeper medium term decline to 61.8% retracement at 125.25.
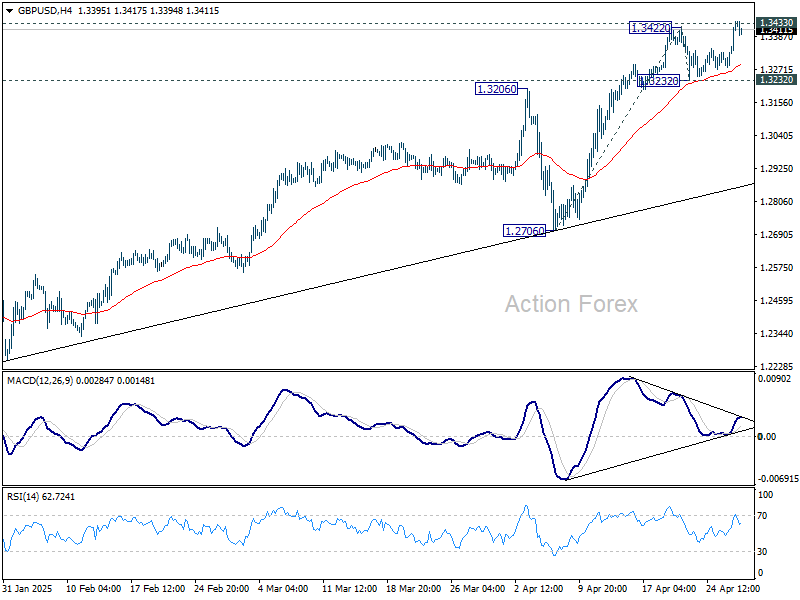
GBP/USD Daily Outlook
Daily Pivots: (S1) 1.3334; (P) 1.3389; (R1) 1.3499; More...
Intraday bias in GBP/USD is back on the upside with breach of 1.3422. Immediate focus is now on 1.3433 key resistance. Firm break there will confirm larger up trend resumption. Next near term target is 61.8% projection of 1.2706 to 1.3422 from 1.3232 at 1.3674. However, break of 1.3232 support will indicate rejection from 1.3433, and bring deeper decline back to 55 D EMA (now at 1.2978) and possibly below.
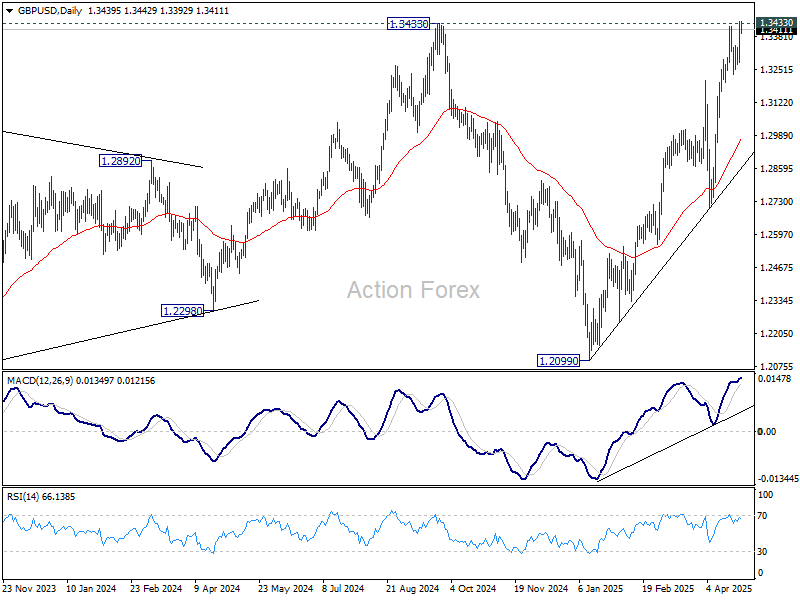
In the bigger picture, price actions from 1.3433 are seen as a corrective pattern to the up trend from 1.3051 (2022 low). Rise from 1.2099 could either be resuming the up trend, or the second leg of a consolidation pattern. Overall, GBP/USD should target 1.4248 key resistance (2021 high) on break of 1.3433 at a later stage.
USD/CHF Daily Outlook
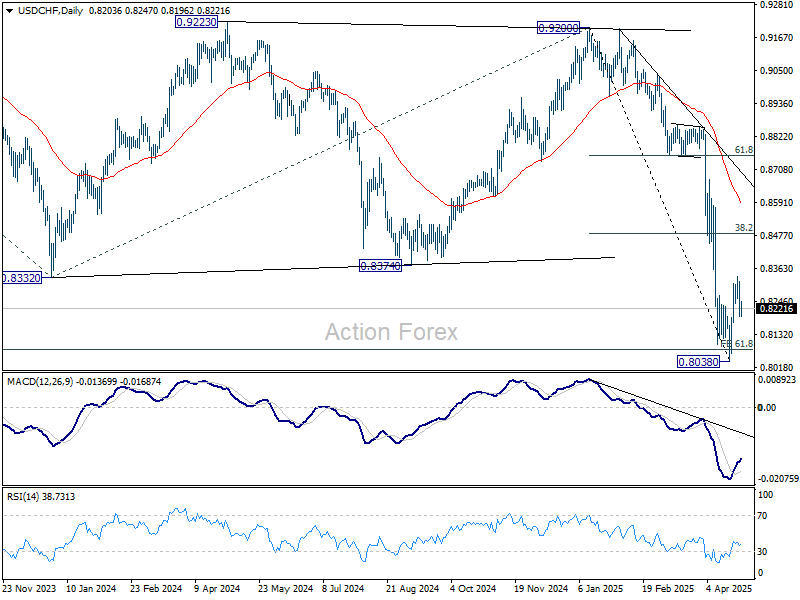
Daily Pivots: (S1) 0.8159; (P) 0.8239; (R1) 0.8280; More….
Intraday bias in USD/CHF remains neutral for the moment. On the upside, above 0.8333 will resume the rebound from 0.8038 short term bottom. But upside should be limited by 38.2% retracement of 0.9200 to 0.8038 at 0.8482. On the downside, below 0.8196 minor support will bring retest of 0.8038. Firm break there will resume larger down trend.
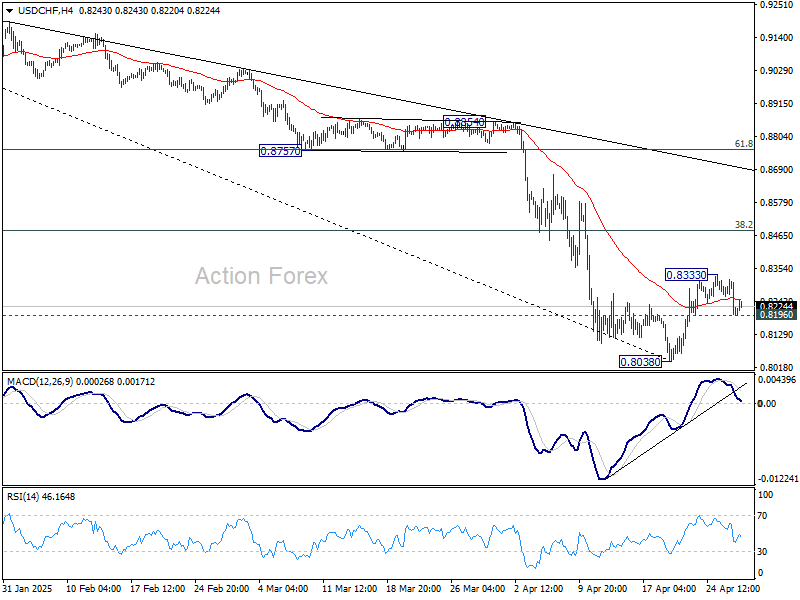
In the bigger picture, long term down trend from 1.0342 (2017 high) is still in progress and met 61.8% projection of 1.0146 (2022 high) to 0.8332 from 0.9200 at 0.8079 already. In any case, outlook will stay bearish as long as 55 W EMA (now at 0.8783) holds. Sustained break of 0.8079 will target 100% projection at 0.7382.
USD/CAD Daily Outlook
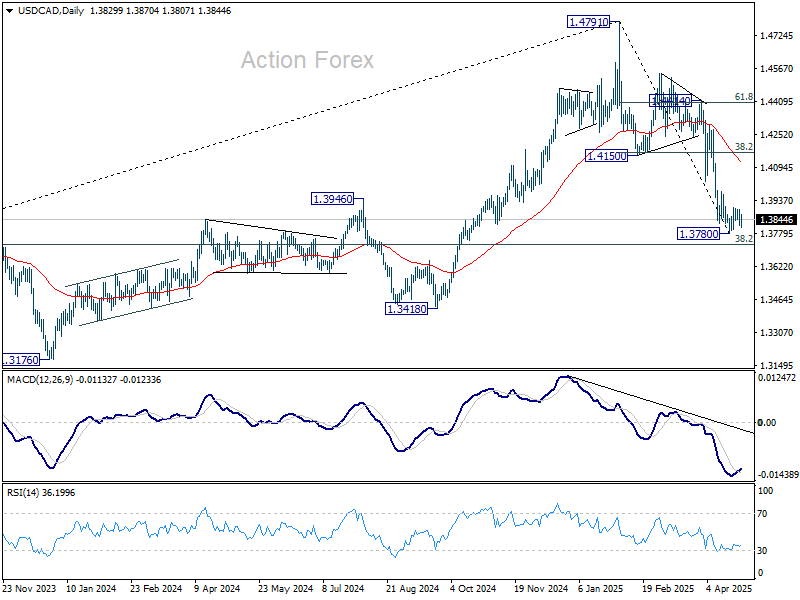
Daily Pivots: (S1) 1.3799; (P) 1.3846; (R1) 1.3875; More...
Intraday bias in USD/CAD is turned neutral first. On the upside, break of 1.3903 minor resistance will extend the rebound from 1.3780. But upside should be limited by 1.4150 support turned resistance (38.2% retracement of 1.4791 to 1.3780 at 1.4166). On the downside, firm break of 1.3780 short term bottom will resume the whole fall from 1.4791.
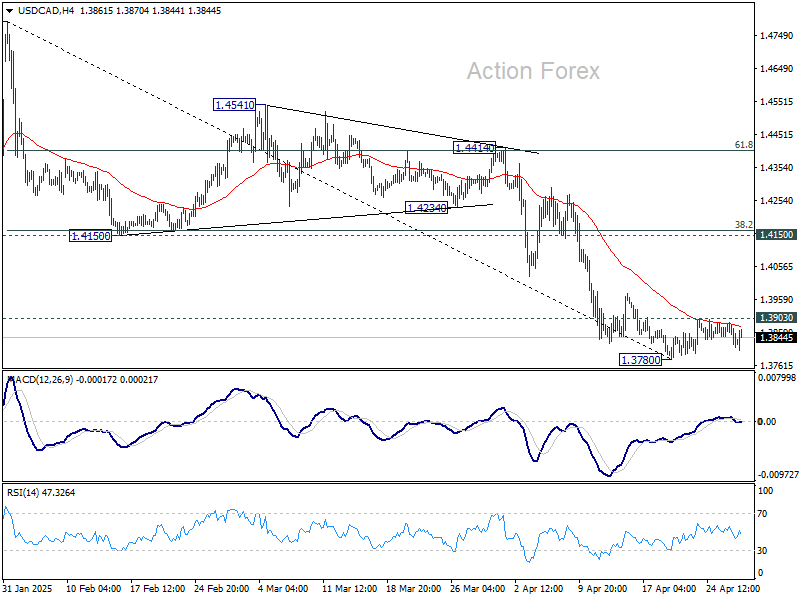
In the bigger picture, price actions from 1.4791 medium term top could either be a correction to rise from 1.2005 (2021 low), or trend reversal. In either case, further decline is expected as long as 1.4150 resistance turned support holds. firm break of 38.2% retracement of 1.2005 (2021 low) to 1.4791 at 1.3727 will pave the way back to 61.8% retracement at 1.3069.
US Yield Decline Weighs on Dollar
Markets
The US yield curve yesterday abruptly swapped a bear steepening move for a flattening one with net daily changes varying between -5.5 (2-yr) to -1.9 bp (30-yr). The intraday rise against the backdrop of an empty eco calendar and relative silence on the trade front lost momentum around the start of US dealings. A dramatically weaker Dallas Fed manufacturing activity index did the rest even though the indicator has nowhere near the importance of the likes of the ISMs. Either way, the headline index dropped to its lowest level since the pandemic while the six month outlook was the poorest in 1.5 years amid the “insanity” and “chaos” Trump’s tariff had sparked. Bunds underperformed. German yields rose, supported by the technical charts. Changes varied between 2.3 bps (2-yr) and 5.8 bps (30-yr). The US yield decline weighed on the dollar. DXY moved a bit deeper below 100 again and EUR/USD keeps the pressure on 1.14 high. USD/JPY slid from 143.64 at the open to 142.01 in the close. Sterling had a nice run. EUR/GBP was (and still is) testing the 0.85 area. The White House yesterday said trade talks with the UK are moving in a very positive direction. US stocks gradually fell before finding a bottom mid-session. Wall Street eventually closed mixed with minor gains for the DJI and losses for the Nasdaq.
The economic calendar will flush the market in the coming days. We’re curious to find out whether (US) eco data regain importance now the tariff storm ebbed (not disappeared, though). In today’s kick-off the US releases JOLTS job openings and a closely followed consumer confidence indicator (Conference Board). The ECB publishes its monthly consumer inflation expectations survey while the first inflation and Q1 GDP numbers are on tap in the likes of Belgium and Spain. We stick to our call of having entered a short-term period of market consolidation. The dollar is currently having a slight upper hand in the FX market going into the numbers. From a technical point of view we could see EUR/USD oscillating in the 1.1274 (2023 top) - 1.1573 (April high) range. GBP’s momentum may stretch to first resistance at EUR/GBP 0.84735. We feel bond yields have dropped far enough but calling the bottom proves tricky. The 10-yr yield in the US is currently attacking support at 4.20% (50% retracement on the Sept-Jan rally) with the next reference located near 4.10%. Germany’s 10-yr yield is set for a lower open and is eying strong support around 2.4%.
News & Views
Czech central bank (CNB) deputy governor Eva Zamrazilova in an interview yesterday indicated that the CNB easing cycle may be coming to an end, Bloomberg reported. The CNB currently has its policy rate at 3.75% and has a next policy meeting next week on May 7. Zamrazilova indicated that she will decide between cutting the key interest rate by 25 bps or holding it unchanged. She also questions market pricing that there might be scope for further easing over the next year. The deputy governor in particular referred to the housing market as an upside driver of inflation as rising property prices via imputed rent will support a trend of higher core and headline inflation. Even as the trade war is curbing global demand, Zamrazilova sees other aspects of deglobalization creating inflationary pressures. In this respect, she also indicated that market expectations for a terminal interest rate at around 3.0% might be overly optimistic. Yesterday, CNB Governor Michl in another interview said that any further easing would be very cautious. The Czech koruna yesterday was again well bid and strengthened further below EUR/CZK 25.00 (24.94).
The Liberal Party according to the latest available results is expected to have won the parliamentary elections in Canada. However, for now it is still highly uncertain whether the party led by Mark Carney will secure the 172 seats that are needed of secure an outright majority in the House of Commons. Latest results/estimates currently give the Liberal party 165 seats (43% of the national vote) with 147 for the Conservative party. This might force Carney to cooperate with other parties to pass legislation. In this respect an important role is seen for the Bloc Quebecois which is estimated to have secured 23 seats. Managing the trade war with the US and addressing the challenges that it brings will be an important task of the new government. The Canadian dollar initially rebound after first results came in, but (more than) reversed these gains as chance grew that the government would fail to reach an outright majority (USD/CAD 1.387 currently).
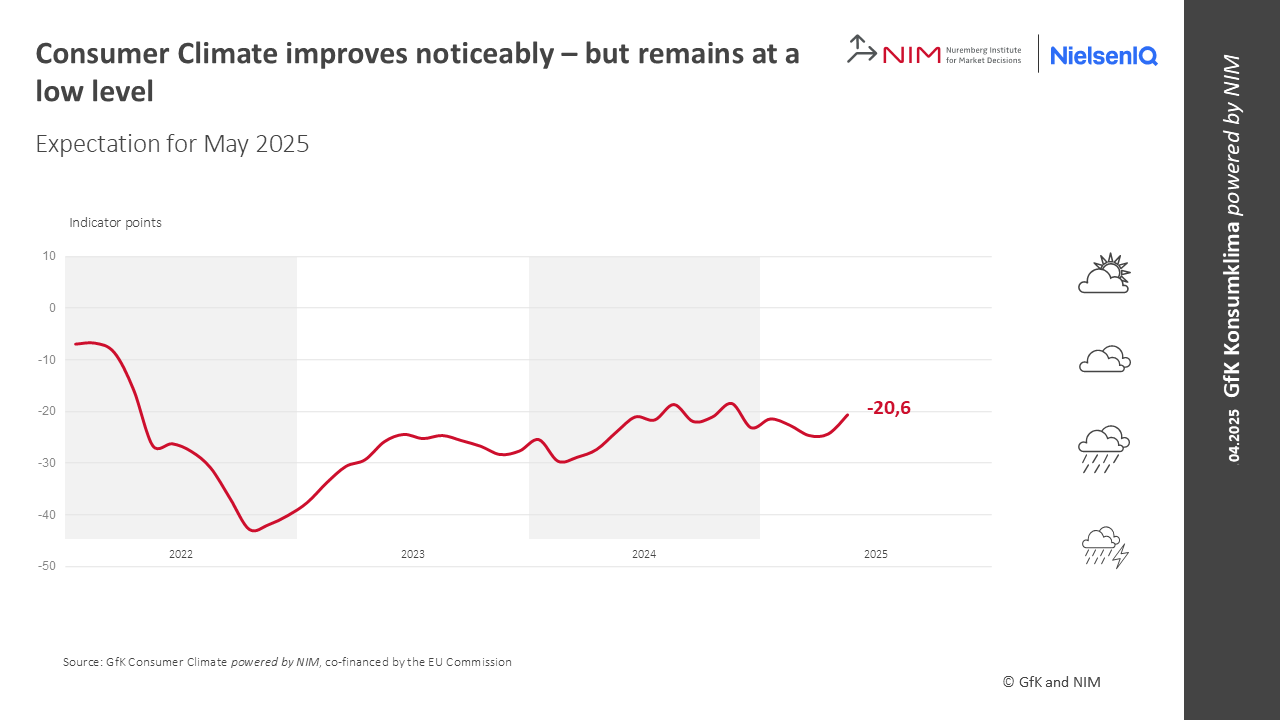
German Gfk consumer sentiment rises to -20.6, domestic political stability offsets trade concerns
Germany’s GfK Consumer Sentiment Index for May rose from -24.3 to -20.6 and outperforming expectations for a decline to -26.0.
In April, key underlying indicators also showed encouraging signs. Income expectations rose sharply for a second straight month, climbing 7.4 points to 4.3, their highest level since October 2024. Economic expectations increased modestly for a third consecutive month. Willingness to save fell, while willingness to buy improved slightly.
Rolf Bürkl, consumer expert at NIM, noted that US President Donald Trump’s aggressive tariff announcements in early April have "not yet had lasting impacts on consumer sentiment" in Germany.
Instead, German consumers appear more reassured by the domestic political backdrop, particularly the successful conclusion of coalition negotiations and the imminent formation of a new government. The easing of political uncertainty has helped mitigate potential negative effects from external trade tensions.
100 Days in: Chaos, Confusion and Counting
The week kicked off on a slightly positive note for European equities on continued expectations that the disinflationary impact of Trump’s trade policies would allow the European Central Bank (ECB) to give ample support to the underlying economies. But sentiment was much less bullish for US equities, which saw an initial drop on rising inflation expectations for the US economy and worries that any Federal Reserve (Fed) support would be limited due to a heat-up in inflation dynamics. And indeed, we see all over the news and posts how the Chinese are reflecting almost all of their import costs onto their clients. Some think that the tariff impact will be temporary; some — including the Fed members — are starting to think that the impact could last longer than just a one-off jump in prices; while many continue to hope that Trump will have no choice but to dial back his tariffs — and the threats — as the rest of the world has shown much greater resilience to Trump’s attacks, with China in particular appearing ready to fight to the last dime.
The good news of the day is that it’s been a few days since we last heard fresh attacks by Trump. It feels like he’s been obliged to slow down the pace and intensity of his attacks. The bad news is, there is no clarity regarding the tariff situation, and the best outcome would be that the US keeps the 10% tariffs for everyone even if negotiations go well and lead to a favourable outcome. Anyway, for investor mood, three things matter:
- No news from Trump is good news — it means that he and his government are softening their tone. Scott Bessent says that they are leaving China aside and concentrating on other negotiations for now, but there is a clear reluctance to further escalate the war on the Chinese front.
- A dovish shift in Fed expectations would be more than welcome, even though the Fed can’t do much if inflation picks up momentum.
- Earnings must live up to expectations and forecasts shouldn’t sound too gloomy.
Unfortunately, on that front, the news is not brilliant. Bloomberg’s Economics team warns that a 22% tariff model would lead to a 7% contraction of S&P 500 companies’ net income in 2025 versus the current estimate of 12% growth. Some say that a softer US dollar should support US company earnings, but tit-for-tat tariffs from the rest of the world could well eat into that margin. Nvidia, for example, fell 2% yesterday in a relatively calm session on news that China’s Huawei Technologies will test a new chip to replace its Nvidia chips.
100 days of chaos.
Today is Trump’s 100th day in office, and he will go down in history as the President who triggered the most unnecessary trade war in history. US consumer sentiment fell to one of the lowest reads on record, and long-term inflation expectations spiked to the highest since 1991. The US economy has certainly taken an unnecessary hit from tariff uncertainty, as GDP is expected to have dropped from 2.4% to 0.4% in just three months... The stock markets print their worst 100 days of a President since 1974 while the US dollar is losing its safe haven and reserve demand. Oh well...
Buy more Gold?
The dollar’s misery makes gold shine stronger than ever. The price of an ounce posted lower highs in the past three sessions, but not necessarily lower lows. Price dips could still be interesting opportunities to buy gold as risks persist, and central banks keep buying. But for those who missed the gold rally, silver — which lags behind by historical means — could be an interesting option, on expectation that the mint ratio would decline toward the 80/90 range without a significant downside correction in gold prices. Another interesting play for those who missed the gold rally is gold miners. The latter are seen as a "leveraged bet" on gold, as higher gold prices boost revenues, profits, and investor enthusiasm, leading to higher miner share prices — often by a larger multiple.
Gold, for example, rose around 42% between August last year and April this year, while Fresnillo rose more than 100% during the same period.
And for gold, the bulls remain strongly bullish based on the fact that the factors that pushed gold prices higher — the trade and geopolitical tensions, central bank and retail buying — remain intact. Some point that the latest gold rally — of just 40% — is far from 1979’s 120% rally.
Important Data Releases and Carney’s Liberals Win Canadian Election
In focus today
From the US, both JOLTs labour turnover report for March as well as the Conference Board's April consumer confidence survey are due for release. The job openings data from the former is a key labour demand indicator for the Fed. The still stable number of daily job postings suggests that the level has likely remained relatively steady despite the tariff uncertainty.
In the euro area, focus turns to the Spanish inflation data for April, which we receive ahead of the euro area print on Friday. On Friday, we expect euro area HICP inflation to tick down to 2.1% y/y in April from 2.2% y/y in March.
Also in the euro area, we keep an eye on data on credit growth and business confidence indicators. The business confidence indicators cover the month of April, so they will likely reflect the impact of the US tariffs, which will be interesting to follow.
In China, we will receive manufacturing PMIs from both NBS as well as Caixin (private version) overnight. In line with consensus, we expect to see a decline in both indexes as effects from the trade war feeds through. The Emerging Industries PMI for April was released last week and showed a big drop from 59.6 to 49.4.
In Sweden, a bunch of interesting macro data is being released today. At 08.00 CET we will receive data on retail sales and household lending (both March), but the full GDP indicator for Q1 will also hit the wires. As the GDP indicator is notoriously volatile, we prefer NIER's Economic Tendency Indicator when it comes to forecasting Swedish growth, and we are lucky enough to see the April ETI released today at 09.00 CET. A continued decline in the ETI could well suggest a potential slowdown in GDP growth and is worth watching. Furthermore, the broader survey will provide valuable insights into households and firms' economic outlook, including firms' price plans.
In Norway, retail sales figures will be published today, but these are for March and will capture neither effects from the global turmoil nor the signals of less rate cuts sent by Norges Bank at its meeting in March. We still believe that retail sales growth slowed to 0.1% m/m in March, but the timing of Easter always makes the figures for March and April a bit uncertain.
Economic and market news
What happened overnight
In the Canadian election, Canadian PM Mark Carney's Liberals retained power. At the time of writing, parliamentary majority hangs in the balance, with the Liberals not yet having won enough seats to form a majority government. Trump's tariffs and annexation threats boosted Carney's patriotic support despite Conservative efforts focusing on cost of living and crime. Carney ran Canada's central bank during the 2008 financial crisis, and the Bank of England during Brexit, claiming he can use this experience as preparation for handling the economic turmoil caused by Trump. The result marked a recovery for the Liberals who were on track to lose power until the resignation of former PM Justin Trudeau helped consolidate left-of-centre votes.
What happened yesterday
In Denmark, retail sales in March surprised to the downside, coming in at 0.1% lower than in February (SA), mainly due to a 0.8% drop in sales of food and other everyday commodities. Clothing sales increased by 2.7%, while other consumer goods remained unchanged. Overall, retail sales in the first quarter of 2025 were 0.7% higher than in the fourth quarter of 2024.
In Sweden, the producer price index declined in March (-3,0% m/m and -0,3% y/y), marking a decrease for two consecutive months and supporting lower inflation expectations. This is good news for the Riksbank, and we will receive more information today with the release of the tendency indicator from NIER, which contains firms' pricing plans.
In Norway, the unemployment rate increased from 3.8 % to 4.4 % in March. These figures are volatile on a monthly basis, illustrated by the fact that the trend adjusted data was unchanged at 4.1%. And as always, we prefer the more updated unemployment data from the NAV, where we saw no weakness in March, and April figures are due on Friday.
In geopolitics, Russian President Vladimir Putin announced a three-day ceasefire from 8-10 May to commemorate the 80th anniversary of World War Two victory, inviting international leaders, including Xi Jinping, to celebrations. Ukraine criticised the truce, demanding immediate action and a lasting ceasefire, stating that a ceasefire should be "real, not just for a parade." In response to Putin's statement, the White House welcomed efforts to pause the conflict but emphasised that President Trump seeks a permanent ceasefire, not a temporary one, between Russia and Ukraine. Thus far, Russia has repeatedly violated the ceasefires it has imposed.
Equities: It was about time we had a dull session in equities! US equities were close to unchanged yesterday (with some intraday volatility). Europe outperformed, with Stoxx 600 up 0.5%. This was not a "buy the dip" session (needless to say, as most of the dip is gone). Investors did, however, take notice of the lower bond yields, sending yield-sensitive defensives higher (real estate, utilities, healthcare). It was not all hunky-dory: VIX broke the downward trajectory and stalled around 25. Perhaps VIX will not drop below 20 until we have more clarity on tariffs. If so, positioning support from risk parity funds will have to wait.
FI & FX: It was a relatively quiet start to the week, with US Treasury yields continuing to drift lower, following the trend from last week. The 2Y US Treasury yield declined by 6bp, the 10Y yield fell by 3bp, and the 30Y yield was down by 2bp, resulting in a modest steepening of the US yield curve. In contrast, yields in Europe were slightly firmer, with both 2Y and 10Y German government bond yields rising by 1bp. EUR/USD remains stable in the 1.13-1.14 range. Early this morning, Canada's Liberal Party secured a fourth consecutive term, with Carney elected Prime Minister, as widely expected. In the near term, we expect USD/CAD to tick down to 1.37, given stretched short CAD positioning. NOK FX did remarkably well during the latter part of yesterday's session.