Sample Category Title
Canadian Employment To Bounce Back In September, Could Seal October Rate Hike
Employment numbers out of Canada, due at 12:30 GMT on Friday, will be investors’ next focus after the surprise deal over the weekend to upgrade NAFTA. With trade worries out of the way and an anticipated rebound in jobs growth in September, the Canadian dollar is set to extend its bullish streak, as expectations rise that the Bank of Canada will raise interest rates later this month.
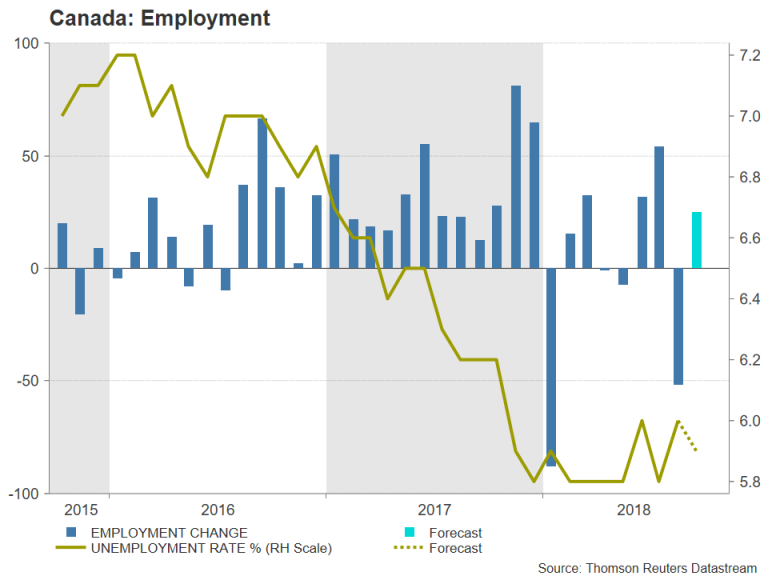
Net change in employment unexpectedly slumped in August, with 51.6k jobs being lost, though the drop was mainly attributed to a sharp slide in part-time jobs. After a strong performance in 2017, jobs growth in Canada has been patchy in 2018, with the unemployment rate flatlining at between 5.8%-6.0%. But the labour market is forecast to have improved in September, with the economy expected to have created 25k jobs. The jobless rate is forecast to ease slightly from 6.0% to 5.9%.
A positive set of figures on Friday would boost market expectations of a rate hike by the Bank of Canada at its October 24 meeting. Those odds, as implied by overnight index swaps, currently stand at 77%, indicating the market is some way off in fully pricing a rate increase. The Canadian dollar therefore could be poised to rally significantly should those odds start to move closer to 100%.
One major hurdle for further BoC rate hikes was cleared at the start of the week with the conclusion of the NAFTA renegotiation. The United States and Canada managed to strike a last-minute deal late on Sunday, hours before the US-imposed deadline of October 1, ending months of uncertainty about the future of NAFTA, which will now be renamed to USMCA (the United States-Mexico-Canada Agreement).
Having soared to a 4-month high of C$1.2778 per US dollar on Monday, the loonie’s next target could be 1.2721, which is the 50% Fibonacci retracement of the upleg from 1.2057 to 1.3385. A break below this level for dollar/loonie would underscore the bearish medium-term structure for the pair, which has been making lower highs and lower lows since July. Below this mark, the 61.8% Fibonacci of 1.2564 should be watched, which is not too far from the April trough of 1.2522. Further down, the February low of 1.2445 is the next key support level.
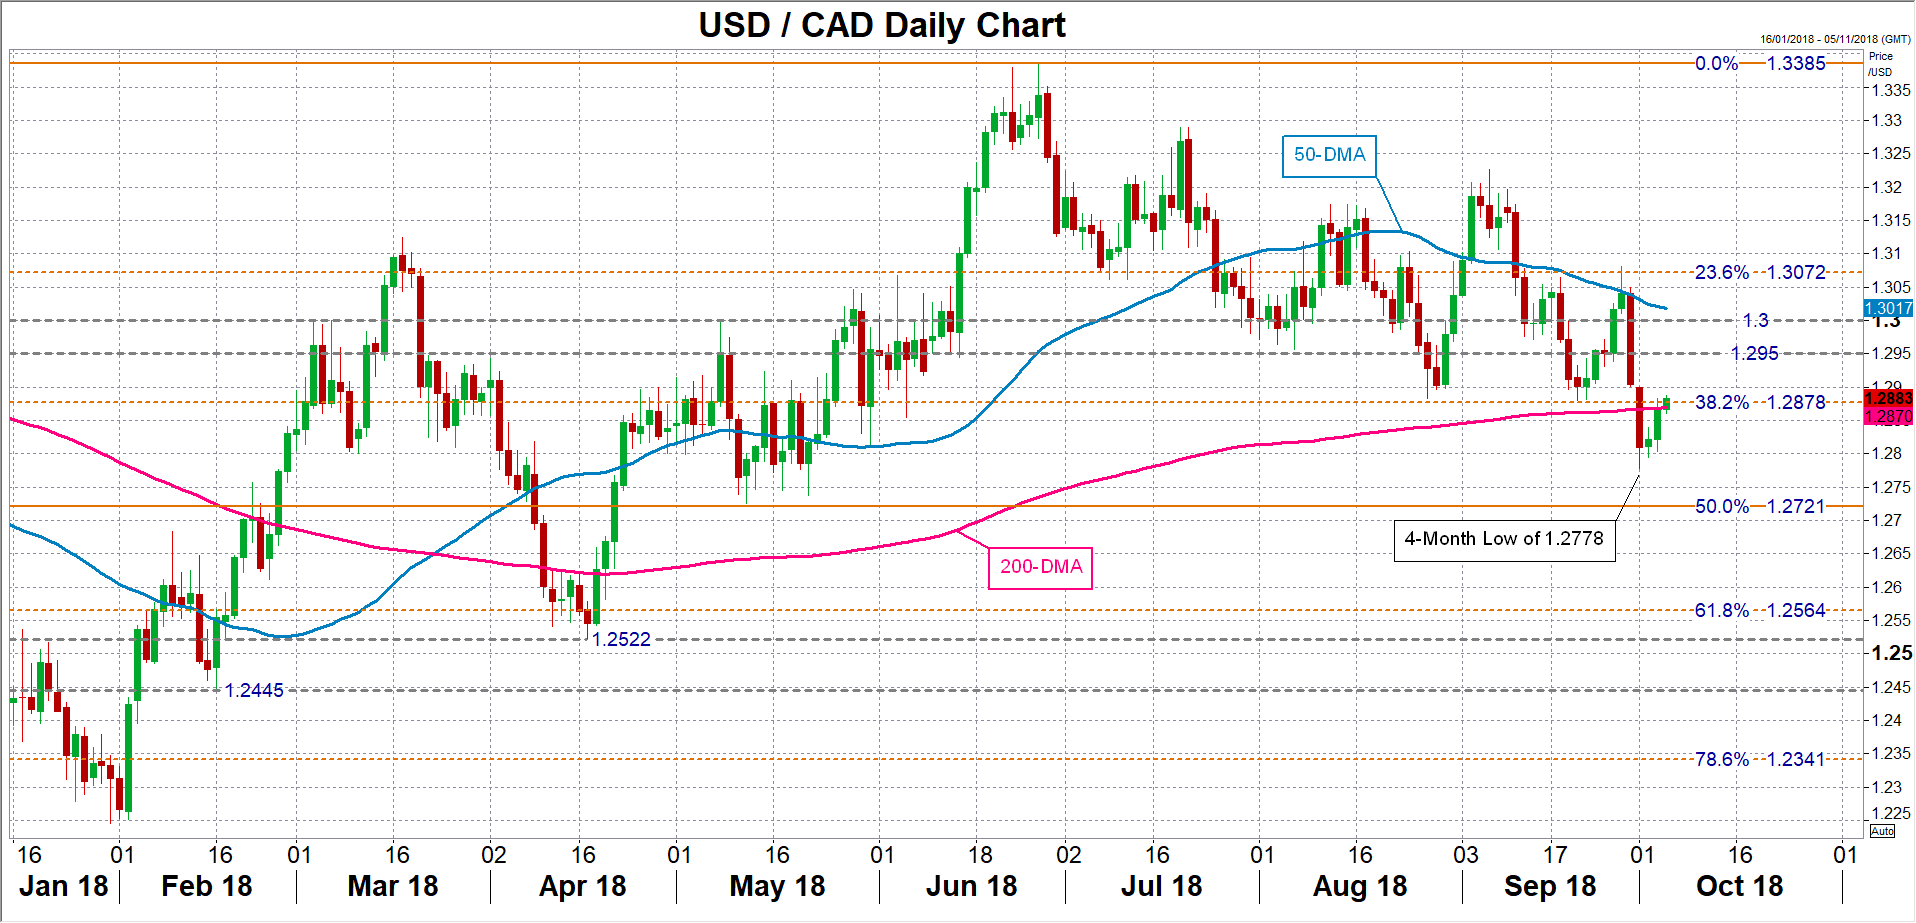
In the event, however, of a worse-than-expected reading on Friday, the loonie could fall victim to some profit taking, though the losses would likely be limited as weak job figures alone would probably not be enough to prevent the BoC from raising rates given the recent uptick in inflation. Dollar/loonie could initially eye the 38.2% Fibonacci level at 1.2878 if there is an upside reversal. Moving higher, resistance could be met at 1.2950, a recent congested region. A climb above this level would set the path towards the 1.30 handle and bring into range the 23.6% Fibonacci retracement of 1.3072.
US Jobs Data Unlikely A Game Changer, Still Likely To Generate Short-Term Volatility
The US jobs report for September due on Friday at 1230 GMT is undoubtedly the week’s data highlight. Despite the prominence of the release and barring a significant deviation from expectations, the numbers are unlikely to alter the US central bank’s monetary policy outlook. Still, some near-term volatility in dollar pairs is likely to emerge as the relevant prints are made public.
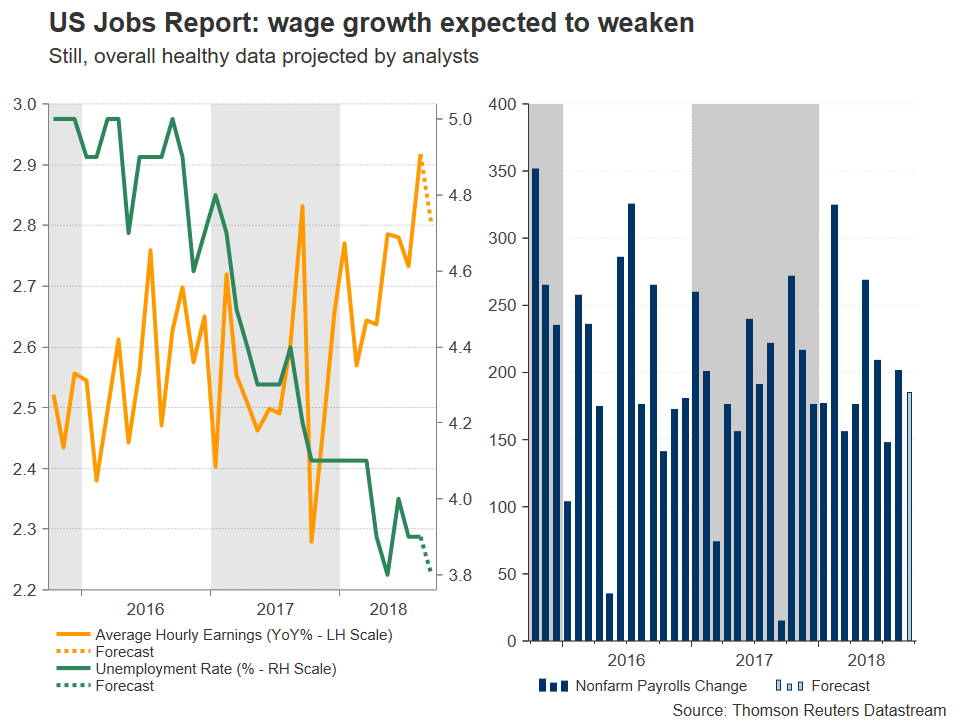
According to forecasts, the US economy added 185k positions in September, below August’s 201k but nevertheless a healthy figure. The unemployment rate is predicted to tick down to 3.8%, a number also recorded in May of the current year and which would match a low last tracked in April 2000. Turning to wage growth which continues to attract most lights, average earnings are anticipated to have grown by 0.3% m/m, below August’s 0.4%. This would put the annual rate of expansion in earnings at 2.8%, weaker than August’s 2.9% that constituted the biggest annual gain for the measure in more than nine years. Overall, despite the projected easing in job creation and salaries growth, the readings are anticipated to come in at relatively robust levels.
Excluding a shock in the figures, the Federal Reserve's rate hike guidance, which projects another 25bps rate increase by year-end, is unlikely to be altered in a meaningful manner by Friday's release; market participants currently assign a 78% probability for a December hike. Still, better-than-expected data, especially on the wage front which can act as an inflation driver, can push those odds closer to a done deal, consequently supporting the US currency, while worse-than-expected figures could bring down the probability of another hike this year. For the record, August's core PCE price index – this being the Fed's preferred inflation gauge – released last week, remained at the Bank's 2.0% annual target.
In FX markets, a data beat is expected to lead to a stronger USDJPY. Immediate resistance to gains may take place around 114.54, the freshly hit 11-month high. Given an upside violation, the focus would shift to the 115 round figure, with the 116 handle increasingly come into scope further above. On the downside and in case of weaker-than-forecasted prints, support could emerge around 113.16, this being a previous peak. Further below, another top from the recent past at 111.82 and the current level of the 50-day moving average line at 111.69 would be eyed. Upbeat releases out of the US as of late, including a better-than-expected ADP employment report on the number of positions added to the economy by the private sector, may render a beat in the numbers more likely.
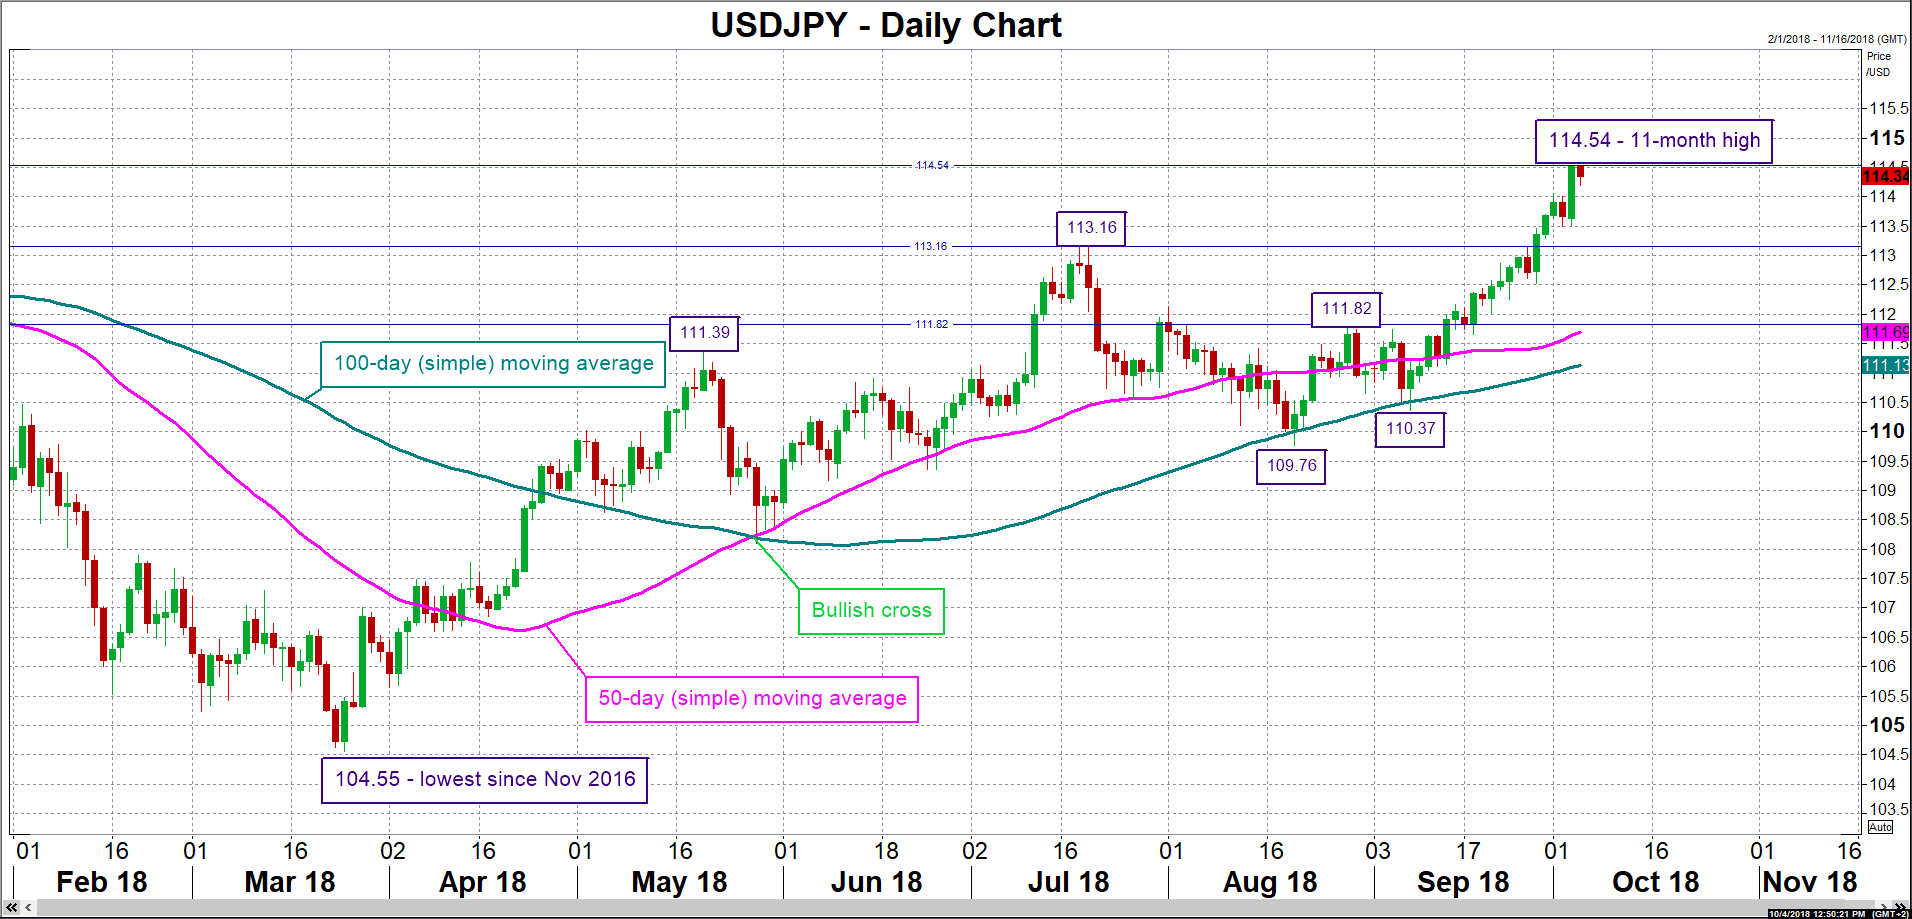
For perspective, dollar/yen is trading higher by 1.5% year-to-date, after losing as much as 7.2% when it touched its lowest since November 2016 of 104.55 in late March. It should be kept mind that the Japanese currency still outperforms compared to most other major currencies which are deeper in losses versus the greenback in 2018. For example, EURUSD and GBPUSD are down by 4.2% and 3.9% correspondingly during the year.
Returning back to Friday's release, the Sino-American trade skirmishes appear to have had a minimal impact on the US economy so far. It is of note, though, that manufacturing jobs exhibited negative growth in August for the first time in 13 months. It would be interesting to see if September's figures start showing a negative trend for factory jobs. Also of interest would be the extent the sector is affected from additional tariff action in the months to come.
Remaining on trade, the reading on August's trade balance out of the world's largest economy will be made public at the same time as the employment report. The relevant deficit is expected to widen to $53.5 billion from $50.1bn in July, which was the highest since February. The politically sensitive trade gap with China that rose to an all-time high in the previously reported month will be coming to the fore. Now that Trump managed to strike a North American trade deal with Canada and Mexico, his administration may turn back its sights to China. Intensifying tensions between the two economic superpowers are not to be ruled out, especially in light of November's midterm elections in the US; an escalation in the dispute may resonate well with the Republican base. Of course, such an outcome will also have implications for currency markets, diverting funds to perceived safe havens, such as the yen and the Swiss franc.
Asia Market Close: Focus On JGB’s And CNH
Japanese Government Bonds
As the Asia session wore on, there was a greater focus on JGB moves. And while this is more about short-term noise, as I will elaborate below, it could have medium-term implications for USDJPY. With spot trading comfortably above 114, and the 10y JGB yield is around 0.15% – the highest since February 2017. Traders know that the BoJ can come in anytime but then again, the weaker JPY may provide them with the opportunity let the yield curve control mechanism to widen a touch keeping in mind the did say during summer it would allow the 10y yield to deviate by as much as 0.2pp around zero.
The Japanese Yen
My base case scenario on USDJPY is that over the next 3-6 months the BoJ will jiggle policy and it could happen as early as December in conjunction with a Fed hike. Kuroda and company have been floating trial balloons the past three months trying not only gauge market sentiment put prepare Japanese exporter for the inevitable and indeed with USDJPY in and around 115 + level it would give them some leeway to raise interest rates. But one of the pluses for the BoJ is that the Yen has lost its safe appeal so its more or less a differential trade. They want to change policy believing that JPY will not strengthen excessively but desperately want to help the banking sector and improve the monetary transmission mechanism channels to allow the banks to raise the cost of borrowing and make some money after a decade of struggling. I think this is the primary reason why USDJPY is not trading + 116 as traders sense that something is afoot.
The Rest of Asia: Oil and USDCNH driving the bus
As for the rest of the Asia space, markets took out some topside ranges as US yields were a significant focus with US 10-year yields driving bullish USD sentiment, while the weakest links in the chain IDR -INR were getting the double whammy for US rates and Oil. The rest of the basket was influenced by USDCNH breaking fundamental 6.90 level with follow through to 6.9160 level. Fearing state bank offer may to the market and not wanting to trigger a heavy-handed reaction from the Pboc after Golden Week, markets pulled back. But liquidity thin, and it didn't take much volume to test +6.91 nor for the market to sell off to 6.89, so take everything today with a pinch of salt.
Special Report: Insights About US- NFP Data
What will the data look like on Friday and most importantly how will it influence the market?
The US-Non-Farm Payroll data is the most powerful number among the economic data and certainly has the ability to move the market in either direction. Fed watchers pay close attention to this number and this number serves as one of the most important pillar for the Fed's economic policy. So far there has been one clear trend from the Fed which is that the Fed has repeatedly lauded the economic data and called it "remarkably positive".
So, the question that we ask ourselves is: what will the data look like on Friday and most importantly how will it influence the market?
Before I get into the nitty-gritty of the payroll numbers, it is critical to talk about the current state of the dollar index. If we measure the strength against the basket of G-10 currencies, it confirms one fact- the dollar is much stronger currency in 2018. Why is this? Thanks to the Federal Reserve's hawkish monetary policy. The Fed has increased the interest rate three times this year which brought strength for the dollar.
The intriguing element is that the Fed is not done yet, there is still more to come. The reason for this is that the economic indicators are still rock-solid and there is no reason for the Fed to back down.
This message was echoed in the Fed Chairman’s latest comment. Jerome Powell, who is the Fed Chairman, stated yesterday “the Fed needs to adopt the policies according to the country’s economic health. The U.S. is no longer in the financial crisis malaise, it is time to bring the interest rate towards their neutral level”.
This indicated two elements: first, the Fed doesn’t think that they have achieved the neutral interest rate level despite the fact that we have experienced three rate hikes this year. In other words, more rate hikes are on the way. Second, comments like this show that the Fed is confident about the economy. His statement “There’s really no reason to think that this cycle can’t continue for quite some time, effectively indefinitely,” is remarkably hawkish.
If we dive further into his comments yesterday and try to dissect the neutrality part, it makes affairs even more arduous. The question which comes to mind is that what is the neutral level? Several officials have talked about this critical issue and I think the neutral level for the Fed is 3.4%. The projections released last week shows that the interest could move towards the 2-2.25% but it is highly likely that the Fed may not pause their game anytime soon until they reach the level of 3.4%.
The fact is that the US weekly jobless claims data has dropped to the lowest level since 1969. According to the ADP research institute, American business added the most workers in seven months and this is all in the midst of the so-called- trade war. So, the only number which can make the Fed leavened their rosy remarks on the economy further will be the US-NFP number.
In simple words, the expectations for the US NFP number are sky high. The expectations are for 185K but the speculators are hoping for a number above 200K. But, the two most important number that traders will be looking at are the average hourly earnings number and the underemployment number, this is an indicator which represents the people who have given up looking for a job or in other words slack in the labour market. We know that Jerome Powell has already said that he pays special attention to the average hourly earnings number. The expectation for the average hourly earnings m/m is 0.5% while the previous reading was at 0.4%. The underemployment number printed a reading of 7.4% and if this number comes at 7.1%, it will be immensely positive for the dollar.
The key takeaway from this is that, expectations are sky high and there are higher odds for disappointment and this calls for action; adjust your risk to reward ratio.
Technical Analysis: Euro Could Move Closer To 1.1435
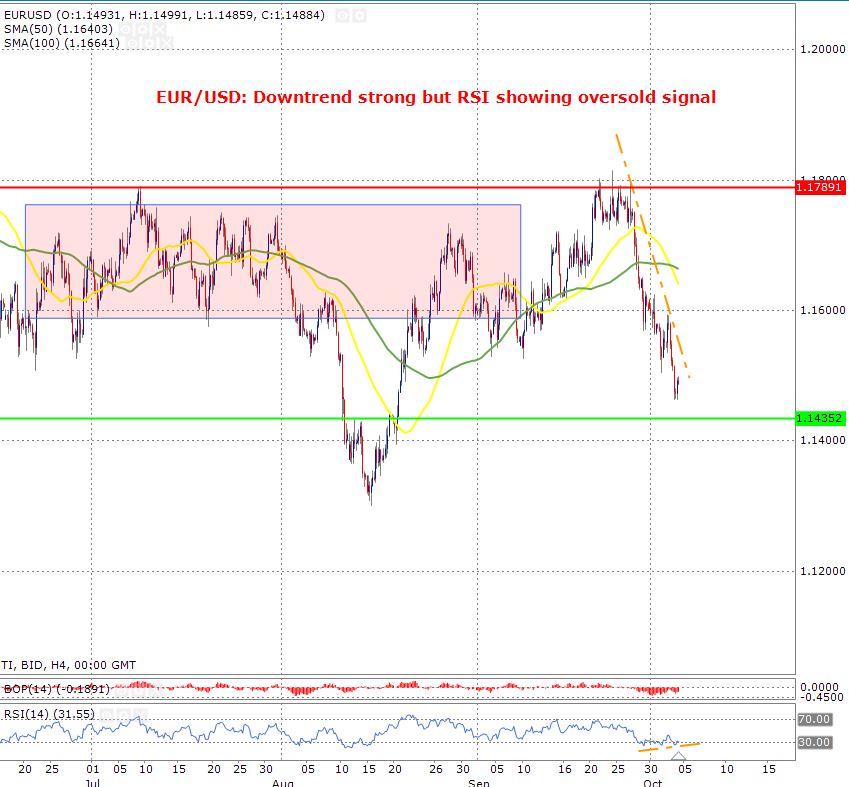
EUR-USD pair showin strong downward trend but the RSI has an important signal
The EUR-USD pair is firmly trading below the downward trend line (showin in orange) on a 4-hour time frame. The pace of drop and the angle of the current trend is particularly interesting. It shows that the bears are in full control of the price. The price tried to break above the downward trend but it failed miserably. The round circle on the char shows this point. Moreover, the price is also trading below the 50 and 100-day moving averages (50day shown in yellow and 100-day shown in green) which further confirms the above argument that the bears are in full control of the price.
Having said this, it is important to pay attention to what the Balance of the Power and the Relative Strength index are showing. Both of them have one element in common, the price is way oversold and this could attract some buyers. A level below 30 for the RSI index represents an oversold zone and a level above 70 shows over zone. There is a trend line on the balance of power, if the BOP breaks this trend line, it will be confirmation that the bears are picking up further momentum
The support line is shown in light green colour and the support is at 1.1435 and the resistance line is shown in red and it is at 1.1789
IMF: Japan needs reinvigorated policies for reflation, growth and sustainable debt path
IMF said in a report that while Japanese economy continues to "grow above potential", downside risks have increased. It urged that "reinvigorated policies are needed to reflate the economy, boost potential growth, and put public debt on a sustainable path." And, coordinated effort should include (i) a well-specified medium-term fiscal framework; (ii) an ambitious effort toward labor, product market, and corporate reforms; and (iii) a continued accommodative monetary policy accompanied by clear forward guidance.
On monetary policy, IMF hailed that "BoJ's recent emphasis on making the accommodative stance more sustainable is appropriate, and complements its shift to a more patient approach to reaching the inflation target." However, IMF suggested that "the relationship between the forward guidance on the long-term interest rate target and the inflation target could be clarified and the quantitative guidance on JGB purchases could be removed." Also, it suggested BoJ to publish staff baseline forecasts together with underlying policy assumptions to strengthen market communications.
On trade, IMF emphasized that "Continued advancement of multilateralism and bolder domestic policies are needed to mitigate inward spillovers, including from potential trade-war escalation." Though, Japan's leadership in furthering multilateralism can help mitigate the possible effects of trade-war escalation.
The Analytical Overview Of The Main Currency Pairs
The EUR/USD currency pair
Technical indicators of the currency pair:
Prev Open: 1.15457
Open: 1.14732
% chg. over the last day: -0.61
Day's range: 1.14634 – 1.14909
52 wk range: 1.0571 – 1.2557
Negative dynamics is still observed on the EUR/USD currency pair. Yesterday, the drop in quotes exceeded 70 points. The trading instrument updated local lows. The American currency was supported by positive economic reports from the USA. At the moment, the EUR/USD currency pair is consolidating near the local support of 1.14650. The mark of 1.15150 is already a “mirror” resistance. The EUR/USD quotes are tending to further decline. Positions must be opened from the key levels.
Today the news feed is rather calm:
The number of initial jobless claims in the US at 15:30 (GMT+3:00);
Factory orders in the US at 17:00 (GMT+3:00).
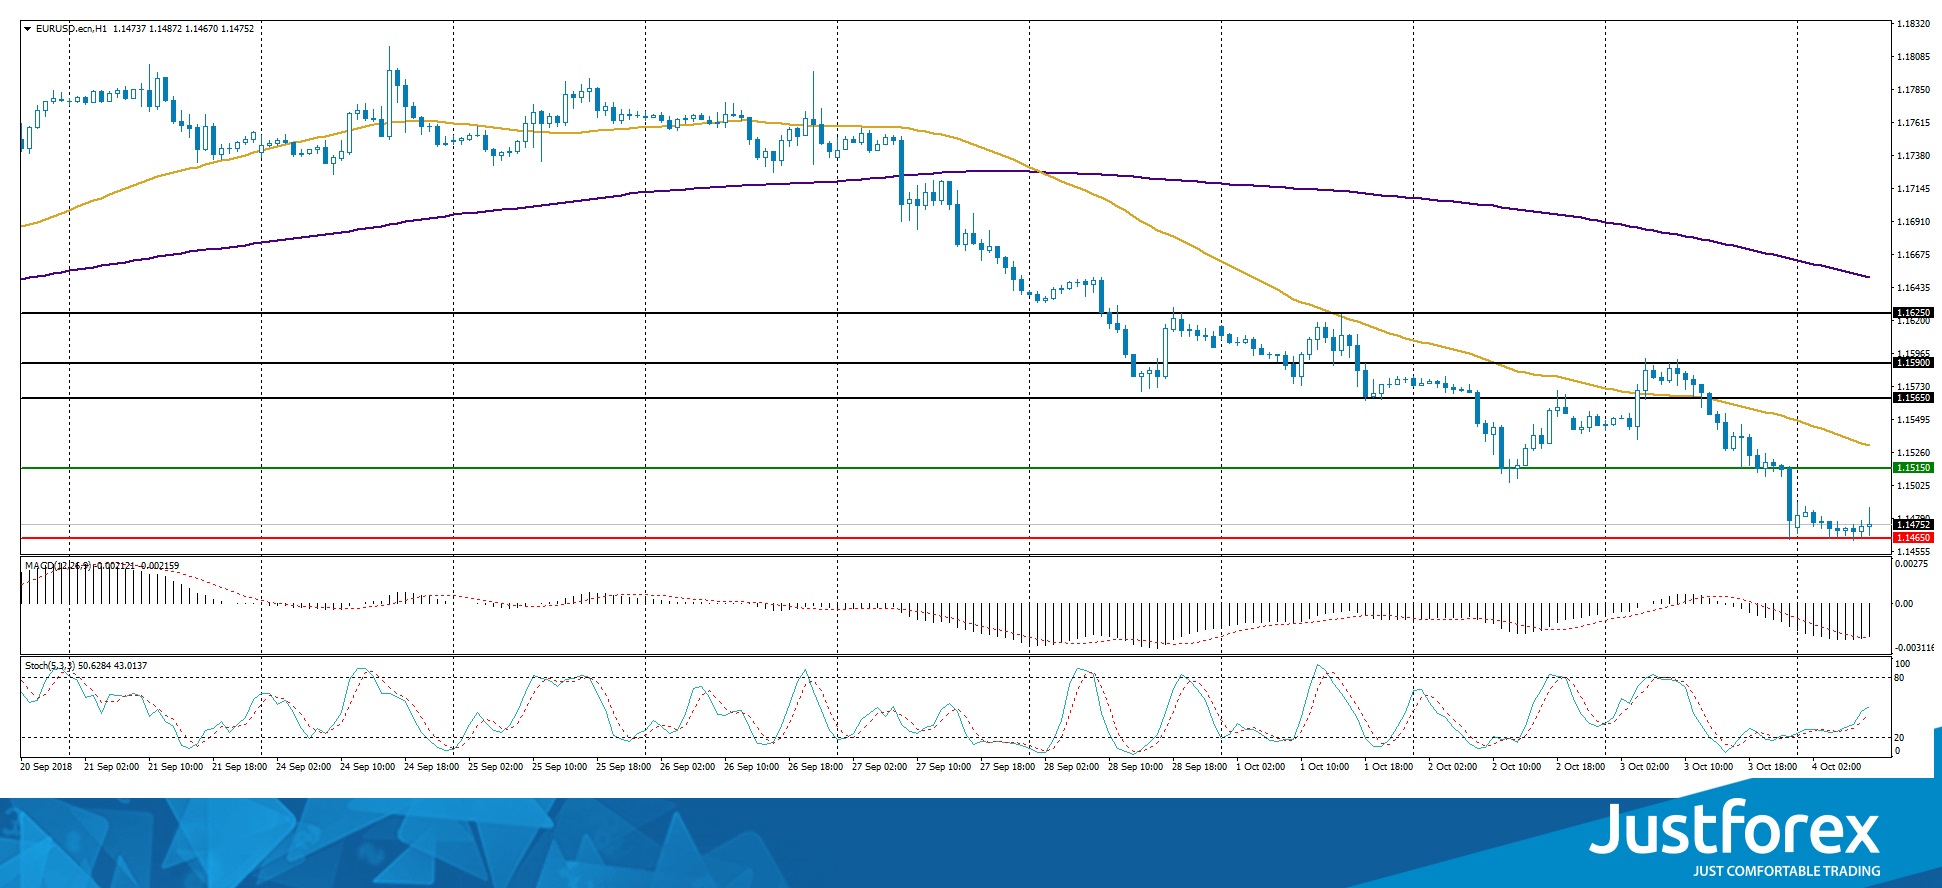
The price has fixed below 50 MA and 200 MA, which indicates the power of the sellers.
The MACD histogram is in the negative zone, which indicates the bearish sentiment.
Stochastic Oscillator is in the neutral zone, the %K line is above the %D line, which gives a signal to buy EUR/USD.
Trading recommendations
Support levels: 1.14650, 1.14250, 1.14000
Resistance levels: 1.15150, 1.15650, 1.15900
If the price consolidates below the local support of 1.14650, a further drop in the EUR/USD quotes is expected. The movement is tending to 1.14250-1.14000.
An alternative could be the growth of the EUR/USD currency pair to the level of 1.15300-1.15600.
The GBP/USD currency pair
Technical indicators of the currency pair:
Prev Open: 1.29770
Open: 1.29363
% chg. over the last day: -0.30
Day's range: 1.29219 – 1.29613
52 wk range: 1.2361 – 1.4345
The bearish sentiment prevails on the GBP/USD currency pair. Pressure on the pound is pout by weak data on economic activity in the UK. At the moment, the GBP/USD quotes are testing the local demand zone of 1.29250-1.29400. The nearest resistance is at 1.29750. Trading instrument is tending to further decline. We recommend opening positions from the key levels.
Today, the news feed on the UK economy is calm.
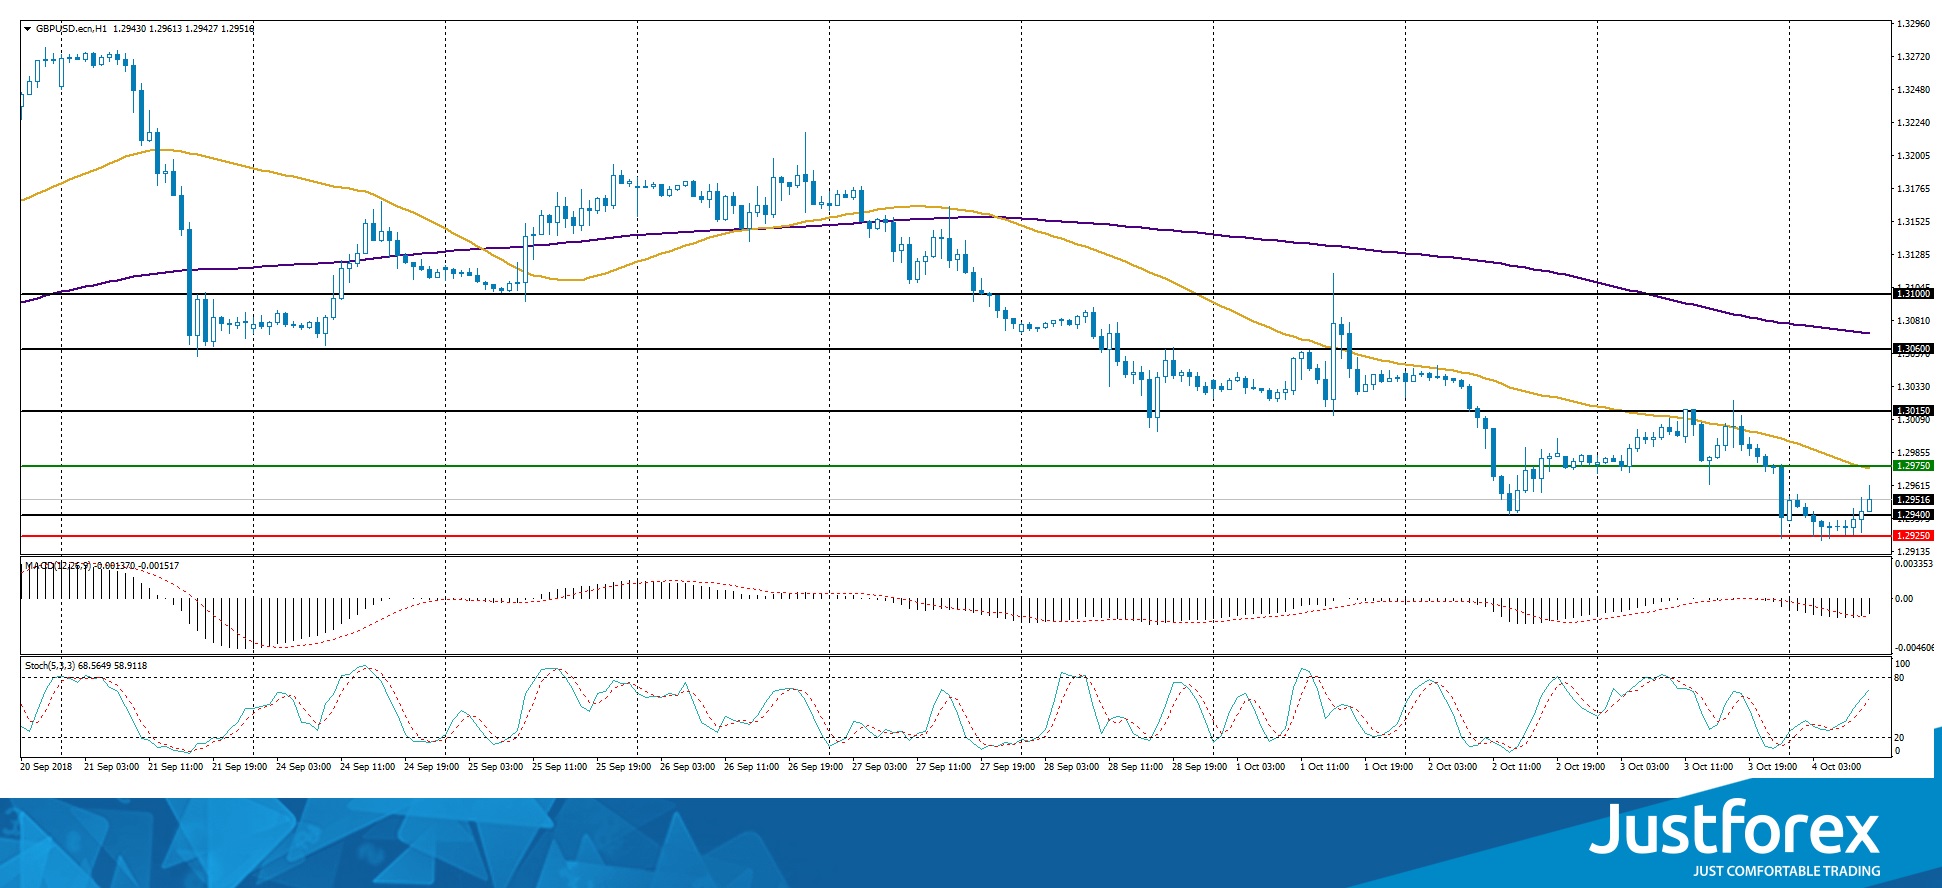
The price has fixed below 50 MA and 200 MA, which indicates the bearish sentiment.
The MACD histogram is in the negative zone, but above the signal line, which gives a weak signal to sell GBP/USD.
The Stochastic Oscillator is in the neutral zone, the %K line is above the %D line, which indicates that GBP/USD is rising.
Trading recommendations
Support levels: 1.29250, 1.29000
Resistance levels: 1.29750, 1.30150, 1.30600
If the price fixes below 1.29250, a further drop in the GBP/USD quotes is expected. The movement is tending to 1.29000-1.28750.
An alternative could be the growth of the GBP/USD currency pair to the level of 1.30000-1.30250.
The USD/CAD currency pair
Technical indicators of the currency pair:
Prev Open: 1.28233
Open: 1.28656
% chg. over the last day: +0.45
Day's range: 1.28615 – 1.28880
52 wk range: 1.2059 – 1.3795
The USD/CAD currency pair has started to recover after a sharp fall in late September. At the moment, the quotes are consolidating. The key trading range is 1.28600-1.29000. Demand for US currency remains high. In the near future, we do not rule out further correction of the USD/CAD currency pair. We recommend opening positions from the key levels.
At 17:00 (GMT+3:00) the economic activity index in Canada from Ivey will be published.
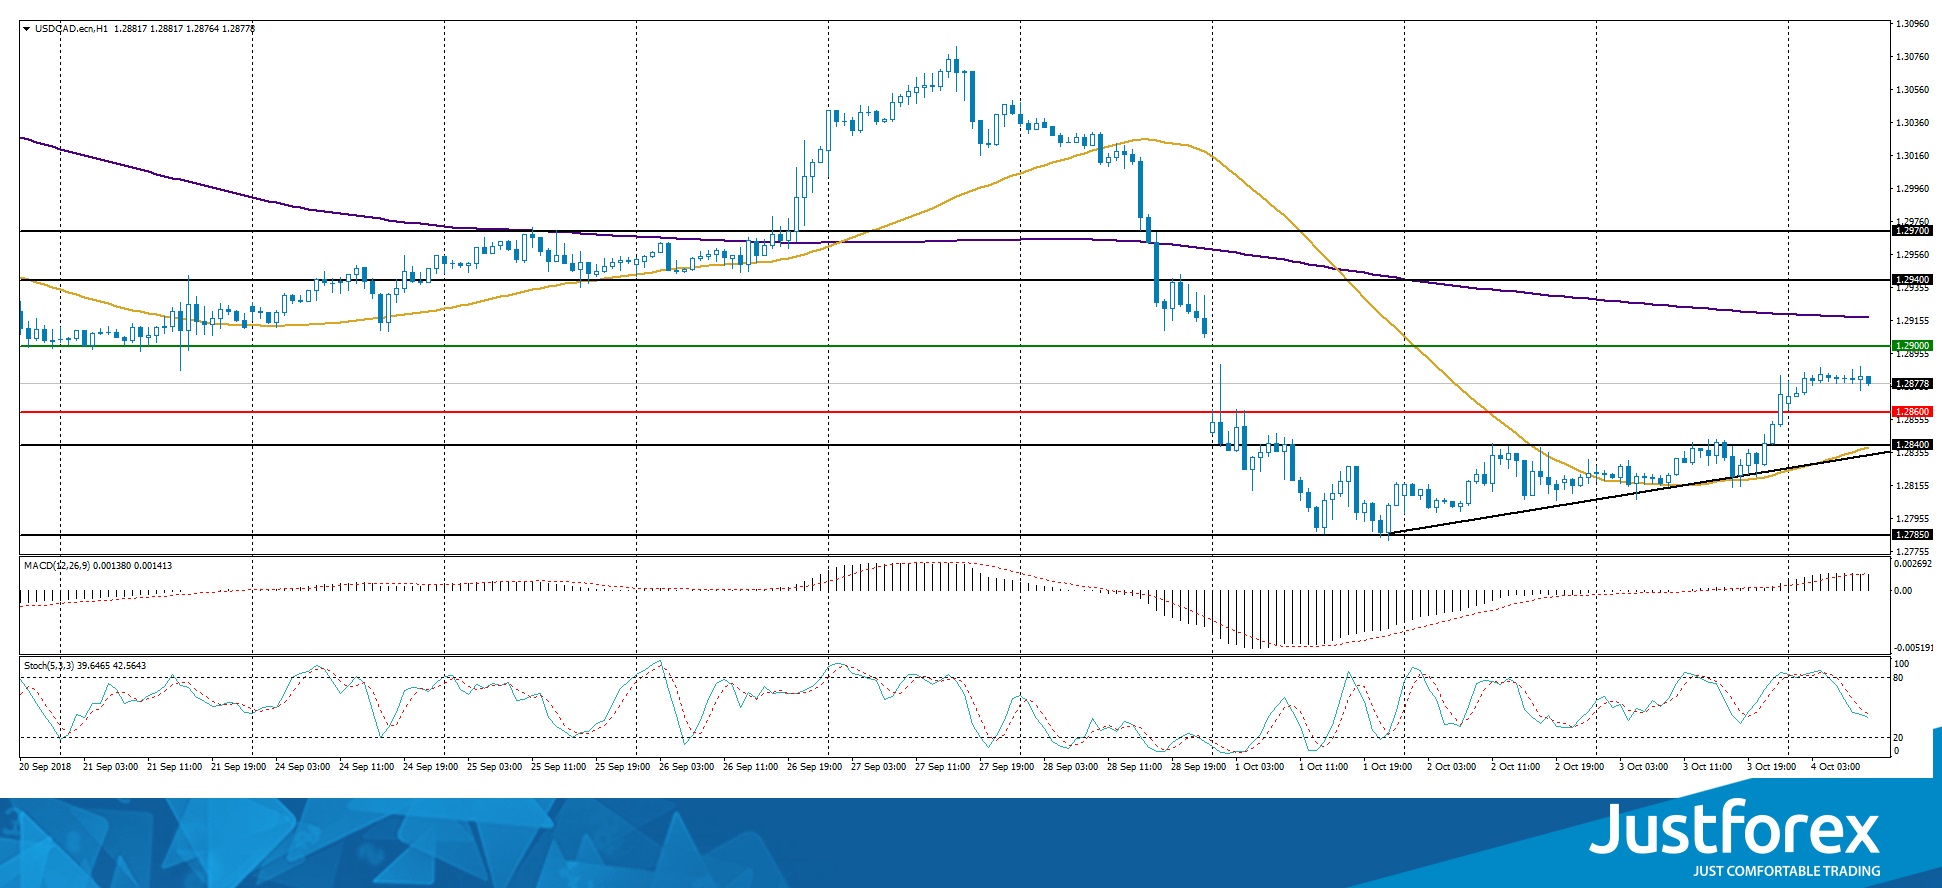
Indicators do not give accurate signals: the price has fixed between 50 MA and 200 MA.
The MACD histogram is in the positive zone and continues to rise, which indicates the growth of the USD/CAD quotes.
Stochastic Oscillator is in the neutral zone, the %K line is below %D line, which sends a signal to sell USD/CAD.
Trading recommendations
Support levels: 1.28600, 1.28400, 1.28000
Resistance levels: 1.29000, 1.29400, 1.29700
If the price is consolidating above the round level of 1.29000, a further correction of the USD/CAD currency pair is expected. The movement is tending to 1.29400-1.29700.
Alternative option. If the price fixes below 1.28600, you need to consider selling USD/CAD. The movement is tending to 1.28300-1.28000.
The USD/JPY currency pair
Technical indicators of the currency pair:
Prev Open: 113.632
Open: 114.503
% chg. over the last day: +0.74
Day's range: 114.217 – 114.549
52 wk range: 104.56 – 114.74
There is a pronounced uptrend on the USD/JPY currency pair. Yesterday, the growth of quotations exceeded 80 points. The trading instrument overcame and fixed above the key mark of 114.000. At the moment, the USD/JPY currency pair is consolidating in the range of 114.200-114.500. We do not exclude further growth of the USD/JPY quotes. We recommend paying attention to the yield of US government bonds.
The news feed on the Japan's economy is calm.
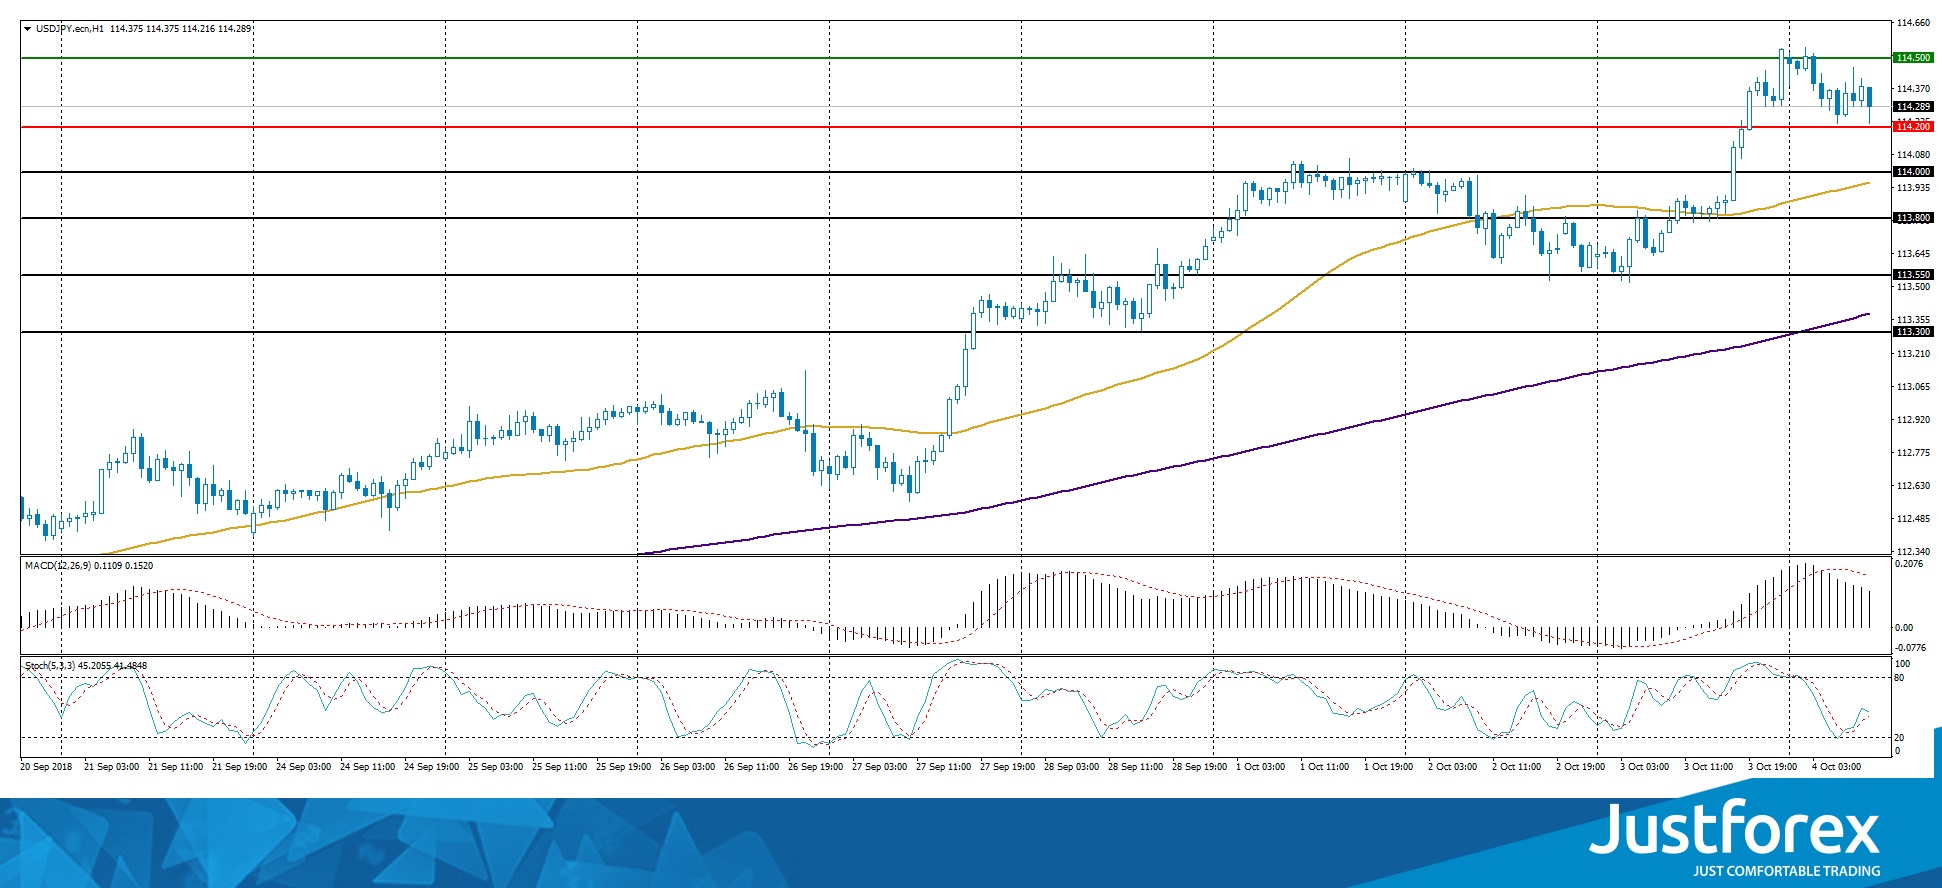
The price has fixed above 50 MA and 200 MA, which indicates the power of buyers.
The MACD histogram is located in the positive zone, but below the signal line, which gives a weak signal to buy USD/JPY.
Stochastic Oscillator is in the neutral zone, the %K line has started to cross the %D line. There are no signals at the moment.
Trading recommendations
Support levels: 114.200, 114.000, 113.800
Resistance levels: 114.500, 115.000
If the price fixes above the resistance level of 114.500, further growth of the USD/JPY quotes is expected. The movement is tending to the round level of 115.000.
An alternative may be the correction of the USD/JPY currency pair to the level of 114.000-113.800.
The 10-Year US Government Bonds Yield Has Updated A Maximum In 7 Years
The US dollar strengthened against a basket of major currencies during yesterday's trading session. The US dollar index (#DX) closed in the positive zone (+0.28%). The American currency was supported by a record increase in the 10-year US government bonds yield. Yesterday, the indicator rose by 3 basis points and exceeded 3.2% for the first time since 2011.
Positive economic statistics from the United States provided additional support for the US currency. According to ADP, the number of people employed in the nonfarm sector rose to 230K in September, while experts expected 187K. The ISM non-manufacturing employment index grew from 58.5 to 61.6 in September. Also, the positive statements by the Fed representatives contributed to the increase in the 10-year US government bonds yield. Chicago Fed President Charles Evans said that the US economy reached such growth rates that the Fed would be forced "to step back from the aggressive stance".
The "black gold" prices are consolidating. At the moment, futures for the WTI crude oil are testing a mark of $76.25 per barrel.
Market Indicators
Yesterday, the bullish sentiment was observed in the US stock market: #SPY (+0.05%), #DIA (+0.14%), #QQQ (+0.11%).
At the moment, the 10-year US government bonds yield is at 3.20-3.21%.
The news feed on 2018.10.04:
Initial jobless claims in the US at 15:30 (GMT+3:00);
The index of economic activity in Canada at 17:00 (GMT+3:00).
AUDUSD Plunges To 32-Month Low, Bearish But Oversold
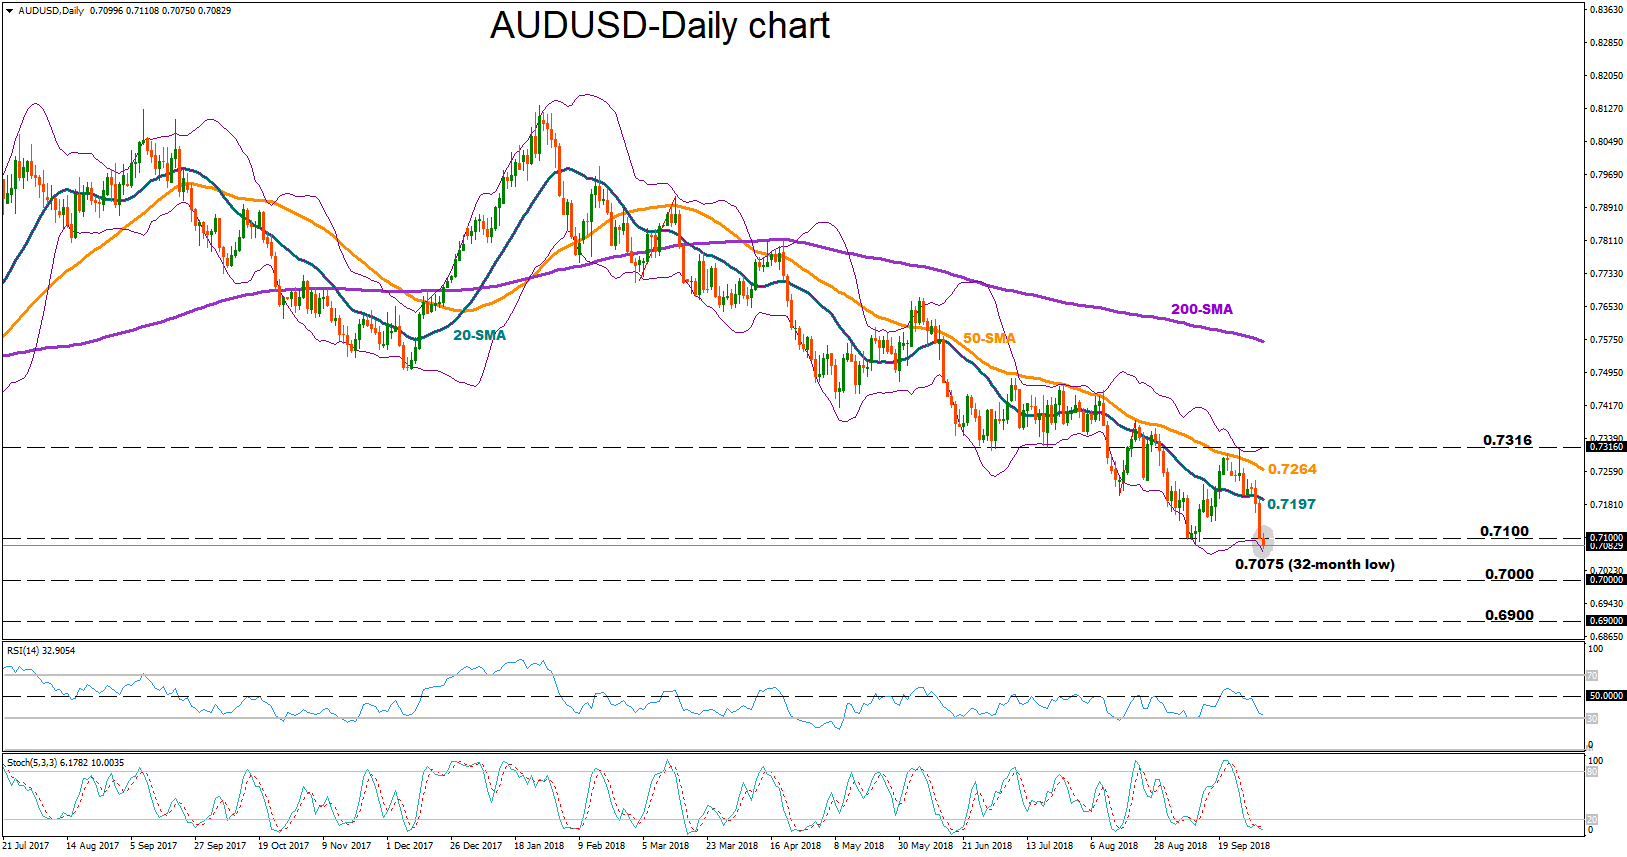
AUDUSD lost around 1.20% on Wednesday, printing its biggest daily loss since June 14. On Thursday, the bearish mood turned stronger, driving the pair towards a 32-month low of 0.7075, with the technical indicators suggesting that a rebound is around the corner. Still, bearish signals have not fully faded yet.
According to the RSI, the downfall could come to an end in the short-term as the index is set to cross below its 30 oversold threshold, a view supported by the Stochastic oscillator as well given that the green %K line is currently fluctuating around the red %D line below 20. However, looking at the candles, the market has yet to touch the lower Bollinger band, a sign that bearish forces might persist before things get better.
Additional losses could drive the price towards the 0.7000 round level, while if this support fails to hold, the next stop could be at 0.6900. Even lower, bears would try to break the 0.6826 bottom marked on January 2016.
Alternatively, if the price manages to reverse higher, immediate resistance could come at the 0.7100 psychological level before bulls eye the 20-day simple moving average around 0.7190 which is also the middle Bollinger band. Slightly higher, the 50-day MA currently around 0.7264 may halt bullish actions, while in case the price crawls above that level too, attention would turn to the upper Bollinger band at 0.7310 .
In the medium-term picture, the bearish outlook strengthened even further on Thursday after the price broke the previous low of 0.7084, resuming the long-term donwleg that started at the end of January. The negative picture could stay in place as long as the 50-day MA continues to distance itself below the 200-day MA.
USDJPY Shows Signs For Possible Retracement, Hits 11-Month Peak
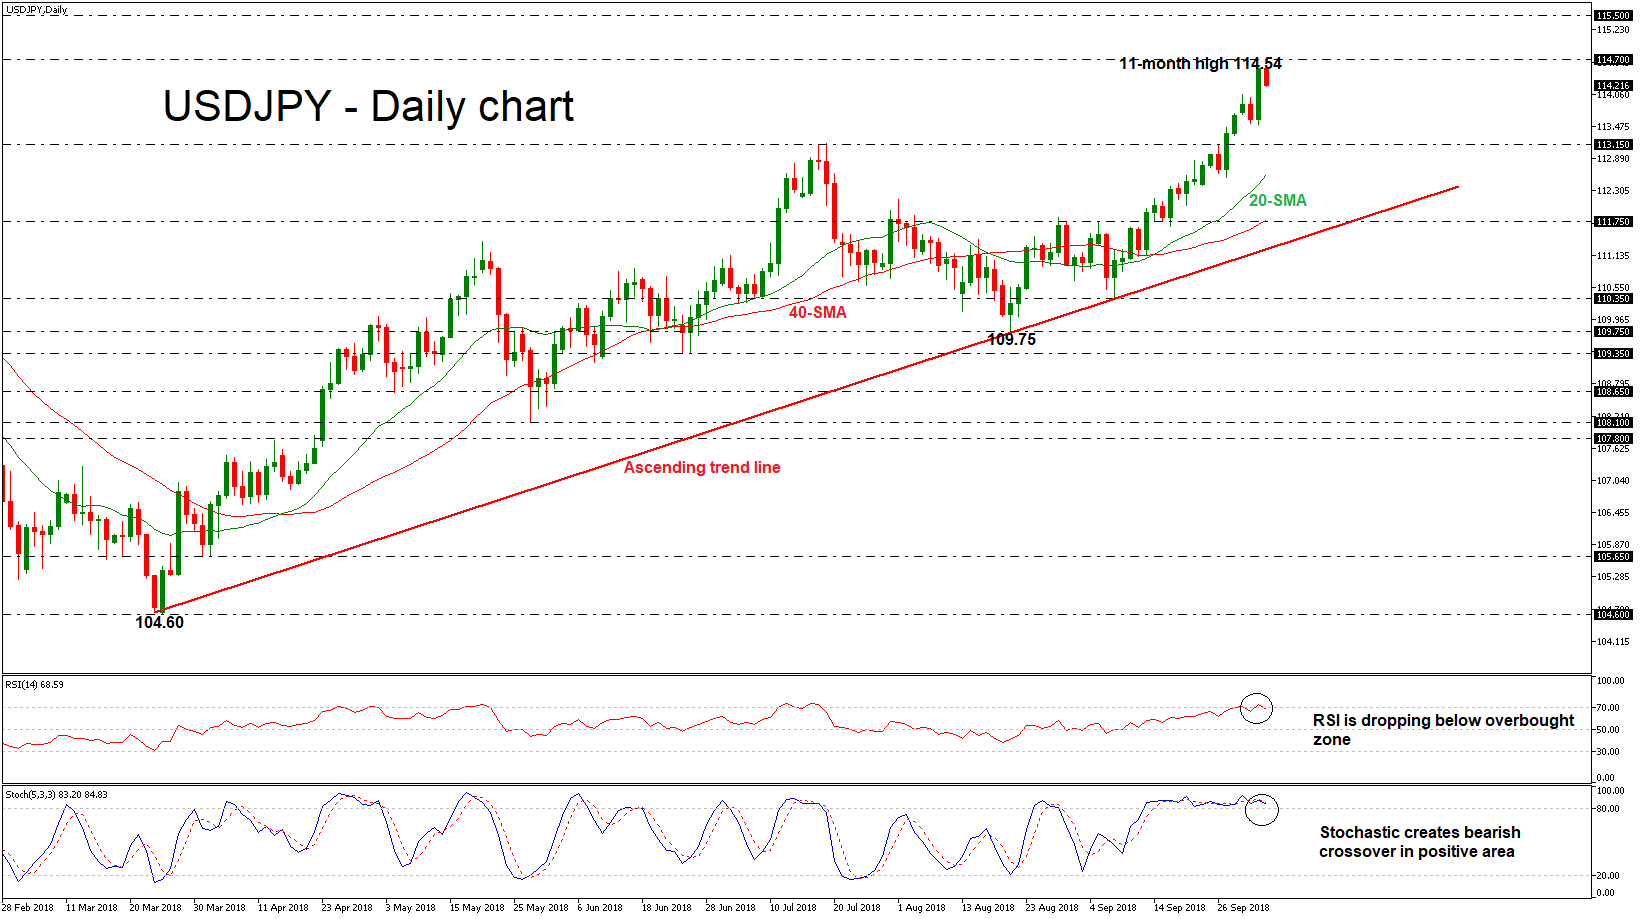
USDJPY reached a new 11-month high of 114.54 early on Thursday after the bullish rally yesterday, creating a new higher high in the medium-term structure. However, it started today’s session with negative momentum. The pair is trading above the ascending trend line and well above the 20- and 40-simple moving averages (SMAs), suggesting further significant gains.
In the daily timeframe, technical indicators show some signs that today’s pullback may continue for a while longer. The RSI turned lower after it hit resistance in the overbought zone, while the red %K line of the stochastic oscillator recorded a bearish cross with the blue %D line, showing signs of peaking as well.
If the bulls manage to take charge for another session, then the expectation is for a retest of the 114.70 resistance level, achieved on November 2017. If there is a clear break above this barrier, then there are chances for larger extensions. Such a break would confirm bullish movement until the 155.50, identified by the high on March 2017.
On the flip side, a clear dip below the 113.15 support level would bring the pair towards the 20-SMA near 112.60 and may set the stage for declines until the 111.75 support, which overlaps with the 40-SMA and stands near the diagonal line. A penetration of this significant obstacle would shift the bullish outlook to a more neutral one.
Overall, USDJPY has been developing within an uptrend since March 26 but there are some signs for a possible bearish correction, probably retesting the rising line.