Sample Category Title
XAUUSD Intraday Analysis
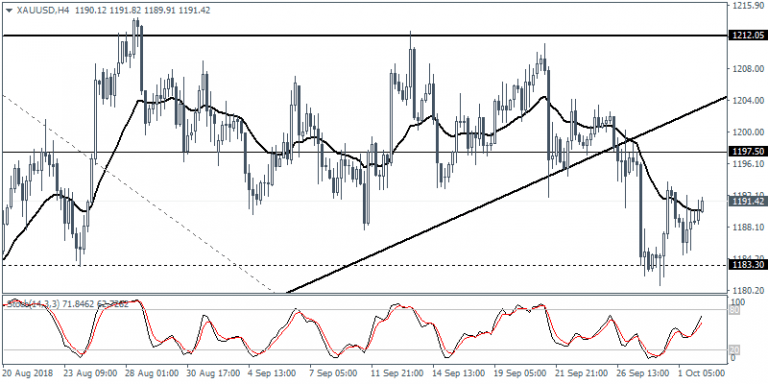
XAUUSD (1191.42): Gold prices managed to bounce off the support level at 1183.30. However, we expect the sideways range to continue. The resistance level at 1197.50 is the likely target to the upside. Failure to breakout above this level could see gold prices holding the sideways range for longer. To the downside a failure of the suport could signal further declines. The previous lows at 1170.00 will be the next main target of interest.
GBPUSD Intraday Analysis
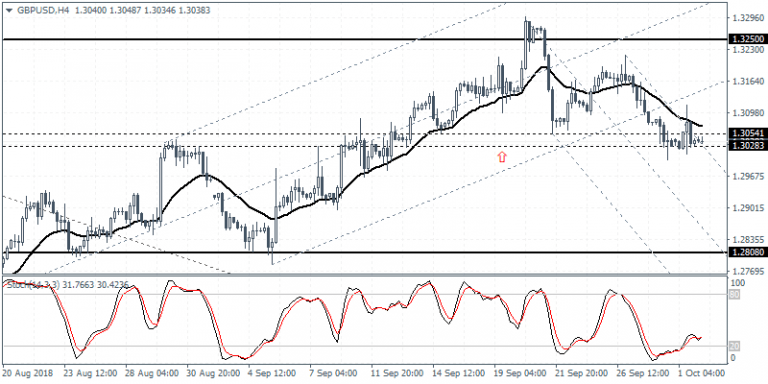
GBPUSD (1.3038): The GBPUSD currency pair was also trading weaker on Monday. Price aciton was seen settling near the support level of 1.3052 – 1.3028 level. As long as this support holds, there is scope for the GBPUSD currency pair to break higher. However, a break down below this level could see the cable testing the next main lower support at 1.2808. To the upside, price action could target the previously held resistance level of 1.3250.
AUD/USD Daily Outlook
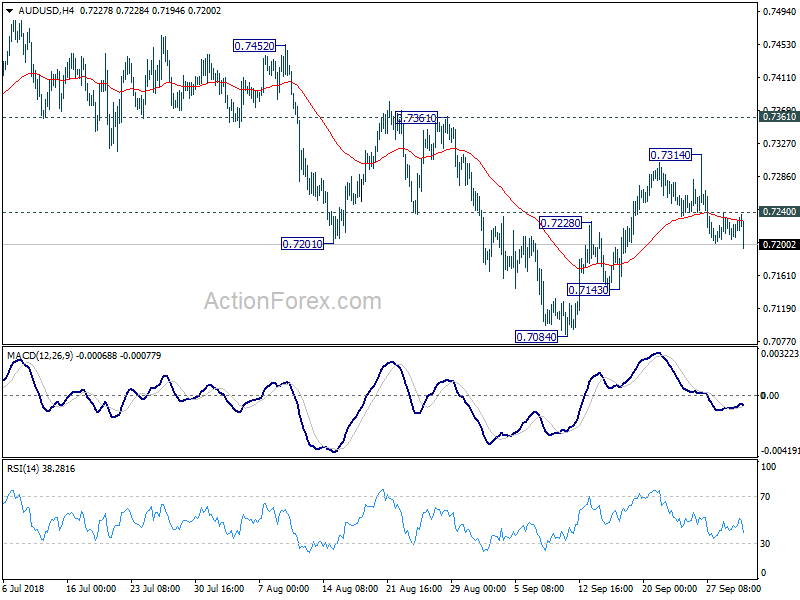
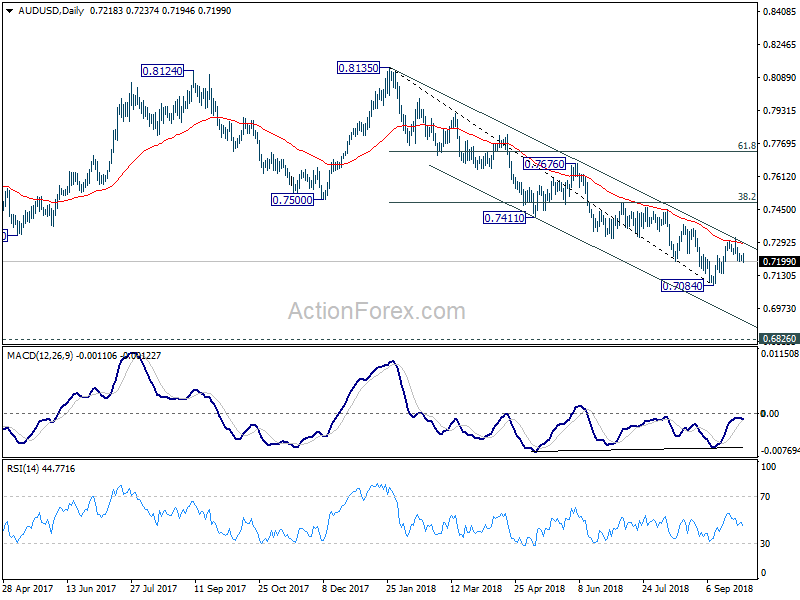
Daily Pivots: (S1) 0.7209; (P) 0.7221; (R1) 0.7235; More...
AUD/USD's decline from 0.7314 resumed after brief consolidations. Intraday bias stays on the downside for 0.7143 support first. Break should resume whole decline from 0.8135 through 0.7804 support. On the upside, above 0.7240 minor resistance could extend the corrective rebound from 0.7084 with another rise. But upside should be limited well below 0.7361 resistance to complete the correction and bring down trend resumption eventually.
In the bigger picture, rebound from 0.6826 (2016 low) is seen as a corrective move that should be completed at 0.8135. Fall from there would extend to have a test on 0.6826. There is prospect of resuming long term down trend from 1.1079 (2011 high). Current downside momentum as seen in weekly MACD support this bearish case. Firm break of 0.6826 will target 0.6008 key support next (2008 low). On the upside, break of 0.7361 resistance, however, argues that a medium term bottom is possibly in place, and stronger rebound could follow. We'll assess the medium term outlook later if this happens.
EURUSD Intraday Analysis
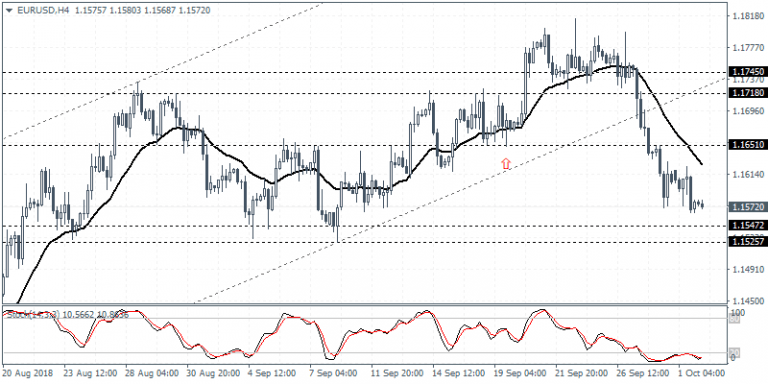
EURUSD (1.1572): The EURUSD currency pair extended declines on Monday following through from last Friday’s losses. Price action is seen approaching the support level at 1.1547 – 1.1572 level. A rebound off this support level could stall the declienes temporarily. However, failure to hold the declines could trigger further losses. A break down below the support level could push the euro currency lower to the August lows of 1.1315 region.
USMCA Replaces NAFTA – Markets Unmoved
The markets opened on Monday to the news that the United States, Mexico and Canada managed to agree on a new deal. The new trade deal replaces the North American Free Trade Agreement (NAFTA) and is now called the United States-Mexico-Canada Agreement (USMCA) deal. The deal is said to give greater access to the U.S to Canadian dairy markets in return for allowing extra imports of Canadian cars.
Economic data from the U.S. was slightly. Construction spending was seen rising less than expected August. Official data showed that spending on construction rose just 0.1% in August on a month over month basis.
The ISM's manufacturing PMI showed the index easing to 59.8 in August compared to 61.3 in July. The data also missed estimates of 60.1.
However, the USD managed to close on a high note, maintaining the gains from last Friday.
The day ahead will be marked by the RBA's monetary policy meeting. No changes are expected to the interest rate which stands at 1.50%. The European trading session is relatively quiet. Spain will be releasing its unemployment change followed by the construction PMI data from the UK.
The median estimates put the activity in the construction sector to ease slightly to 52.8 from 52.9.
Later in the evening, the NY trading session will see the Fed chair, Jerome Powell speaking.
USD/JPY Daily Outlook
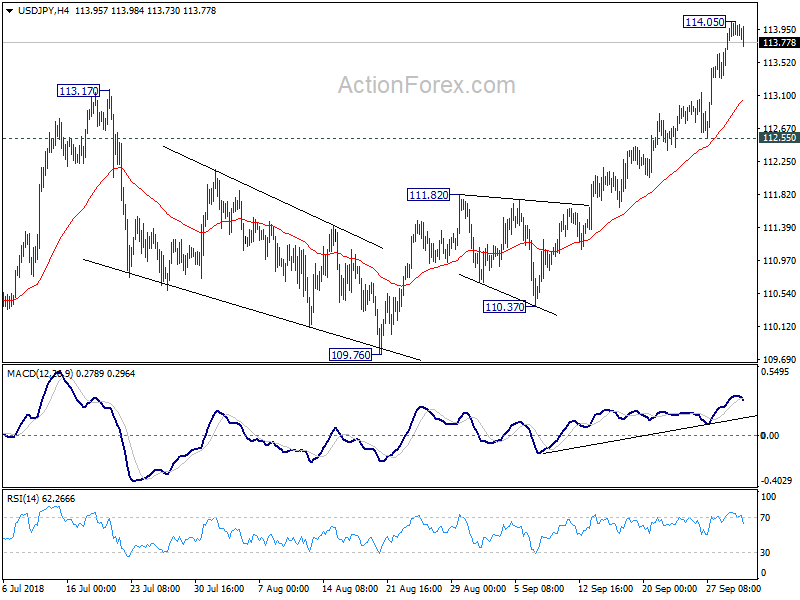
Daily Pivots: (S1) 113.74; (P) 113.93; (R1) 114.16; More...
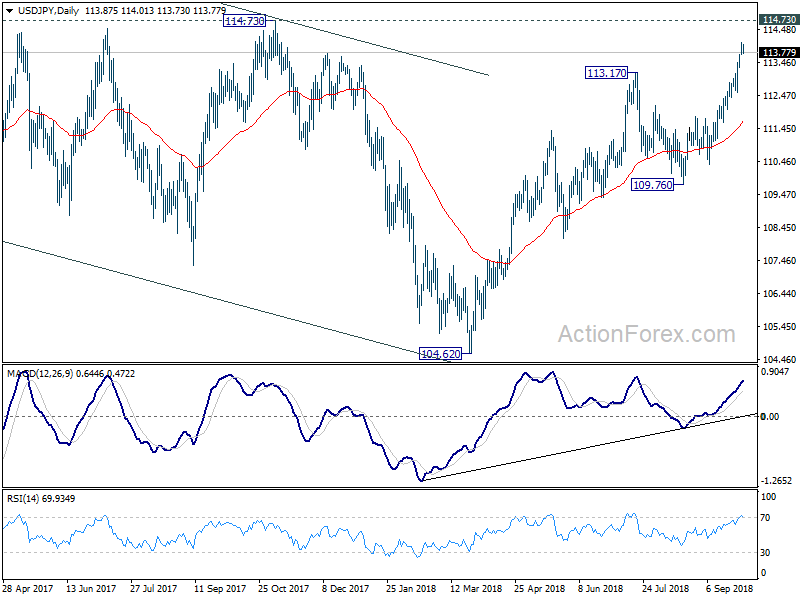
A temporary top is in place at 114.05 in USD/JPY with today's retreat. Intraday bias is turned neutral first. Some consolidations would be seen but downside should be contained above 112.55 support to bring another rally. Above 114.05 will target 114.73 key resistance. Decisive break there will confirm larger bullish case. Next target will be 118.65 resistance.
In the bigger picture, corrective fall from 118.65 (2016 high) should have completed with three waves down to 104.62. Decisive break of 114.73 resistance will likely resume whole rally from 98.97 (2016 low) to 100% projection of 98.97 to 118.65 from 104.62 at 124.30, which is reasonably close to 125.85 (2015 high). This will stay as the preferred case as long as 109.76 support holds.
DXY Ending The Elliott Wave Flat Correction
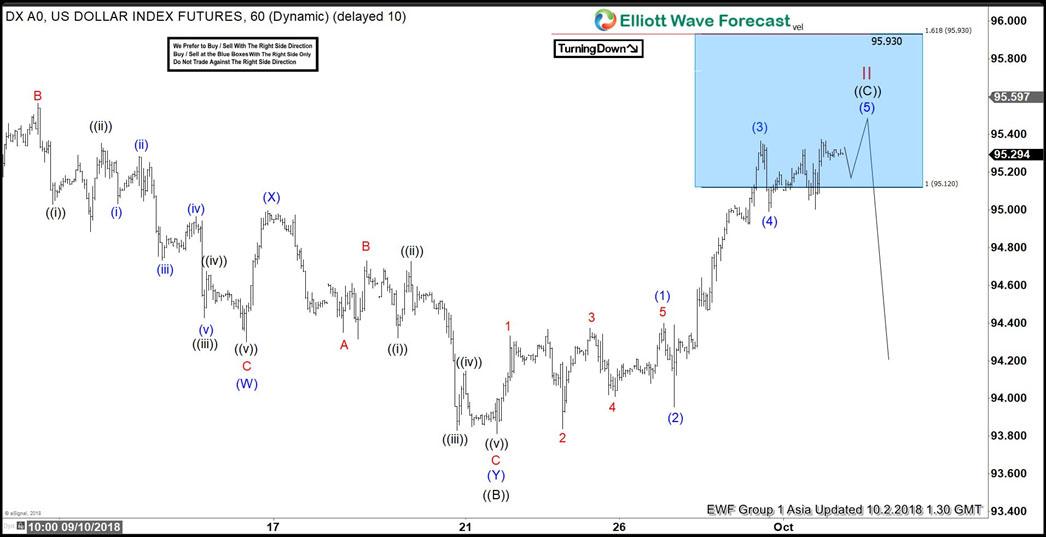
DXY short-term Elliott wave view suggests that the index is doing a Flat correction coming from 8/28/2018 low within cycle degree wave II. Meaning that the internal distribution of cycle from that low is showing the sub-division of 3-3-5 wave structure. Where primary wave ((A)) ended in 3 swings at 95.73 on 9/04 peak. Down from there the decline to 93.81 low ended primary wave ((B)) lower as double three structure with the sub-division of 3 wave corrective sequence in intermediate wave (W),(X) & (Y).
The initial decline to 94.43 low ended intermediate wave (W) as zigzag structure. Up from there, the bounce to 94.99 high ended intermediate wave (X). Down from there, the decline to 93.81 low ended intermediate wave (Y) as zigzag structure & also completed the primary wave ((B)) as well. Above from 93.81 low, the rally higher is taking place as an impulse in primary wave ((C)) of II with the sub-division of 5 waves structure in intermediate wave (1),(3) & (5).
Where the first leg higher to 94.40 high ended intermediate wave (1). And pullback to 93.95 low ended intermediate wave (2). A rally to 95.36 high ended intermediate wave (3). Then a pullback to 94.99 low ended intermediate wave (4). Near-term intermediate wave (5) remain in progress looking to extend higher 1 more time within the blue box area by holding below the 95.93 invalidation level before ending the Flat correction in cycle degree wave II. Afterwards, the index is expected to resume the downside or should react lower in 3 swings at least. We don’t like buying the index.
DXY 1 Hour Elliott Wave Chart
New Nordic Outlook
Market movers today
This morning, we published our quarterly Nordic Outlook, including our updated macro forecasts for the four Nordic economies .
In Denmark, FX reserve figures for September are due out at 16:00 CEST. Danmarks Nationalbank has not intervened for a long time but DKK traded on the weak side of the central parity rate against EUR for some days in September. Even if it turns out Danmarks Nationalbank had to buy DKK to counter the weakening of the currency, we do not expect that a unilateral rate hike is imminent. Danmarks Nationalbank has large foreign currency reserves, and we also expect the weak DKK to prove a temporary phenomenon.
In the UK, focus remains on the Conservative Party Conference and the development so far has shown that the party remains extremely divided on how to proceed with the Brexit negotiations. Ex foreign secretary and leading Brexiteer Boris Johnson is speaking today. We still believe PM Theresa May's room for manoeuvre is bigger after the conference and still think a 'decent Brexit' is the most likely outcome. See Brexit Monitor: Get ready for the end-game , 27 September.
We do not expect Fed Chair Powell to send any new signals in his speech at 18:45. In our view, the Fed is on autopilot at least until the neutral rate of 3.00% is reached, probably in June next year. See FOMC Review: Gradual Fed hikes are set to continue , 26 September.
Selected market news
Turbulence surrounding the Italian budget continued yesterday. With no DEF published and scarce communication on further underlying assumptions from the government, the day ended with 30bp higher yields in the 2Y area. Particularly noteworthy are the media reports yesterday morning where the EU was said to reject the budget and President Juncker's comment in the evening that 'we have to prevent Italy from being able to get special treatment here that, if everybody were to get it, would mean the end of the euro'.
Wage growth in Sweden moderated to 2.5% in July according to fresh data from the National Mediation Office. So far, this year's wage growth has averaged 2.4%. If this number is not revised, the rest of the year must average 2.9% in order to meet the Riksbank's full-year forecast. This seems highly unlikely.
The recent turmoil in Turkey showed up in the PMI, which came in very bad yesterday. It is signalling a clear slowdown in economic growth. Manufacturing PMI slid to 42.7, the lowest in the track history we can see since late 2015.
Brent surged above USD85/bbl yesterday on reports of another decline in Iranian oil exports due to sanctions imposed by US earlier this year. Japanese equities rose to the highest level in 27 years.
USD/CHF Daily Outlook
Daily Pivots: (S1) 0.9805; (P) 0.9831; (R1) 0.9861; More...
Intraday bias in USD/CHF remains on the upside for 61.8% retracement of 1.0067 to 0.9541 at 0.9866. Decisive break there will bring retest of 1.0067 high. On the downside, below 0.9804 minor support will turn intraday bias neutral and bring consolidation first, before staging another rise.
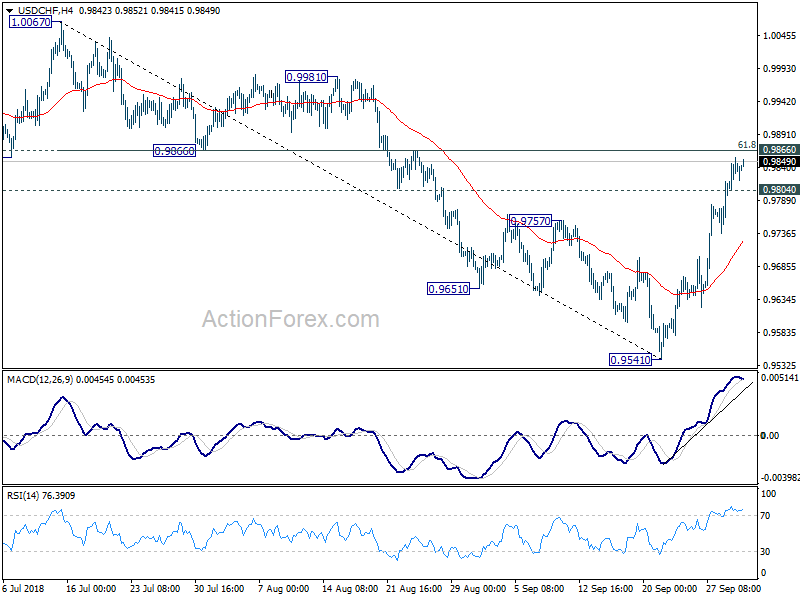
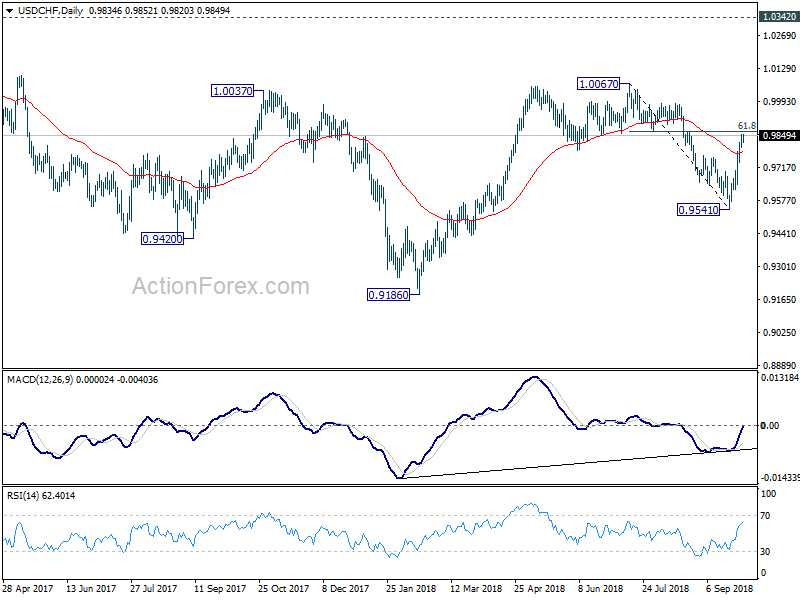
In the bigger picture, focus is now back on 0.9866 support turned resistance. Decisive break there will suggests that pull back from 1.0067 has completed at 0.9541. And larger rise from 0.9186 low is ready to resume. Decisive break of 1.0067 will pave the way to 1.0342 key resistance next. Meanwhile, break of 0.9541 will extend the decline but we don't expect a break of 0.9186 low even in that case.
GBP/USD Daily Outlook
Daily Pivots: (S1) 1.3001; (P) 1.3051; (R1) 1.3091; More...
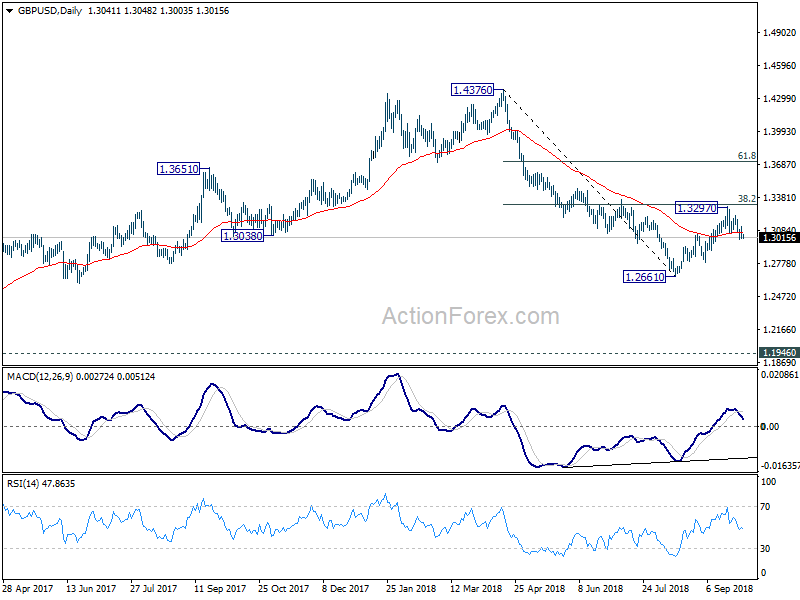
Intraday bias in GBP/USD remains neutral for consolidation above 1.2999 temporary top. Overall, near term outlook remains bearish as long as 1.3216 resistance holds. On the downside, below 1.2999 will target 1.2784 support first. Break there will likely resume larger down trend from 1.4376 through 1.2661. However, break of 1.3216 will dampen our bearish view and turn focus back to 1.3316 key fibonacci resistance.
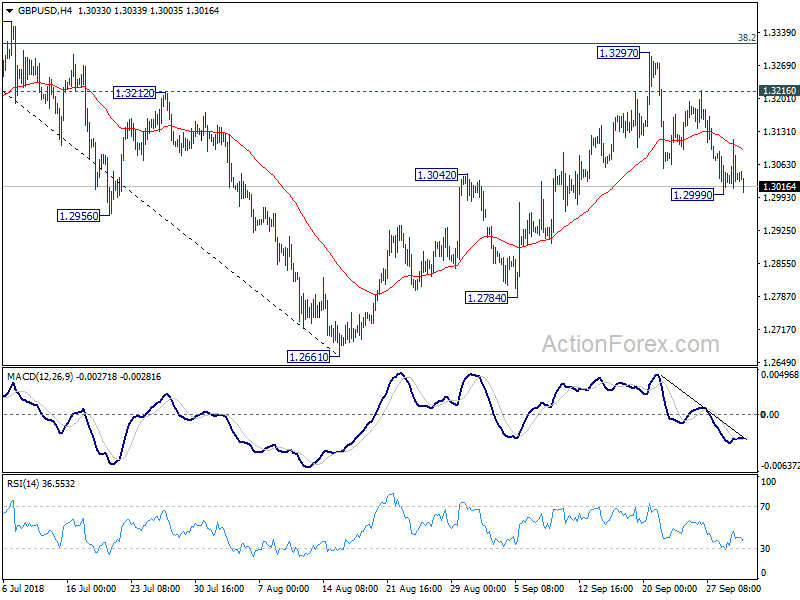
In the bigger picture, whole medium term rebound from 1.1946 (2016 low) should have completed at 1.4376 already, after rejection from 55 month EMA (now at 1.4062). The structure and momentum of the fall from 1.4376 argues that it's resuming long term down trend. And this will be the preferred case as long as 38.2% retracement of 1.4376 to 1.2661 at 1.3316 holds. However, firm break of 1.3316 would bring stronger rebound to 61.8% retracement at 1.3721. And, the eventual depth of the fall from 1.4376, and the chance of hitting 1.1946 low, will depend on the strength of the interim corrective rebound from 1.2661.