Sample Category Title
Loonie Jumps As US Inches To A New Trade Deal With Canada
The effects of the current trade conflict between the US and China have started to emerge. Yesterday, the manufacturing Purchasing Managers Index from China’s Logistics Information Center and Caixin showed a reduction in activity. The former showed that the PMI in September was at 50.8, which was lower than the expected 51.2. The latter showed the PMI at 50, which was lower than the expected 50.5. A PMI level above 50 is considered healthy. The decline in the PMIs sent shockwaves to the Chinese stocks that opened the markets lower from Friday’s close.
The Canadian dollar rose sharply against the US dollar after Reuters reported that the US had reached a deal with Canada on a new trade deal. The new deal will open up the Canadian dairy market to the US and exempt Canada’s auto sector from auto tariffs. The new deal will also change the name from NAFTA to the US, Mexico, Canada Agreement. Previously, Trump had said that Canada’s exports to the US would face major tariffs if a deal was not reached by midnight on Sunday.
The Japanese Yen declined in the Asian session after mixed economic numbers from Japan. The Tankan all big industry CAPEX for the third quarter rose by 13.4% which was lower than the expected 14.2%. The Tankan Larger Manufacturers Index for the third quarter rose by 19, which was lower than the expected 22 while the non-manufacturer’s index fell to 22. This data is a clear indication of the challenges the Japanese economy is facing in the midst of a global trade war.
EUR/USD
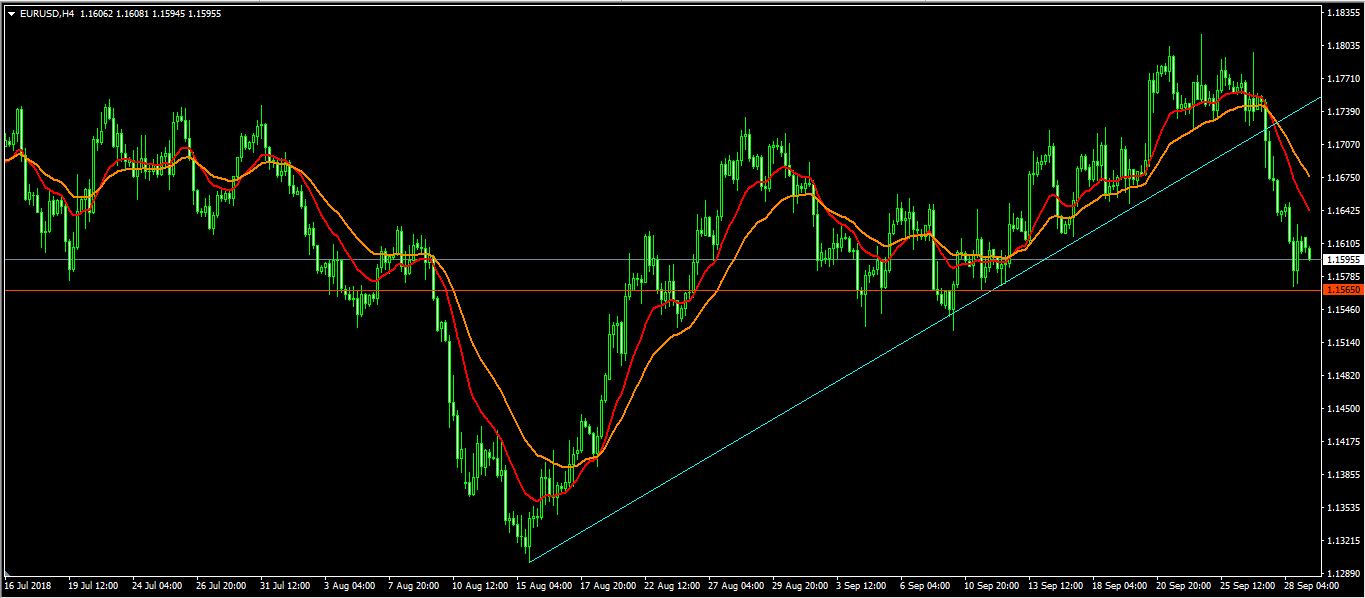
The EUR/USD pair was little moved in the Asian session as the previous sharp decline paused at around 1.1594. The current price is below the important support line shown below. It is also below the 14 and 28-day exponential moving average. It will likely continue the downward movement today. This will depend on the PMI data from Germany and the United States. Further declines will see it test the 1.1525 level while any upside will see it test the 1.1645 level
USD/CAD
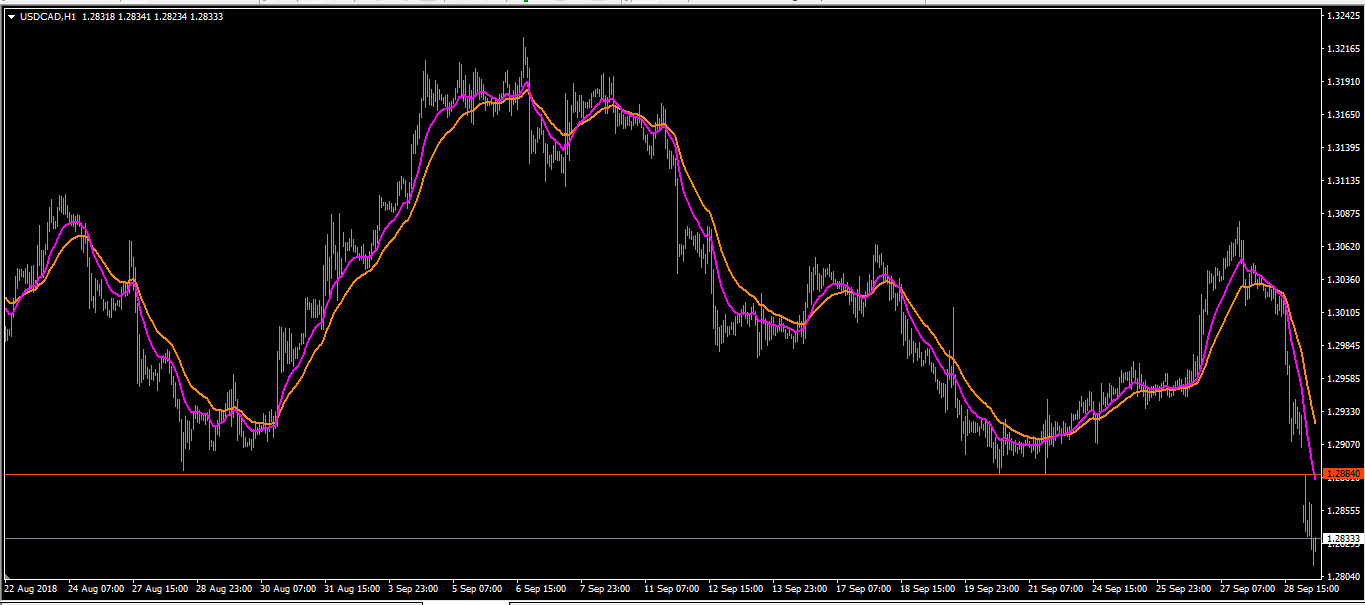
The USD/CAD fell sharply after indications that the US had reached a deal with Canada. This ended weeks of tensions between the two countries. The pair reached an intraday low of 1.2810, which was below the important support. This was an extreme low, and is obviously below all the major moving averages. There is a likelihood that the pair will continue to move downwards as traders expect the BOC to start thinking of a rate hike. This is because the US-Canada trade relationship was a major factor in determining the future of the hikes.
CAD/JPY
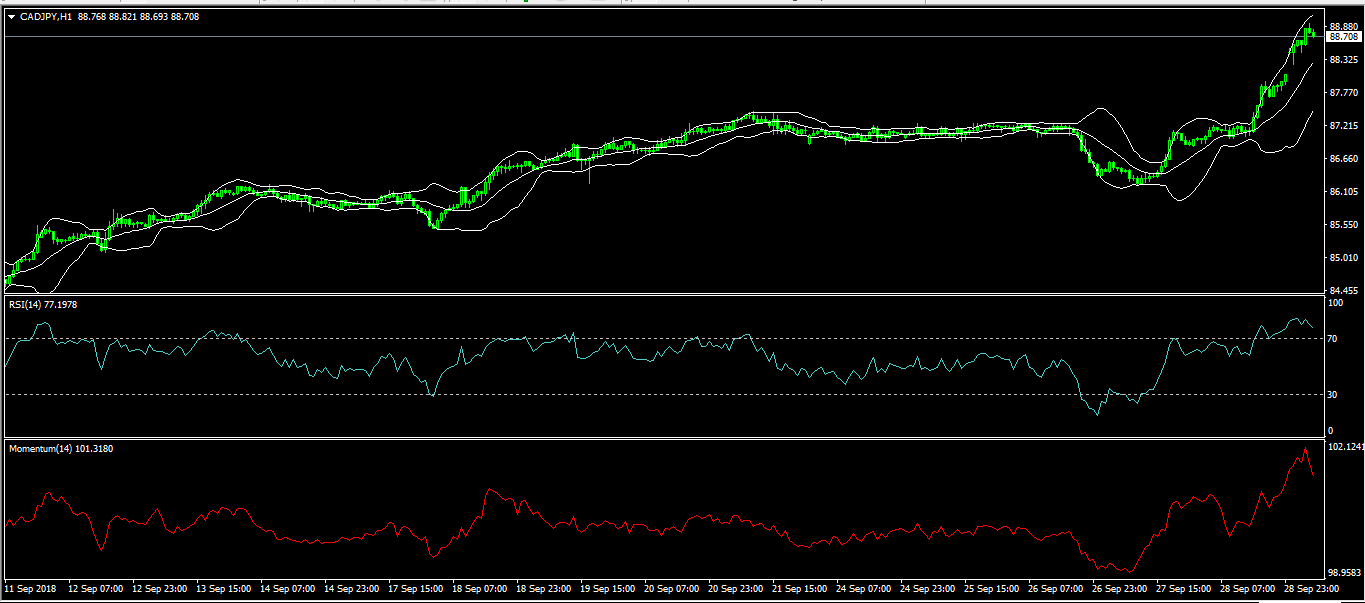
The CAD/JPY pair continued the sharp ascent started in early September. It reached an intraday high of 88.9 in the Asian session as traders cheered the US-Canada deal. The pair is trading along the upper Bollinger Band which is an important show of strength. The RSI is above the 70 overbought level while the momentum indicator is above 100. While a slight downward movement is likely in the short-term, the pair will most likely continue the upward momentum.
Weekly Wave Analysis EUR/USD, GBP/USD, USD/JPY
EUR/USD
The EURUSD currency pair could be building an ABC (purple) correction within a potential wave X (pink). A critical level for this wave pattern is the green support trend line at 1.15, which could be used for an inverted head and shoulders pattern (purple boxes). A bullish bounce could see the price finish wave Y (pink) of wave B (purple), whereas a bearish break could see the price fall further towards the Fibonacci levels.
Daily chart:
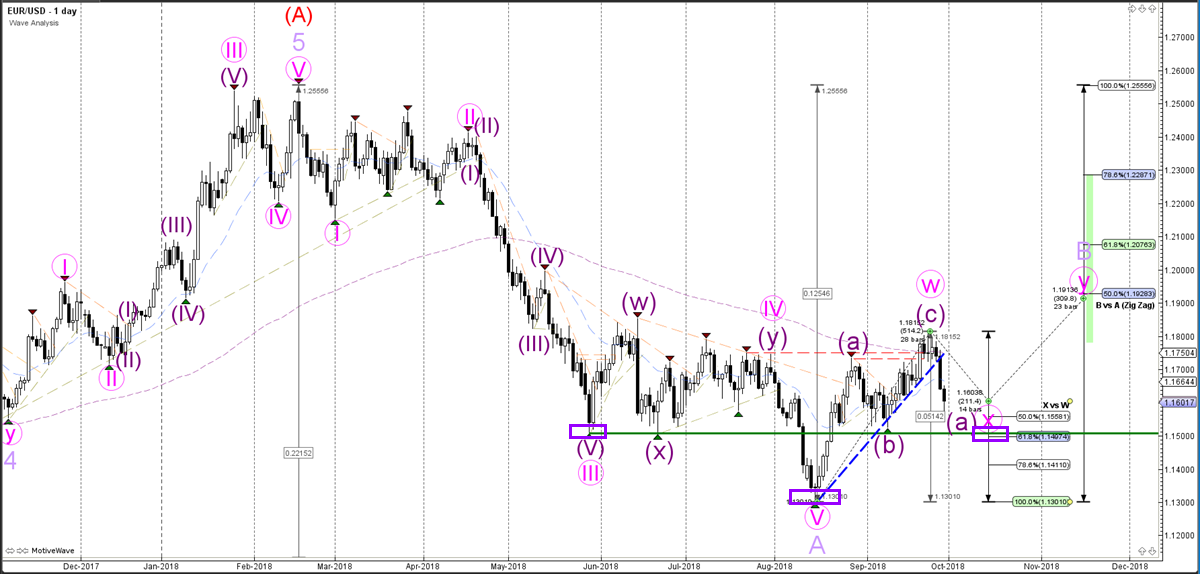
The EUR/USD currency pair is probably building a bearish ABC (purple) correction within wave B (red).
Weekly chart:
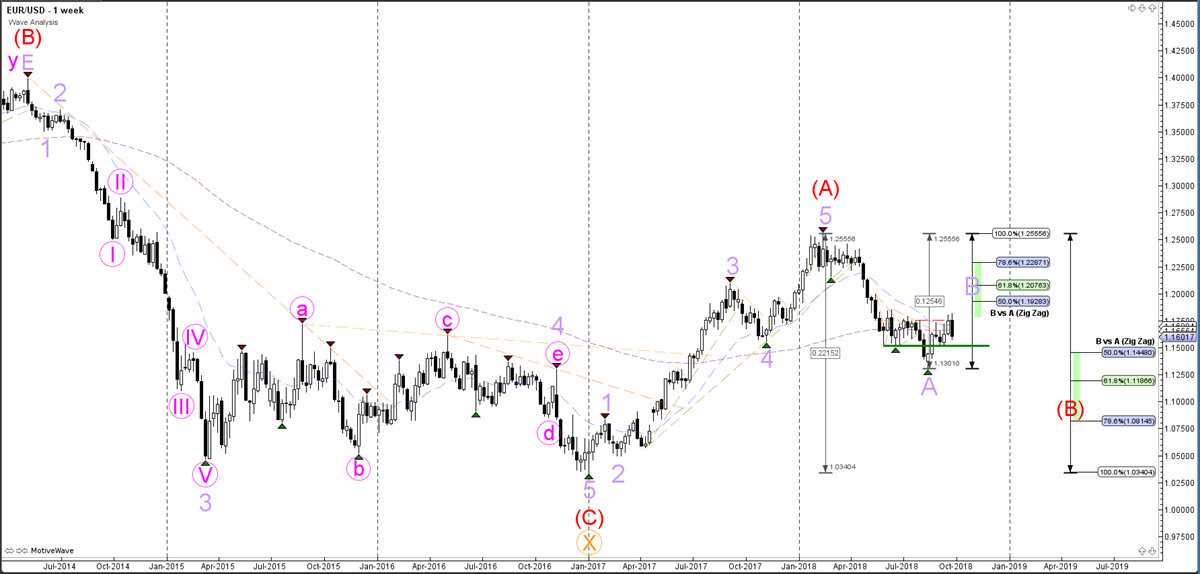
The EUR/USD currency pair has completed wave A (red) and the price is most likely retracing to the Fibonacci levels of wave B (red).
Monthly chart:
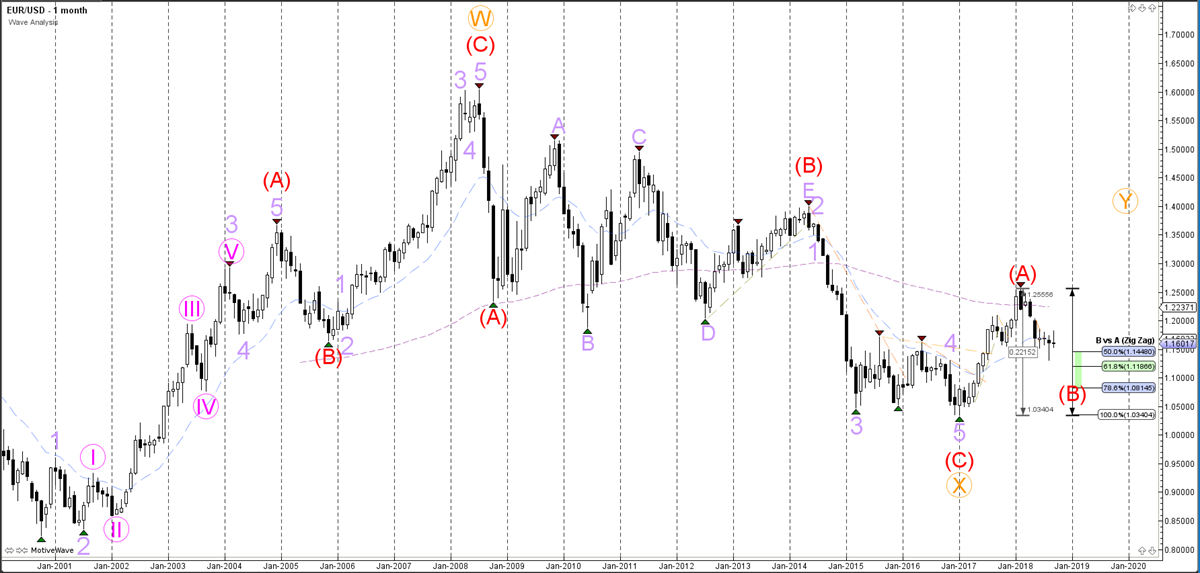
GBP/USD
The GBP/USD currency pair made a bearish bounce at the 38.2% Fibonacci retracement level of the wave 4 (pink) pattern. A bearish breakout could confirm the potential wave 5 pattern (pink).
Daily chart:
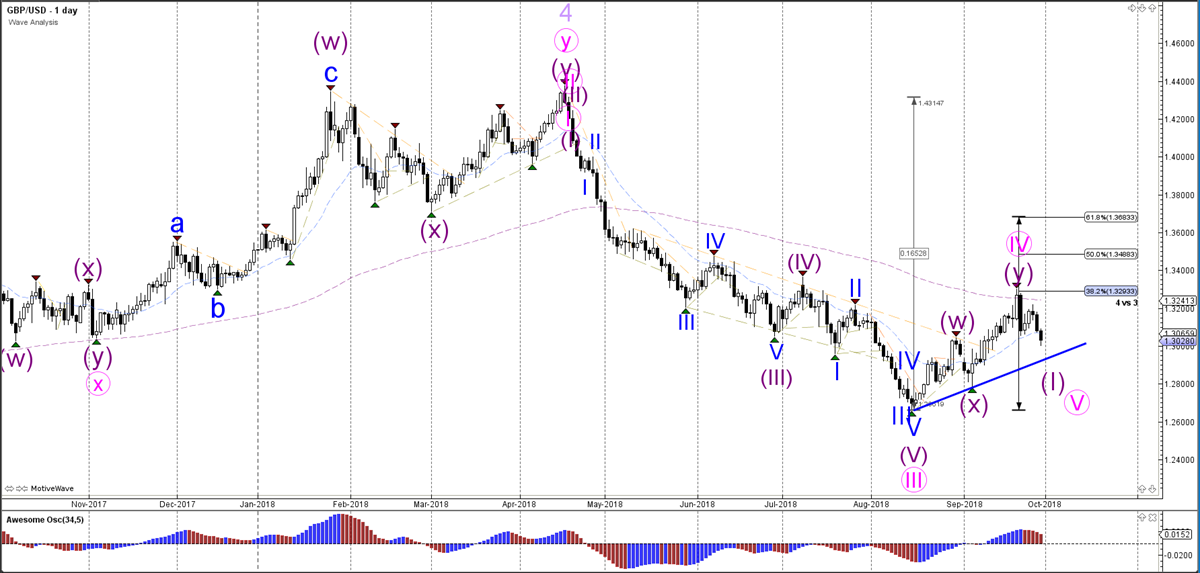
The GBPUSD currency pair has probably started the bearish wave 5 after the price has completed a wave 4 (light purple) correction.
Weekly chart:
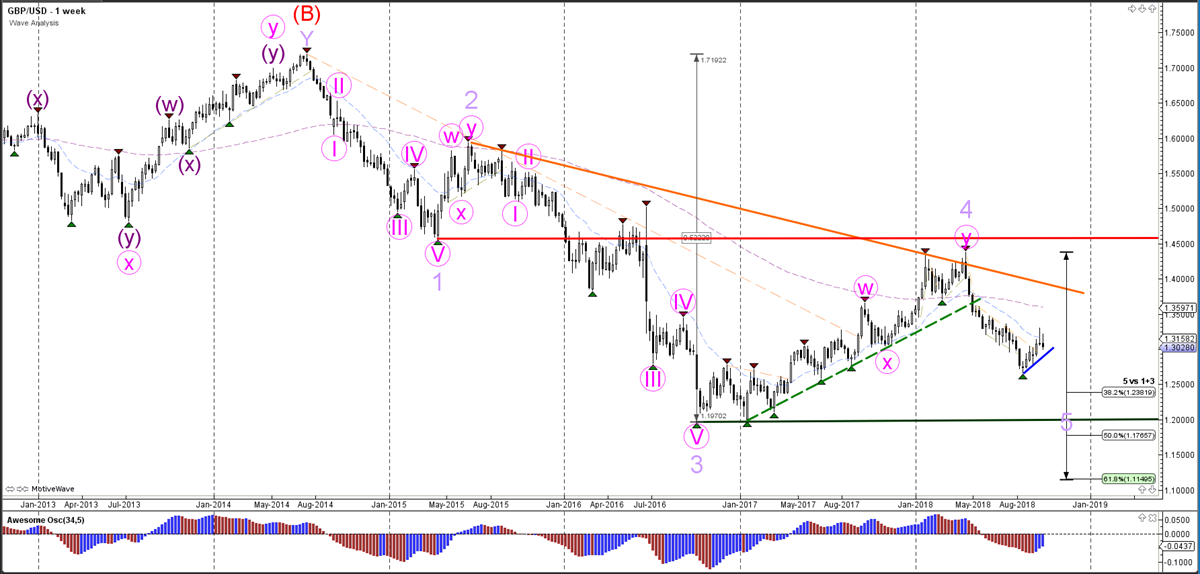
The GBP/USD currency pair is showing a series of bearish candlesticks and hence a strong downtrend. This is probably indicating the start of wave 5 (purple), whereas a bullish break above the resistance (orange) trend line indicates that a different wave pattern is valid.
Monthly chart:
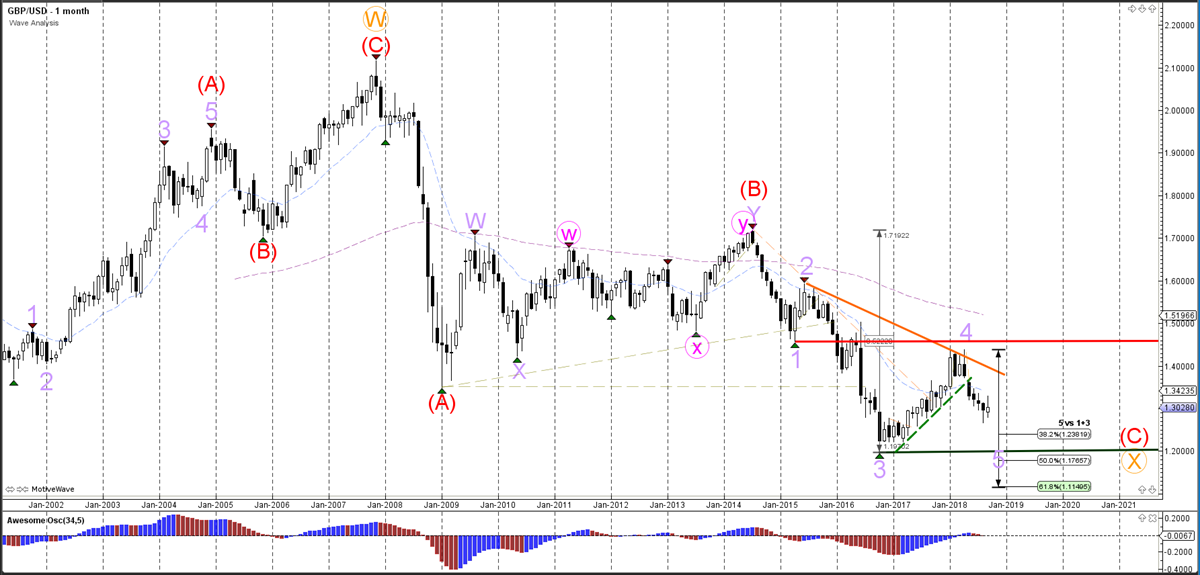
USD/JPY
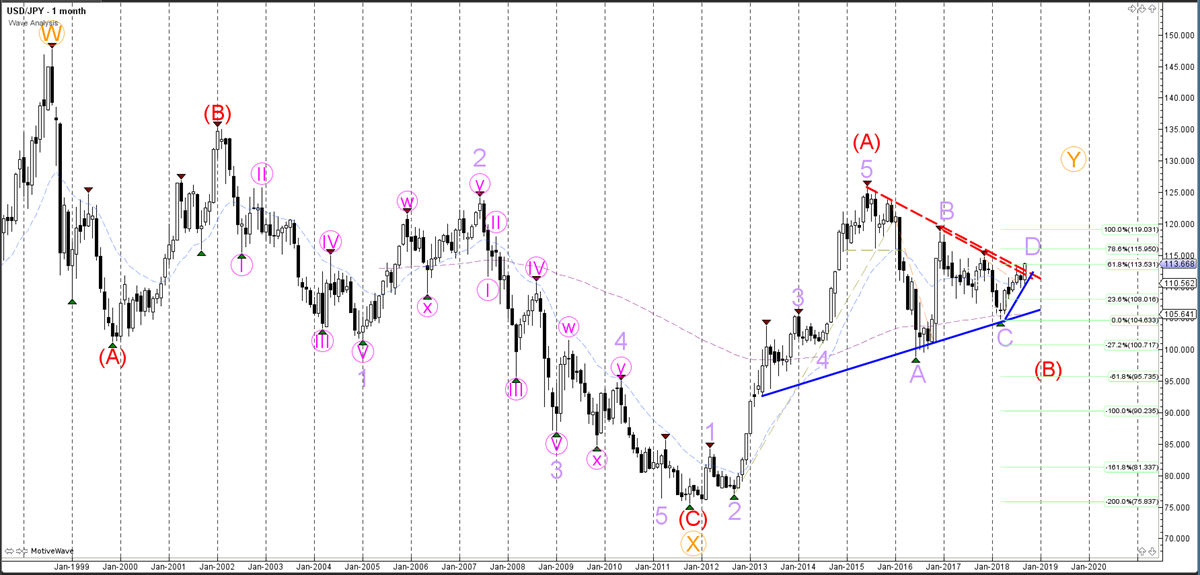
The USDJPY currency pair seems to be building a WXY (pink) correction within wave D (purple).
Daily chart:
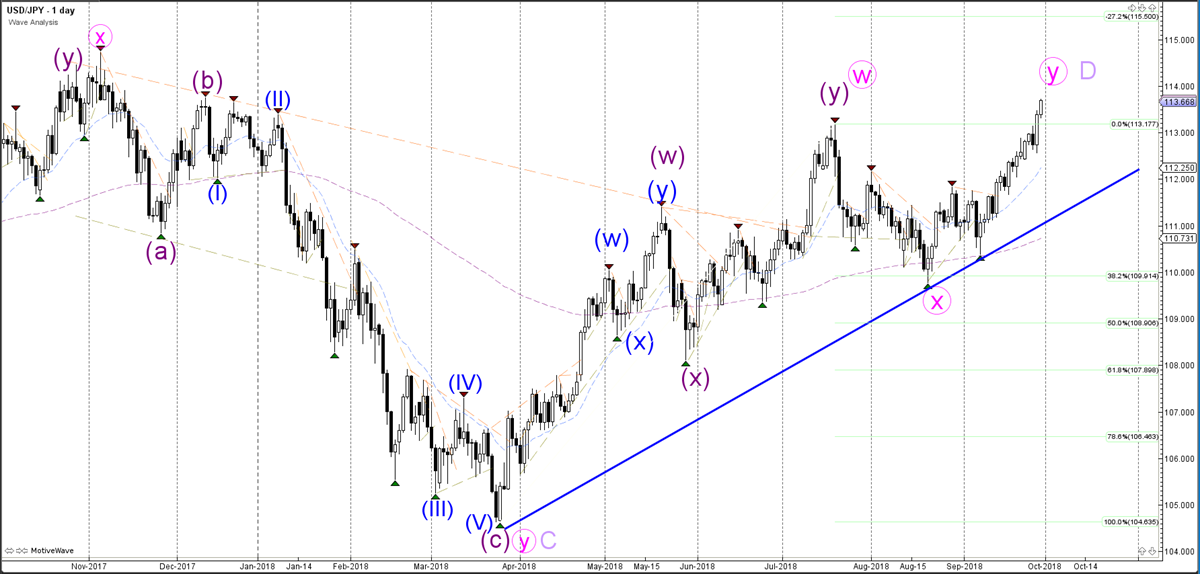
The USD/JPY currency pair broke above the resistance trend lines (dotted red), which is either the start of a bullish trend, or still part of the larger ABCDE triangle (light purple) within wave B (red).
Weekly chart:
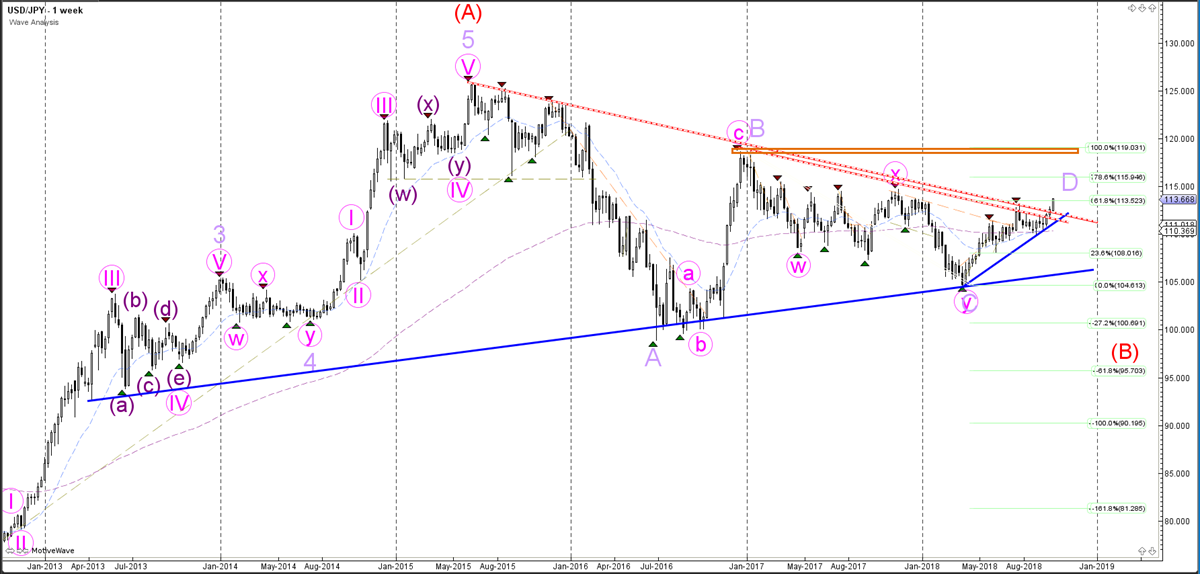
The USD/JPY currency pair is probably still in the wave E (light purple) of the triangle pattern, unless it breaks above the 78.6-100% Fibonacci resistance zone.
Monthly chart:
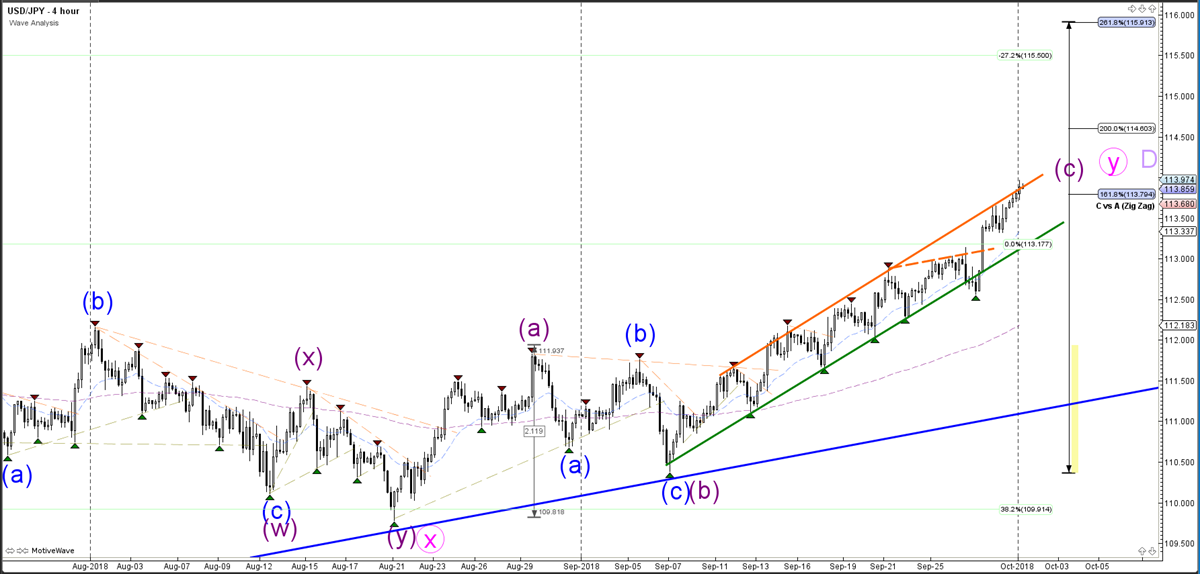
USD/JPY Bullish Wave 3 Breaking Above Weekly Resistance
The USDJPY currency pair remains in the uptrend channel, and the price is now approaching the resistance trend line of that channel. As long as the price remains in the channel, there is more space to move up towards the Fibonacci target levels. The current bullish momentum and candlesticks are part of the wave C (purple) of wave Y of D.
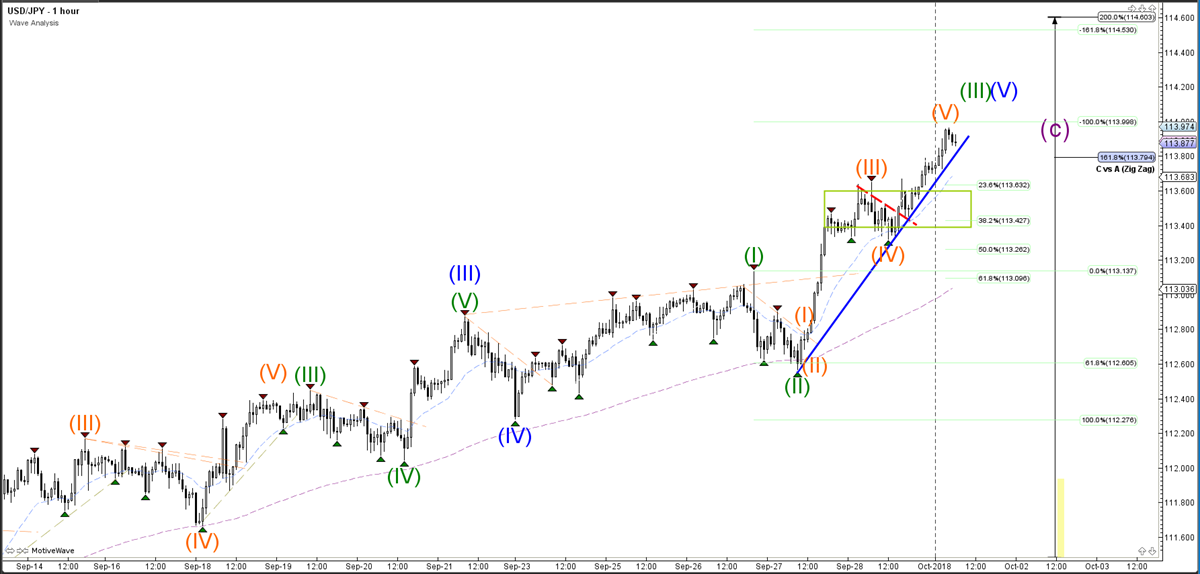
The USD/JPY currency pair is showing strong bullish momentum at the moment which is probably part of a wave 3 (green). A break below the support trend line (blue) could indicate a larger retracement, but the Fibonacci retracement levels could act as potential support for a bullish continuation.
The USD/JPY is showing a bullish breakout above the resistance trend lines (dotted red) and 61.8% Fibonacci levels on the weekly chart. The breakout however could be part of the triangle (wave ABCDE) pattern, as long as the price stays below the 78.6-100% Fib resistance levels. A bullish breakout indicates more upside.
GBP/USD Downtrend Builds Corrective Wave 4 Pattern
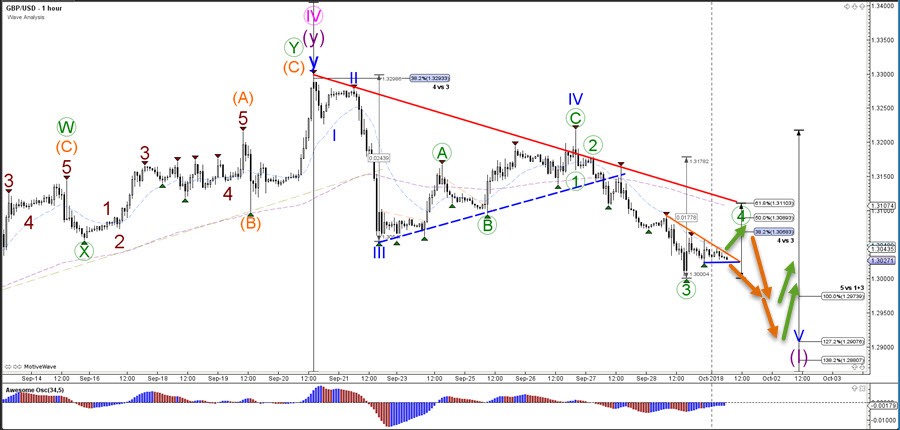
GBP/USD continued with the downtrend and made a lower low after breaking below the support trend line (dotted blue).Price is now facing a new critical support trend line (blue).
GBP/USD will probably fall towards the Fibonacci targets but price could also potentially bounce at the support trend line if it is indeed completing a wave 1 (purple).
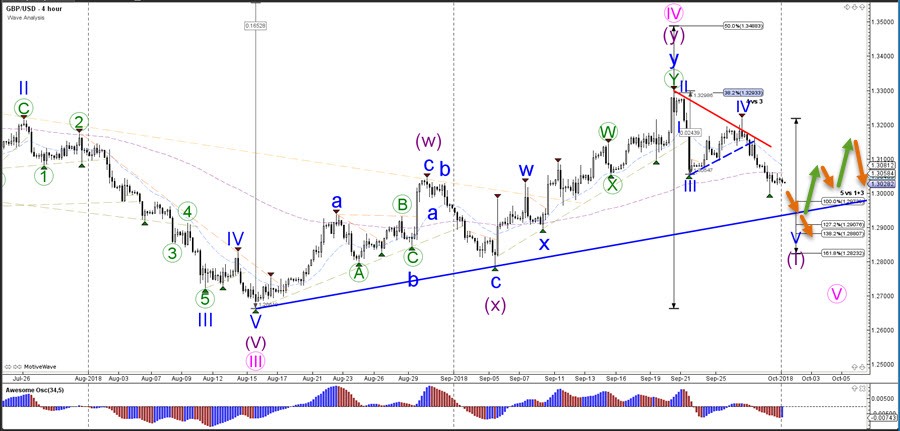
GBP/USD has probably completed a bearish wave 3 (green) and is now making a retracement within wave 4 (green). A break above the resistance trend line could indicate an ABC pattern in wave 4 whereas a bearish breakout below the support trend line (blue) could see price move towards the Fibonacci targets.
Italian Turmoil: Da Capo
Market movers today
Politics will remain a hot topic this week. The Italian budget projections will continue to be a theme for financial markets as well as the reaction from the European commission and rating agencies. In the UK, the Conservative Party Conference began yesterday (runs until Wednesday), which is going to be interesting, as the Brexit end game has begun, see Brexit Monitor: Get ready for the end-game, 27 September.
Today, we get the US ISM manufacturing for September. ISM has been too high compared to reality for a couple of years and, in our view, is a poor indicator at the moment. We estimate the ISM index fell to 60 from 61.
In the Scandies, Swedish PMI is on today's agenda.
Selected market news
The Italian budget announcement from Thursday night was the main market theme on Friday. Concerns about debt sustainability have clearly returned to the markets and we maintain a cautious stance towards Italy, not least due to possible negative reactions from rating agencies. The 2019-21 budget deficit ended up at 2.4% of GDP, well above market consensus (and could be even higher depending on realism of the revenue assumptions) and is likely to trigger downgrades from rating agencies, in our view. During the weekend, Italian Finance Minister Tria said that Italy targets growth at 1.6% in 2019 and 1.7% in 2020. The detailed document underlying the announced deficit is yet to be published, but on the face of it, the growth assumptions seem to be on the high side.
In the US, PCE core was slightly weaker than expected. In annual terms, it rose 2.0%, which does not alter the Fed's plan to be on autopilot until 3% is reached, most likely in June next year. Even if inflation surprises on the upside and moves above 2%, the Fed has indicated tolerance, as it has missed the inflation target for so many years.
The weak euro area core inflation number of 0.9% covering September released on Friday is somewhat at odds with ECB communication about a 'relatively vigorous pickup in core inflation' and indicates the changed Phillips curve relation.
The Chinese Caixin index rose to 54.1, driven by the non-manufacturing component. More importantly, the manufacturing component declined to 50.8, a level not observed in more than six months. In particular, the new export orders fell most in more than two years as US-China trade frictions are weighing on purchase managers. The manufacturing PMIs are likely to stay somewhat subdued given a deal seems unlikely before well into 2019.
Overnight, a replacement for the NAFTA agreement was announced. It remains a trilaterial agreement but is now called the US-Mexico-Canada agreement (USMCA). At the time of writing, the details on the new agreement have not been not disclosed, but according to news media, the USMCA should incentivise more car production in the US, new market access for farmers but with no agreement on Canadian steel and aluminium at this stage. The agreement is a 'win' for President Trump.
Asian Equity Markets Trade Mixed Amid Holiday In China
General Trend:
- Australia ASX 200 Financials index drops over 1% following gains on Friday
- China official manufacturing PMI hits 7-month low, Caixin manufacturing PMI declines to 16-month low
- Japan Q3 Tankan Large Manufacturing Index and outlook miss ests
- Chinese markets are closed for Golden Week (Oct 1-5th)
- Reserve Bank of Australia (RBA) expected to leave rates unchanged at Tuesday’s meeting
Headlines/Economic Data
Australia/New Zealand
- ASX 200 opened -0.4%
- (AU) Australia Treasurer said to be wary of new rules on banks hurting the economy - Press
- (AU) S&P: Australia bank ratings not impacted by the interim report by the Royal Commission into banking
- (AU) Australia Sept Corelogic House Price Index M/M: -0.6% v -0.4% prior (12th straight decline)
- (NZ) New Zealand Treasury: Outlook for Q3 growth remains solid
China/Hong Kong
- Shanghai Composite closed, Hang Seng closed
- (CN) CHINA SEPT CAIXIN PMI MANUFACTURING: 50.0 V 50.5E (16-MONTH LOW)
- (CN) CHINA SEPT OFFICIAL GOVT MANUFACTURING PMI: 50.8 V 51.2E (7-month low)
- (CN) China PBoC: Yuan exchange rate and market expectations are generally stable - Comments after Quarterly Meeting of Monetary Policy Committee
- (CN) China said to have canceled high-level security talks with the US - NY Times
- (HK) Hong Kong Macau Sept Gambling Rev: 22.0B, +2.8% y/y v 6.5%e
- Tencent [700.HK]: Announced first restructuring in 6 years - US financial press
Japan
- Nikkei 225 opened +0.2%
- (JP) JAPAN Q3 TANKAN LARGE MANUFACTURING INDEX: 19 V 22E (weakens for 3rd straight quarter, lowest since June 2017); OUTLOOK: 19 V 20E; LARGE ALL INDUSTRY CAPEX: 13.4% V 13.9%E
- (JP) BoJ Official comments on Q3 Tankan survey: Trade friction not having big impact on sentiment, may be weighing on outlook; Bad weather, natural disasters, rising raw material costs largely behind the worsening of sentiment
- (JP) Japan Sept Final Manufacturing PMI: 52.5 v 52.9 prelim
- (JP) Bank of Japan (BOJ) announces Bond purchases for month of Oct (from Sept 28th)
- (JP) On Sunday, Typhoon Trami made landfall near Osaka Japan - Press
Korea
- Kospi opened +0.3%
- (KR) South Korea Sept Trade Balance ($): 9.7B v 8.0Be
- (KR) South Korea Sept Manufacturing PMI: 51.3 v 49.9 prior (first reading above 50 in 7 months)
- (KR) South Korea sells KRW500B v KRW500B indicated in 3-year bonds: avg yield 2.010%
Other
- (IN) Reserve Bank of India (RBI): To inject durable liquidity through open market operation (OMO) purchase auctions in Oct; to inject INR360B in Oct through OMOs
- On Friday (Sept 28th), a magnitude 7.5 earthquake and tsunami struck near Palu, Indonesia
- (ID) Indonesia Sept CPI M/M: -0.2% v -0.1% prior; Y/Y: 2.9% v 3.2% prior
- (PH) Philippines Stats Agency to hold a CPI briefing on Oct 5th
- (TH) Thailand Sept CPI M/M: 0.3% v 0.2%e; Y/Y: 1.3% v 1.2%e
- (TW) Taiwan Sept Manufacturing PMI: 50.8 v 53.0 prior (slowest growth in over 2 years)
North America
- (US) US and Canada Joint Statement: Reached new trilateral trade deal with Mexico which will be called 'USMCA'
- Tesla [TSLA]: On Saturday, the SEC settled fraud charges with CEO Musk; under the agreement Musk to relinquish the Chairman role - US financial press
- Facebook [FB]: Under the general data protection regulation (GDPR), the company could face a maximum EU fine of up to $1.63B in connection with the data breach that was announced on Friday - US financial press
- Meg Energy Corp [MEG.CA]: Husky Energy proposes to acquire the company for C$11/share in cash and stock or C$6.4B (enterprise value)
Europe
- (IT) Italy Economy Min Tria: government sees the debt/GDP ratio declining to 127% of GDP in 2021 – financial press
- (IT) Italy President Mattarella and CB Gov Visco warn govt over deficit plan - financial press
- (EU) ECB's Rehn (Finland): interest rates will remain at this low level at least until after summer 2019
- (EU) ECB's Hansson hasn't even remotely thought about succeeding President Draghi - German Press
Levels as of 01:30ET
- Nikkei 225, +0.5%, ASX 200 -0.7%, Hang Seng closed; Shanghai Composite closed; Kospi -0.2%
- Equity Futures: S&P500 +0.5%; Nasdaq100 +0.7%, Dax +0.5%; FTSE100 +0.1%
- EUR 1.1618-1.1591 ; JPY 113.98-113.70 ; AUD 0.7233-0.7208 ;NZD 0.6629-0.6609
- Dec Gold -0.3% at $1,193/oz; Oct Crude Oil +0.3% at $73.52/brl; Dec Copper -0.4% at $2.791/lb
Euro-Zone’s Inflation Climbed In Line With Estimates In September
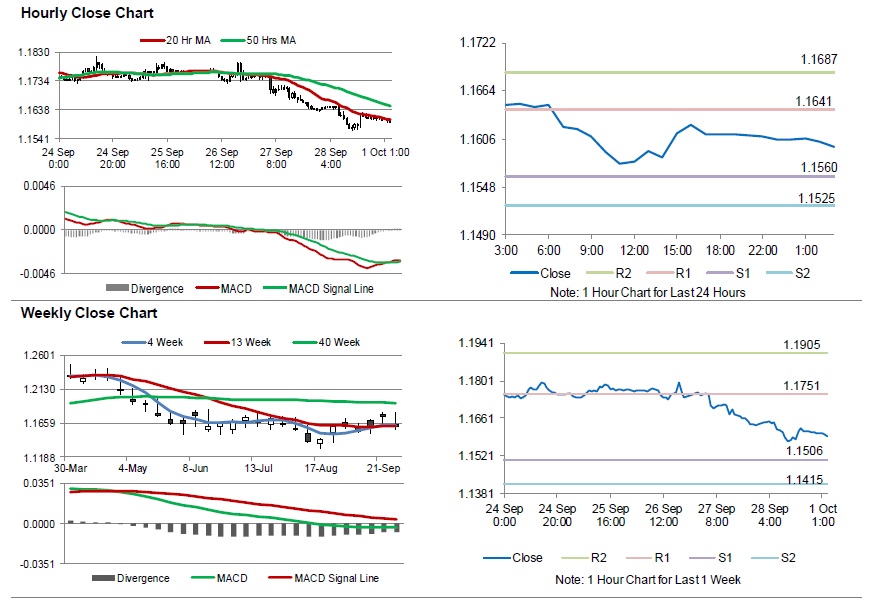
For the 24 hours to 23:00 GMT, the EUR declined 0.21% against the USD and closed at 1.1610 on Friday, after the Italian government agreed to set a higher than expected budget deficit target.
Data indicated that Euro-zone's final consumer price index (CPI) advanced 2.1% on a yearly basis in September, in line with market expectations. In the prior month, the CPI had recorded a rise of 2.0% while preliminary figures had also indicated a similar rise. Meanwhile in Germany, the seasonally adjusted unemployment rate unexpectedly declined to a rate of 5.1%, notching its lowest level since the German reunification in 1990 and following a reading of 5.2% in the previous month. Market participants had anticipated the unemployment rate to record a steady reading.
In the US, personal spending rose 0.3% on a monthly basis in August, at par with market consensus. In the preceding month, personal spending had registered a gain of 0.4%. Further, the nation's personal income climbed 0.3% on a monthly basis in August, less than market anticipations for a rise of 0.4%. In the preceding month, personal income had recorded a similar rise. Moreover, the final Reuters/Michigan consumer sentiment index rose to a level of 100.1 in September, compared to market expectations of a rise to a level of 100.6. In the previous month, the index had registered a level of 96.2, while the preliminary figures had indicated an advance to 100.8. On the other hand, the US Chicago Fed purchasing managers index eased to a level of 60.4 in September, compared to a reading of 63.6 in the prior month. Markets had expected the index to drop to a level of 62.0.
In the Asian session, at GMT0300, the pair is trading at 1.1596, with the EUR trading 0.12% lower against the USD from Friday's close.
The pair is expected to find support at 1.1560, and a fall through could take it to the next support level of 1.1525. The pair is expected to find its first resistance at 1.1641, and a rise through could take it to the next resistance level of 1.1687.
Going forward, investors would keep an eye on the Euro-zone's unemployment rate and Germany's retail sales data, both for August, along with the Markit manufacturing PMI for September, set to release across the euro-bloc in a few hours. Later in the day, the US ISM manufacturing PMI and the Markit Manufacturing PMI, both for September as well as construction spending data for August, will garner significant amount of trader's attention.
The currency pair is showing convergence with its 20 Hr moving average and trading below its 50 Hr moving average.
Britain’s Economy Expanded As Expected In 2Q
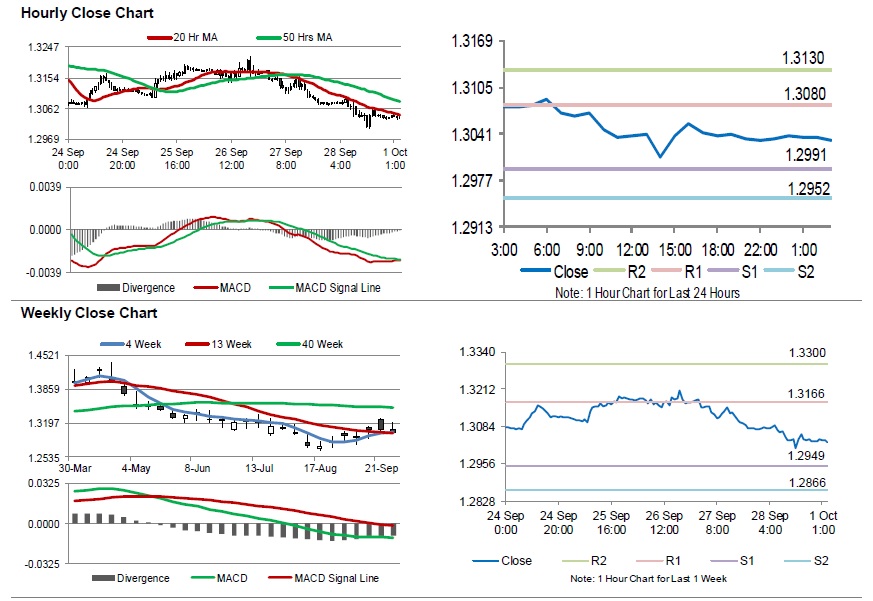
For the 24 hours to 23:00 GMT, the GBP declined 0.31% against the USD and closed at 1.3035 on Friday.
Macroeconomic data showed that UK's final gross domestic product (GDP) advanced 0.4% on a quarterly basis in 2Q 2018, in line with market expectations and confirming the preliminary print. In the prior quarter, the GDP registered a rise of 0.2%.
In the Asian session, at GMT0300, the pair is trading at 1.3031, with the GBP trading slightly lower against the USD from Friday's close.
The pair is expected to find support at 1.2991, and a fall through could take it to the next support level of 1.2952. The pair is expected to find its first resistance at 1.3080, and a rise through could take it to the next resistance level of 1.3130.
Moving forward, investors would await the UK's net consumer credit and mortgage approvals, both for August and the Markit manufacturing PMI for September, slated to release in a few hours.
The currency pair is showing convergence with its 20 Hr moving average and trading below its 50 Hr moving average
Japan’s Final Manufacturing PMI Remained Steady In September
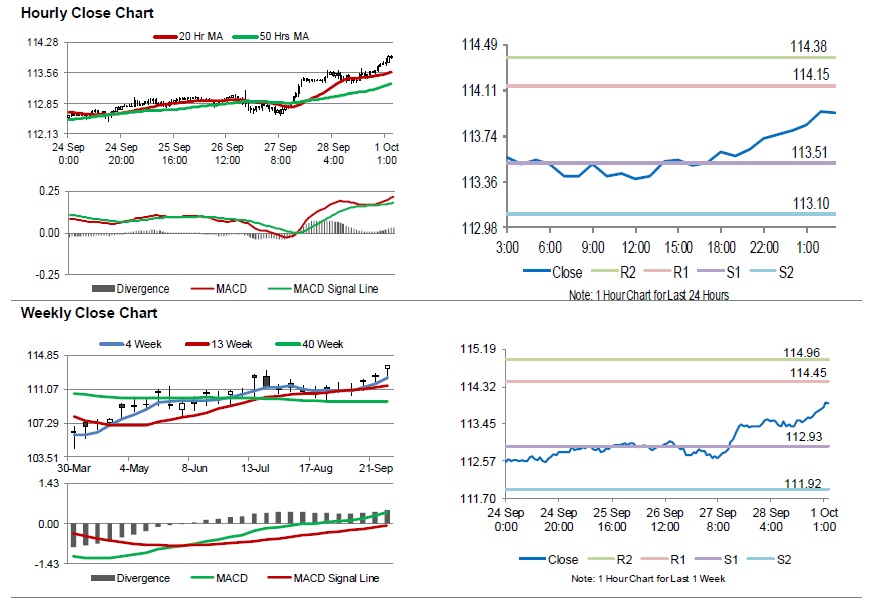
For the 24 hours to 23:00 GMT, the USD rose 0.20% against the JPY and closed at 113.63 on Friday.
Overnight data showed that Japan's final manufacturing PMI remained unchanged at 52.5 in September, while preliminary figures had indicated an advance to a level of 52.9.
In the Asian session, at GMT0300, the pair is trading at 113.93, with the USD trading 0.26% higher against the JPY from Friday's close.
The pair is expected to find support at 113.51, and a fall through could take it to the next support level of 113.10. The pair is expected to find its first resistance at 114.15, and a rise through could take it to the next resistance level of 114.38.
Amid lack of macroeconomic releases in Japan today, investor sentiment will be determined by global macroeconomic factors.
The currency pair is trading above its 20 Hr and 50 Hr moving averages.
Switzerland’s KOF Economic Barometer Indicator Rose More Than Anticipated In September
For the 24 hours to 23:00 GMT, the USD rose 0.45% against the CHF and closed at 0.9814 on Friday.
On the data front, Switzerland's KOF economic barometer jumped to a level of 102.2 in September, compared to a revised reading of 98.9 in the prior month. Market participants had anticipated for an advance to a level of 100.0.
In the Asian session, at GMT0300, the pair is trading at 0.9810, with the USD trading a tad lower against the CHF from Friday's close.
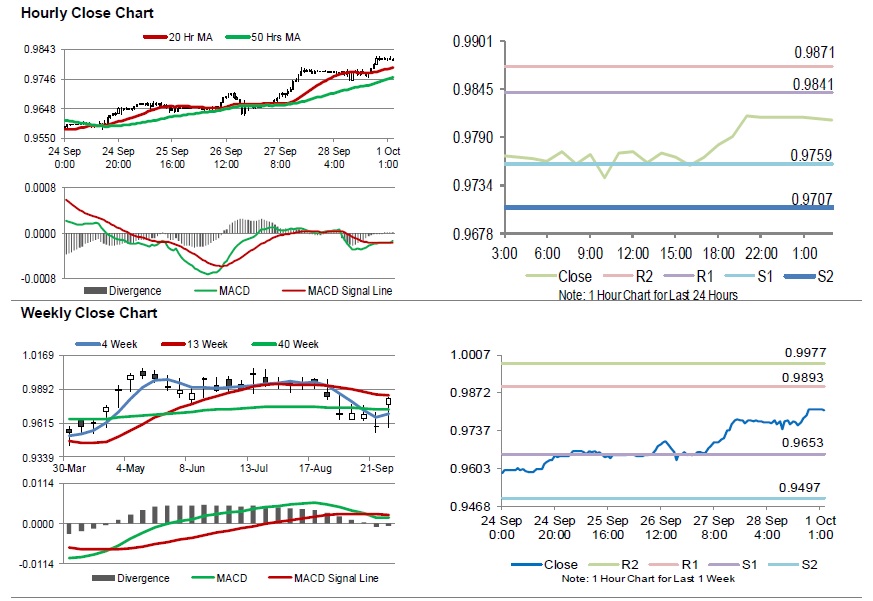
The pair is expected to find support at 0.9759, and a fall through could take it to the next support level of 0.9707. The pair is expected to find its first resistance at 0.9841, and a rise through could take it to the next resistance level of 0.9871.
Looking ahead, investors would closely monitor Switzerland's real retail sales data for August and the manufacturing PMI for September, scheduled to release in a while.
The currency pair is trading above its 20 Hr and 50 Hr moving averages.