Sample Category Title
EUR/USD Back To Square One, Bears In Control
Key Highlights
- The Euro trimmed most of its gains and declined below the 1.1650 support against the US Dollar.
- There was a break below a crucial bullish trend line with support at 1.1730 on the 4-hours chart of EUR/USD.
- The US Personal Income in August 2018 increased 0.3%, less than the forecast of +0.4% (MoM).
- Today, the US ISM Manufacturing Index for Sep 2018 will be released, which is forecasted to decline from 61.3 to 60.5.
EURUSD Technical Analysis
The Euro traded towards the 1.1780-1.1800 resistance this past week against the US Dollar. The EUR/USD pair failed to clear the 1.1800 resistance and started a sharp downside move.
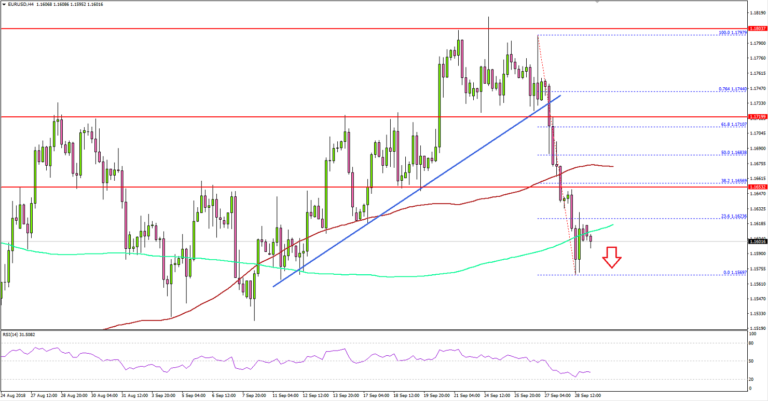
Looking at the 4-hours chart, the pair declined heavily and broke the 1.1720 and 1.1650 support levels. There was even a close below the 1.1650 support and the 100 simple moving average (red, 4-hours).
The downside move was initiated after the pair broke a crucial bullish trend line with support at 1.1730. The decline was such that the Euro spiked below the 1.1600 level and traded towards 1.1560.
At the moment, the pair is consolidating losses with an immediate resistance near the 1.1650 level (the previous support). It also coincides with the 38.2% Fib retracement level of the recent decline from the 1.1797 high to 1.1570 swing low.
Above 1.1650, the next key resistance is at 1.1675 and the 100 simple moving average (red, 4-hours). The most important hurdle for buyers is at 1.1685 and the 50% Fib retracement level of the recent decline from the 1.1797 high to 1.1570 swing low.
On the downside, a break and close below the 1.1560 support will most likely push the pair towards the 1.1520 support in the near term.
Economic Releases to Watch Today
- Germany's Manufacturing PMI for Sep 2018 – Forecast 53.8, versus 53.7 previous.
- Spanish Manufacturing PMI for Sep 2018 – Forecast 52.5, versus 53.0 previous.
- Euro Zone Manufacturing PMI Sep 2018 – Forecast 53.3, versus 53.3 previous.
- UK Manufacturing PMI for Sep 2018 – Forecast 53.8, versus 52.8 previous.
- US ISM Manufacturing Index for Sep 2018 – Forecast 60.5, versus 61.3 previous.
- US Manufacturing PMI for Sep 2018 – Forecast 55.4, versus 55.6 previous.
EURUSD Remain Vulnerable, Bear Pressure Eyes 1.1550/25 Zone
EURUSD remains vulnerable to the downside following its past week lower close. This development has opened the door for more weakness in the days ahead. On the upside, resistance comes in at 1.1650 level. A break through there opening the door for more upside towards the 1.1700 level. Further up, resistance lies at the 1.1750 level where a break will expose the 1.1800 level. But, support lies at the 1.1550 level where a violation will aim at the 1.1500 level. A break of here will aim at the 1.1450 level. Below here will open the door for more weakness towards the 1.1400. All in all, EURUSD still faces further downside pressure. 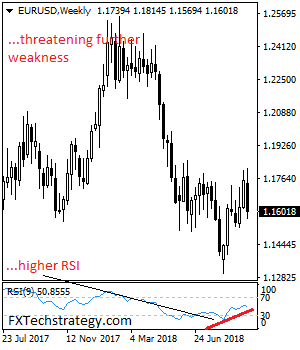
NAFTA Down To The Wire
USDCAD hit a fresh 4-month low at 1.2850 amid optimism over a NAFTA deal following Friday's gains, which were triggered by strong GDP numbers. NAFTA negotiators are pressing to meet a Sunday deadline to complete a trilateral deal. News reports say nearly all of the substantial work is finished. CFTC positioning showed yen shorts at the highest since March as USD/JPY hits a 9-month high. A new CAD trade for premium clients has been issued accompanied by 5 important reasons (especially 2 & 3).
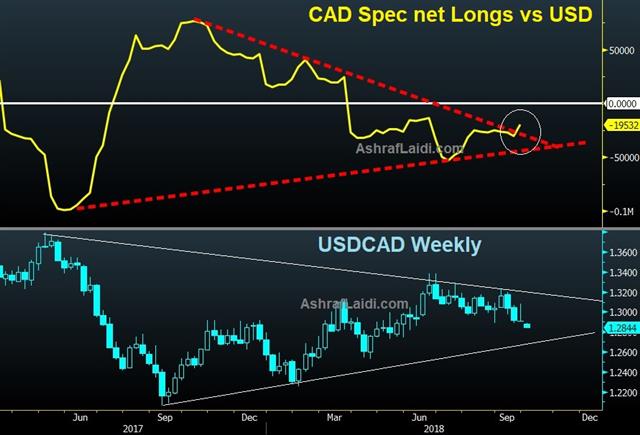
USD/CAD fell 135 pips on Friday and closed on the lows on very-late breaking news that Mexico was making a final push. The pair finished at 1.2908 and has an August/Sept double bottom near 1.2885 that is certain to be broken in a move that may clear the way for a sustained Canadian dollar rally. But the 200-DMA of 1.2870 has so far been broken.
If a deal is struck, especially one that precludes auto tariffs against Canada, could be a massive tailwind for Canada. If a US-China trade war continues as expected, the winner is Canada, who will be selling things to both sides tariff free.
Recall, the latest round of tariffs against China went into effect last week includes 5,750 product lines that cover about $200 billion of annual Chinese exports to the US. In those categories alone, Canada exports $158 billion to the US. That's easily more than any other country or region.
Also on the weekend, the China PMIs showed a dip in manufacturing but a rise in the non-manufacturing surveys.
The manufacturing survey was at a seven-month low of 50.8 compared to 51.2 expected. Non-manufacturing rose to the highest since June at 54.9 compared to 54.0 expected. Aside from CAD and MXN trading, watch for a soggy start to the week in Asia as Typhoon Trami bears hits Japan.
CFTC Commitments of Traders
Speculative net futures trader positions as of the close on Tuesday. Net short denoted by - long by +.
EUR +4K vs +2K prior GBP -67K vs -79K prior JPY -85K vs -64K prior CHF -16K vs -18K prior CAD -20K vs -30K prior AUD -72K vs -68K prior NZD -32K vs -32K prior
Cable shorts came down from an extreme just as the pair rolled over last week. However yen shorts were perfectly timed as the pair ripped higher after the FOMC.
USD Is Still Very Data-Dependent , So It Will Be Tricky To Trade
US Rates
The markets are pricing in a higher probability of the terminal rate over 3.5%, signalling a convincingly hawkish view from last week FOMC. Chair Powell's language around a healthy economy while emphasising data dependency suggests the Fed will continue to hike well into the restrictive territory or at least until the data weakens. It appears Powell is not a big fan of FOMC forward guidance and sees interest rate condition too loose. But when considering labour market tightness, which should eventually drive inflation higher, the markets are far too sceptical and now reversing out some of that pessimism as the Fed's appear on course to raise quarterly interest rates for the foreseeable future.
Currency Markets
G-10 focus on CAD, EUR and JPY
The USD is still very data-dependent so even with a hawkish nod from the Fed the US Dollar will be tricky to trade.
NAFTA
Bloomberg is reporting U.S. and Canadian negotiators are close to a deal on NAFTA and there's optimism it will be reached by the Sunday deadline — an outcome that would avoid an impasse that imperils $500 billion in annual trade, people familiar with the talks said.
There's renewed urgency to nail down a new North American Free Trade Agreement that could be published by Sunday, so Mexican President Enrique Pena Nieto can sign it before he leaves office, the people said. The U.S. and Mexico reached their agreement in August, triggering talks between the U.S. and Canada, which are being held around the clock this weekend. (Bloomberg)
Bloomberg
My View: steveinnes123
What's interesting about this latest twist, is that The U.S. trade representative was expected to post text online this weekend that will lay out more of what Mexico has agreed to so far in NAFTA2. But the text was supposed to exclude details about Canada. Since the version was never posted online, could US trade representatives be holding it back, so they can post one for a trilateral agreement which includes a Canada provision? A lot of smoke signals on this call, and where there's smoke there's usually fire.
The Canadian Dollar
The implication for the Canadian dollar is enormous. Given the stellar GDP print last week, a data-dependent BoC governor Poloz, and skyrocketing oil prices, 1.28's would seem like a lock. But with commodity Bloc of currencies expected to receive a fillip from rising hard and soft commodity prices, perhaps there is even more juice to be squeezed out if the Canadian dollar.
Mind you. I still find any deal on the eve of the Quebec, October 1, a bit of a stretch given the Liberal political fallout ( provincial and federal)from any concessions around the dairy industry, as the bulk of Canada's Milk industry is based in Quebec. The most recent IPSOS poll shows the provincial Liberals and Coalition Avenir Quebec in a dead heat. Quebec produces about 50 per cent of Canada's dairy, and its agricultural sector is roughly the size of Ontario's automotive industry. None the less the market remains on NAFTA watch.
The Euro
The Italian budget aside, since EU inspired political wobbles do tend to have a very short half-life effect on Euro sentiment, higher US interest rate expectation amidst the backdrop of divergence between the Fed and the ECB, even more so after the tepid Eurozone inflation print on Friday, will underpin US dollar sentiment. The eurozone economic recovery is so uneven that the EURUSD could move lower for no other reason that the robust US economic story. Traders will probably look to re-engage EURUSD shorts on upticks.
The Japanese Yen
If the NKY and US 10 y yields continue to track higher, there is no reason the markets shouldn't take out 114 this week. However, counter to my original thoughts that the USDJPY was an under-owned position, the latest CFTC data is painting a decidedly different picture as Yen shorts are at the highest level since early March. However, these derivative positions could have different paths of dependency than strictly the USD. So with US interest rates set to rise for the foreseeable future albeit with caveats that the US economy doesn't go into the tank, Regardless, with US interest rates set to rise for the foreseeable future albeit with caveats that the US economy doesn't go into the tank, USDJPY should move higher.
The Australian Dollar
Much more focus on the US rates outlook in the wake of the FOMC, and this plays into the USD ‘s hand short term. I think the markets are tricky as USD moves are entirely data dependent. While the RBA rate decision is on tap, there will be an outsized focus on next weeks NFP but more toward wage growth component as by all account the US job growth is rocking, but the Feds are looking for that elusive inflation spark. But this is where I temper my bearish Aussie expectations. With commodity prices going higher, this will undoubtedly be a boon for commodity-linked currencies so against a lot of forecasts I see the Aussie moving higher on that narrative alone.
Asia EM
Malaysian Ringgit
The two primary competing narratives, surging Oil Prices vs higher US interest rates should see the MYR trading with a neutral to negative bias this week. The fact that there has been limited positive follow through from skyrocketing oil prices suggests investors remain incredibly nervous about the rising US dollar and higher US interest rates. Mind you my views up until last weeks FOMC was swinging like a pendulum on the Ringgit, but with Chair Powell making headway for Fed hawkishness, in contrast with a neutral to dovish BNM bias, my MYR lean is shifting negative over the short term.
Non-Farm Payroll already in focus
Little more than a week after the FOMC, Friday's US Non-Farm Payrolls take on the tremendous importance for near-term USD momentum as a critical focus will fall on US wages, and how quickly they expanded in September could have a significant impact on the projected course of US interest rates. Indeed, this week will probably go out with another sonic boom!
US Equity Markets: higher US interest rates should eventually factor.
US equity markets remain on solid footing supported by the impervious tech sector. For the time being US stock markets are showing incredible reliance in the face of higher interest rates and a possible escalation in the US-China trade war, as markets remain buoyed by the robust domestic economy. But at some point, the disconnect between the US and the rest of the world economies will flow through the asynchronous global growth feedback loop. But when you start factoring in higher US interest rates and the Feds dogged determination to drain the punch bowl, we could be nearing that turning point as the markets have been living on cheap borrowed money for some time. Eventually, higher US interest rates will become a significant negative factor.
China Markets: Manufacturing PMI wobbles
Not surprisingly China's official factory barometer decelerated more than expected in September, while the index for services and construction unexpectedly picked up.
The manufacturing PMI registered a disappointing 50.8 in September versus 51.3 in August, lower than Bloomberg survey median estimate of 51.2, but remains marginally above contraction. But the non-manufacturing PMI picked up to 54.9, versus 54.2 in August, so a bit of saw off, even more so when you factor that China is de-emphasising exports in favour of domestic demand.
While tariffs are causing some fraying at the brick and mortar level, China continues to support the demand side of the equation so while the manufacturing PMI is weak, the decline is not entirely uncontrollable.
Oil Markets
Brent crude finished the quarter most spectacularly as the potential impact of US sanctions on Iranian exports continued to mount on a report that at least one Chinese refinery was cutting back on purchases.
As reported by Reuters Singapore on Friday:
“China's Sinopec Corp is halving loadings of crude oil from Iran this month, as the state refiner comes under intense pressure from Washington to comply with a U.S. ban on Iranian oil from November, said people with knowledge of the matter.”
Reuters
Show me the barrels
So, given the evolving China refinery narrative, until sizable supply is offered up by OPEC, ultimately traders will continue to push the envelope even more so with rampant speculation running amok that US$ 100 per barrel Brent is not just an oil pipe dream
So, what's the next bullish catalyst?
Over the weekend U.S. President Donald Trump called Saudi Arabia's King Salman, and they discussed efforts being made to maintain supplies for the market, stability and global economic growth, state news agency SPA reported late on Saturday.
But let's make no mistake, higher oil prices bring tears of joy to oil producer including those in Texas and Oklahoma. And while Saudi Arabia continues to make concessionary overtones, but the real question is even if they wanted to bend to President Trumps wishes, how much spare capacity does the Kingdom have? We're going to find that out very soon as approximately 1.5 million barrels of Iranian oil is effectively going offline on November 4. If the market senses that Saudi Arabia capacity is tapped out at 10.5 million barrels per day, despite their fabled bottomless well, oil prices will rocket higher with the flashy $ 100 per barrel price tag indeed a reasonable sounding target.
The Middle East powder keg
The Middle East smouldering embers are set to ignite again as the New York Times reported that the US is evacuating its consulate in Southern Iraq because of attacks in recent weeks by militias supported by the Iranian government.“Iran should understand that the United States will respond promptly and appropriately to any such attacks,” Mr Pompeo said in the statement
The New York Times
At a minimum, this could derail any of those thoughts Tehran had of circumventing US sanctions by making side deals to supply oil to Europe. At maximum, further escalations by Iranian backed militias could see the US administration foreign policy hawks take flight. And don't take John Bolton's comments at the UN general assembly as an idle threat, ” If you cross us, our allies, or our partners; if you harm our citizens; if you continue to lie, cheat, and deceive, yes, there will indeed be hell to pay.” Bolton is foreign policy hawk #1 and is all business when to comes to beating war drums, even more so when Any signs of growing unrest Iran is the target. Political noise in the middle east is usually positive for oil prices.
Gold Markets
A reality check as spot gold sold off very aggressively as the US dollar started to reassert itself on Friday. For the past three months, gold has traded more like a currency rather than a go-to safe have an asset. With the Euro tumbling head over heels, the $1190 trap door gave way and selling intensified as stop losses triggered, and short-term leveraged players raced to get downside exposure. However, the sub $1190 move was retraced heading into the weekend as the traders realised they were neck deep in oversold territory and frankly, they ( we) needed the weekend to reflect on what just happened!!
It could be a make or break week for golds near-term ambitions, and the story will likely unfold at Friday's US Non-Farm Payrolls release.
Gold has been a seller's market for some time, but with $1190 level yielding, we're now firmly in the gold bear zone and as such with the USD dollar likely to strengthen on the back of widening interest rates differentials, selling activity could intensify with speculators likely to target the August low when the yellow metal hit $1160 before rebounding.
Eco Data 10/1/18
[php_everywhere instance="1"]
Forex Forecast and Cryptocurrencies Forecast
First, a review of last week’s events:
EUR/USD. As expected, the last week had a lot of trouble for both the euro and the US dollar. The pair visited both the upper and lower boundaries of the medium-term side corridor 1.1525-1.1830 during the last five days. In the end, the victory was with the dollar. The reason for this were the Fed meeting results, along with the growth of US GDP and inflation in the Eurozone, as well as problems in Italy, whose government published the budget for 2019. with a deficit of 2.4% (instead of the expected 2%). As a result, having shown volatility of 245 points, the pair completed the weekly session at 1.1602;
GBP/USD. Recall that last week 55% of experts voted for the growth of this pair, 30% gave their votes for its fall, and the remaining 15% were for a sideways trend. And this discrepancy turned out to be the most accurate forecast. The pair was rising for the first half of the week, reaching 1.3225 at the maximum, and was going down during the second half, feeling for a local bottom near the level of 1.3000. As a result, it went down by only 45 points during the five working days, finishing at 1.3030;
USD/JPY. The scenario, for which 40% of analysts, graphical analysis on D1 and 100% of trend indicators had voted, provided for the pair to grow to the area of 113.20-113.75. And the pair did grow indeed, reaching the high at 113.70.
The reason for the fall of the yen were the statements of the head of the Bank of Japan Haruhiko Kuroda and the head of the US Federal Reserve, Jerome Powell. The first of them said that the Japanese regulator did not plan to curtail the mitigation policy. Moreover, the interest rate, which is now minus 0.1%, can be lowered further. As for Powell, he confirmed at a press conference that, in addition to the increase on Wednesday, September 26, the Fed was planning another increase in interest rates in 2018 and three more increases in 2019.
In this situation, the reaction of the markets was predictable: the dollar continued its active growth and met the end of the week at 113.68;
Cryptocurrencies. There was no special news that could seriously move the crypto market in one direction or another last week. The cryptocurrencies included in the TOP-10 behaved accordingly. During the first half of the week, the bitcoin showed a 7.5% drop, followed by a 7.25% increase. As a result, the pair BTC/USD did not leave the range between $6,000 and $7,000, keeping in an even narrower channel, $6,325-6,835. The litecoin (LTH / USD) and the ripple (XRP/USD) are closing the week almost at the same place where they started it. It was only the ethereum (ETH/USD) that showed a drop of 8% during the seven days, dropping to $225.0 per coin, and is now at the level of September 6-7.
As for the forecast for the coming week, summarizing the opinions of a number of analysts, as well as forecasts made on the basis of a variety of methods of technical and graphical analysis, we can say the following:
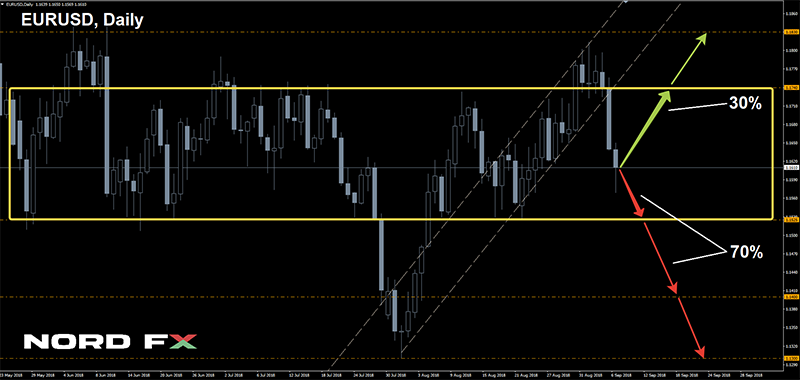
EUR/USD. The overwhelming majority of experts (70%), supported by 95% of the trend indicators, are voting for further strengthening of the dollar and decline of the pair first to support 1.1525, and to the August low at 1.1300 during the month of October.
An alternative scenario has been supported by 30% of analysts and 20% of oscillators giving signals the pair is oversold. If we supplement their forecast with graphical analysis indications on H4 and D1, we can say that the growth of the pair will be limited by the upper boundary of the medium-term horizontal channel 1.1525-1.1830. The nearest target for bulls is the level of 1.1740.
As for the release of macroeconomic data, we should pay attention to the statistics on the US labor market on Friday, October 5, including the data on wages, unemployment and NFP. The consensus of American analysts predicts that the number of new jobs created outside the agricultural sector will be 8% less than the August values, which may lead to a slight weakening of the dollar;
GBP/USD. 55% of experts vote for the fall of this pair to the level of 1.2900, 25% are for its growth to the area of 1.3100-1.3145, and the remaining 20% have taken a neutral position. The reasons for such a preponderance of votes given for the further weakening of the pound are still the same: deterioration in the UK's economic performance and the uncertainty with Brexit.
The indicators' reading. If most of the oscillators and trend indicators are colored red on H4, about 30% are already green on D1. At the same time, about 20% of the oscillators on both timeframes indicate the pair is oversold. There is no unity in the readings of graphical analysis either: on D1, it clearly demonstrates the movement of the pair down to zone 1.2800-1.2845, and on H4 it draws a side channel 1.2980-1.3175 for the pair;
USD/JPY. Here the voices are split exactly in half. 50% of experts, supported by graphical analysis on D1 and 100% of trend indicators, believe that the upward momentum is not yet exhausted, and the pair must necessarily reach a height of 114.50.
The second half of the experts expect a serious correction and the fall of the pair to support 112.00. 15% of the oscillators are also signaling that the pair is overbought, which is in favor of such a scenario;
Cryptocurrencies. The capitalization of the crypto market as a whole has not crossed the mark of $ 250 billion, but the growth of major cryptocurrencies rates is on good volumes, indicating that the bulls are gradually gaining strength. The ripple (XRP) and the bitcoin cash (BCH) are those two altcoins that inspire investors at the moment, giving them hopes for a better future. The ripple has risen more than twice over the past three weeks, and the bitcoin cache has gone up by 30%.
Instant transfers based on protocols from Ripple are more and more likely to take away a "piece of pie" from the SWIFT system which is now reigning in the banking sector. There is an opinion that such blockchain technologies are financed by corporations wishing to hide their funds in the depths of "digital offshore companies " instantly, deeply and reliably. On the contrary, an alternative point of view ascribes the authorship to US special services, whose goal is the total control over all the world money flows. It is not known which of these theories is true, but, in any case, such virtual currencies as ripples have a weighty basis for growth.
Whether the crypto market capitalization comes close to the $300 billion mark in the near future, whether the bitcoin exceeds the $7,000 mark, dragging the altcoins up with it, depends now solely on the news background. If there are no positive news, the movement in the range of $6,000-7,000 (or in a narrower channel - $6,325-6,835) is the most likely scenario.
EUR/USD Weekly Outlook
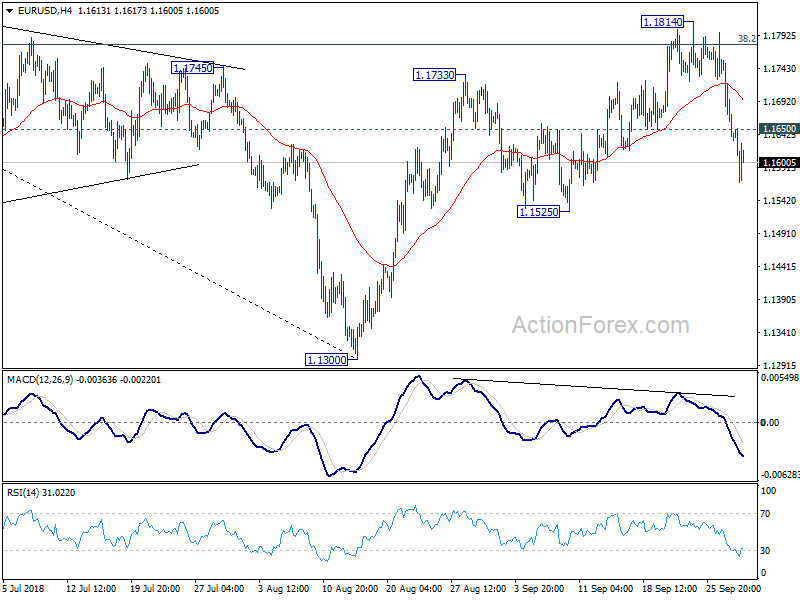
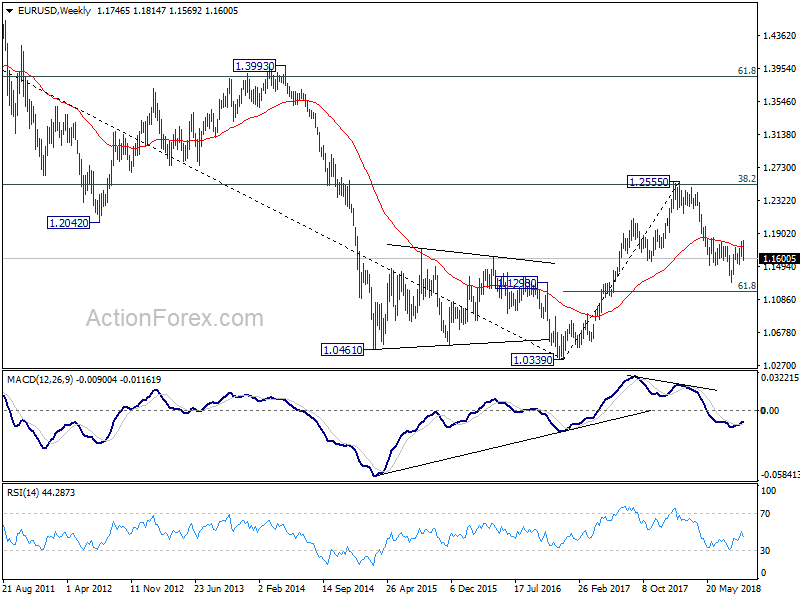
EUR/USD's sharp decline last week argues that corrective rise from 1.1300 has completed at 1.1814. That came after failing to sustain above 38.2% retracement of 1.2555 to 1.1300 at 1.1779, on bearish divergence condition in 4 hour MACD. Initial bias stays on the downside this week for 1.1525 support first. Break should confirm this bearish case and target a test on 1.1300 low first. On the upside, above 1.1650 minor resistance will turn intraday bias neutral and bring recovery. But upside should be limited well below 1.1814 to bring fall resumption.
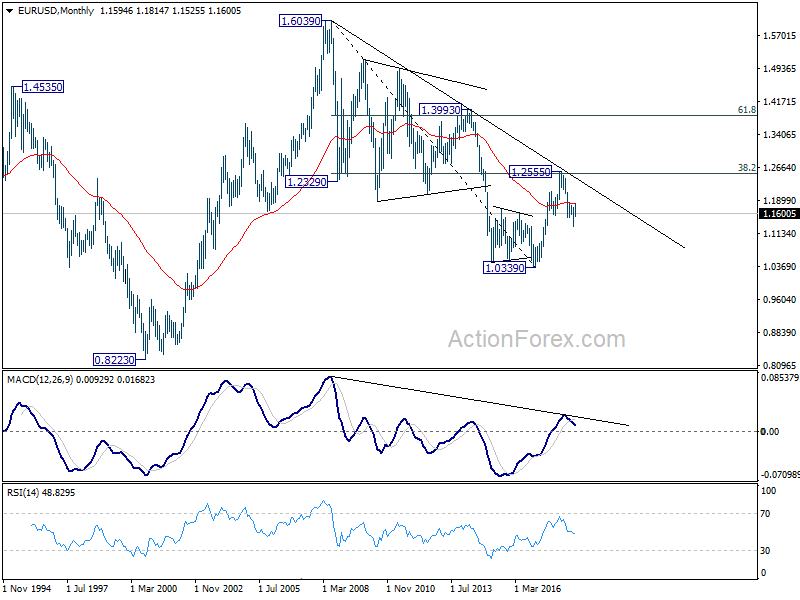
In the bigger picture, a medium term bottom should be in place at 1.1300, on bullish convergence condition in daily MACD and some consolidations would be seen. But still, note that EUR/USD was rejected by 38.2% retracement of 1.6039 (2008 high) to 1.0339 (2017 low) at 1.2516. That carries some long term bearish implications. Thus, we'd expect fall from 1.2555 high to resume after consolidation completes. Below 1.1300 should send EUR/USD through 61.8% retracement of 1.0339 to 1.2555 at 1.1186. And, in that case, EUR/USD would head to retest 1.0339 (2017 low).
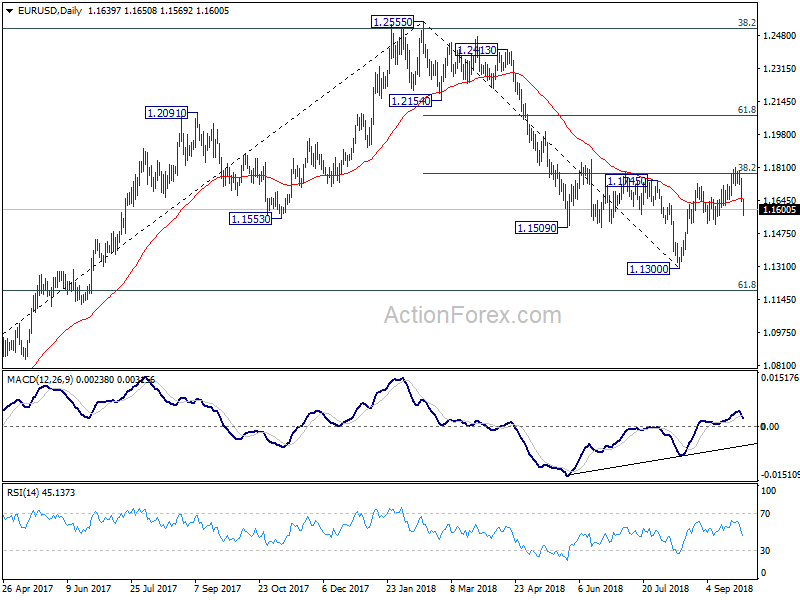
In the long term picture, the rejection from 38.2% retracement of 1.6039 to 1.0339 at 1.2516 argues that long term down trend from 1.6039 (2008 high) might not be over yet. EUR/USD is also held below decade long trend line resistance. Firm break of 61.8% retracement of 1.0339 to 1.2555 at 1.1186 should at least bring a retest on 1.0339 low.
USD/JPY Weekly Outlook
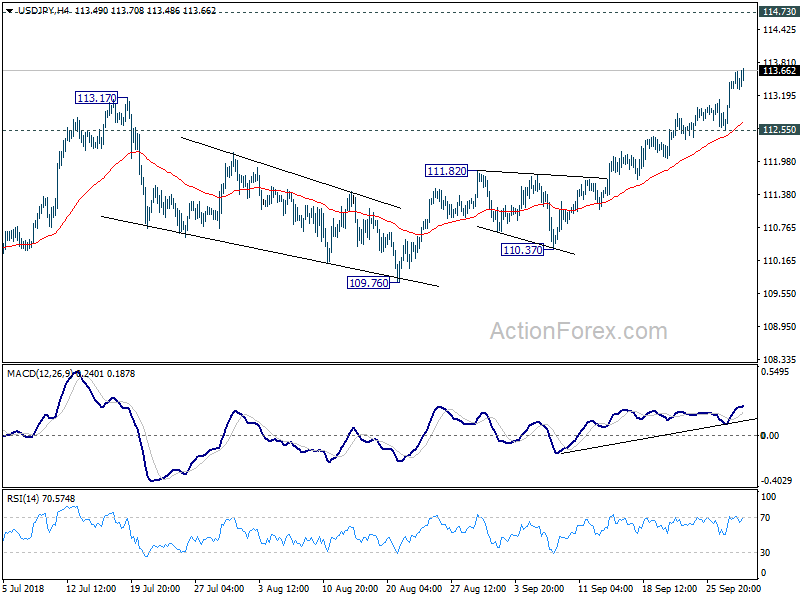
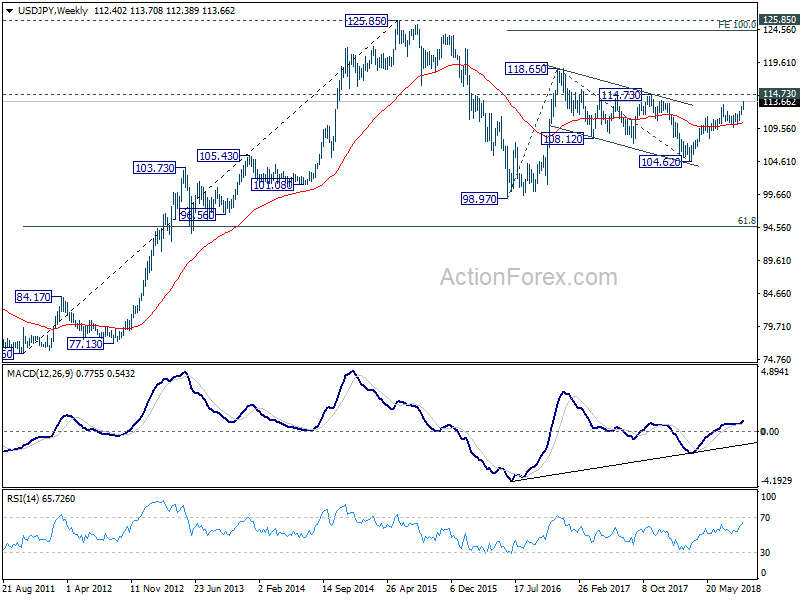
USD/JPY surged to as high as 113.70 last week. The break of 113.17 resistance confirms resumption of whole rise from 104.62. Initial bias stays on the upside for 114.73 resistance next. Decisive break there will confirm larger bullish case. On the downside, break of 112.55 support is needed to indicate short term topping. Otherwise, near term outlook will remain bullish in case of retreat.
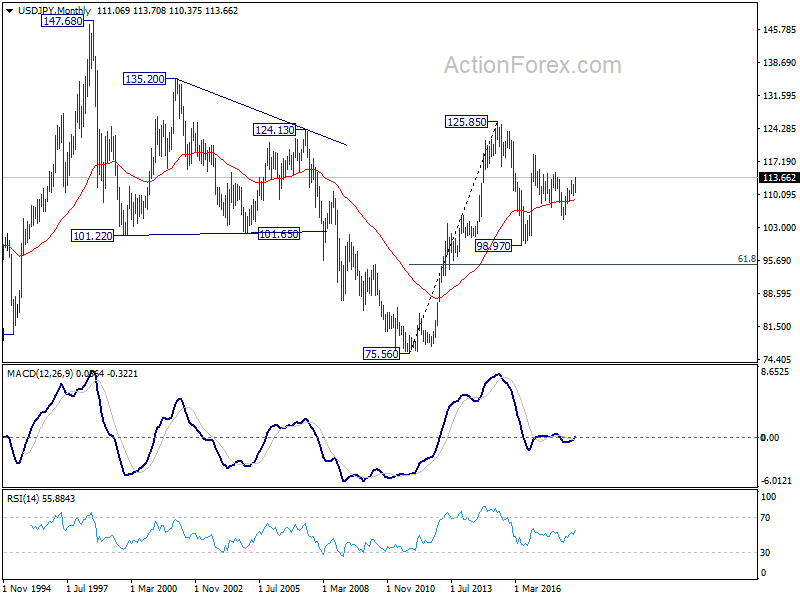
In the bigger picture, corrective fall from 118.65 (2016 high) should have completed with three waves down to 104.62. Decisive break of 114.73 resistance will likely resume whole rally from 98.97 (2016 low) to 100% projection of 98.97 to 118.65 from 104.62 at 124.30, which is reasonably close to 125.85 (2015 high). This will stay as the preferred case as long as 109.76 support holds.
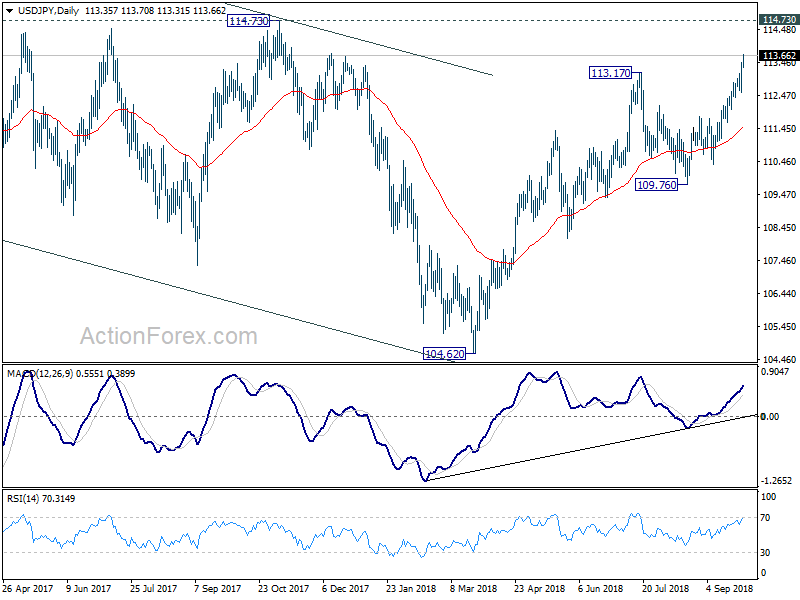
In the long term picture, the rise from 75.56 (2011 low) long term bottom to 125.85 top is viewed as an impulsive move, no change in this view. Price actions from 125.85 are seen as a corrective move which could still extend. In case of deeper fall, downside should be contained by 61.8% retracement of 75.56 to 125.85 at 94.77. Up trend from 75.56 is expected to resume at a later stage for above 135.20/147.68 resistance zone.
GBP/USD Weekly Outlook
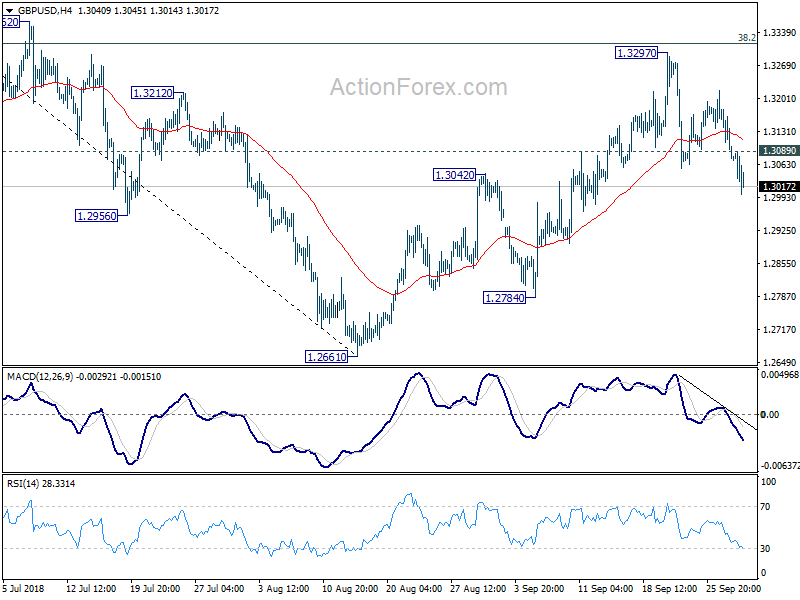
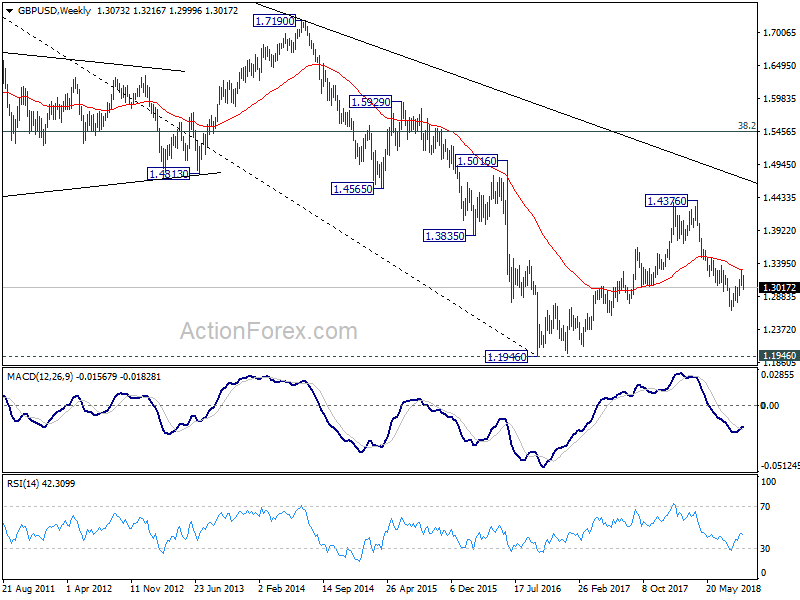
GBP/USD's fall from 1.3297 extended last week and the break of 1.3042 support should confirm our bearish view. that is, corrective rise from 1.2661 has completed with three waves up to 1.3297, ahead of 1.3316 key fibonacci level. Initial bias stays on the downside for 1.2784 support first. Break there will likely resume larger down trend from 1.4376 through 1.2661 low. On the upside, above 1.3089 minor resistance will turn intraday bias neutral and bring consolidation, before staging another decline.
In the bigger picture, whole medium term rebound from 1.1946 (2016 low) should have completed at 1.4376 already, after rejection from 55 month EMA (now at 1.4099). The structure and momentum of the fall from 1.4376 argues that it's resuming long term down trend. And this will be the preferred case as long as 38.2% retracement of 1.4376 to 1.2661 at 1.3316 holds. However, firm break of 1.3316 would bring stronger rebound to 61.8% retracement at 1.3721. And, the eventual depth of the fall from 1.4376, and the chance of hitting 1.1946 low, will depend on the strength of the interim corrective rebound from 1.2661.
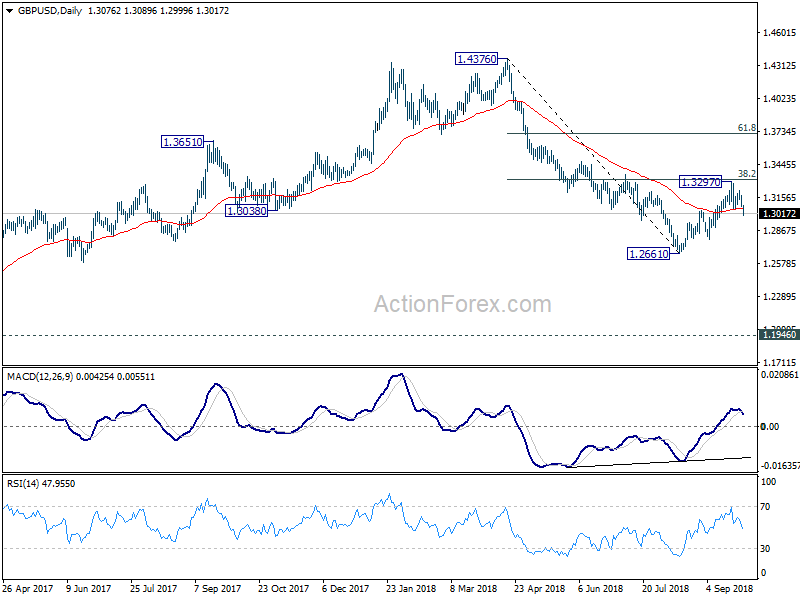
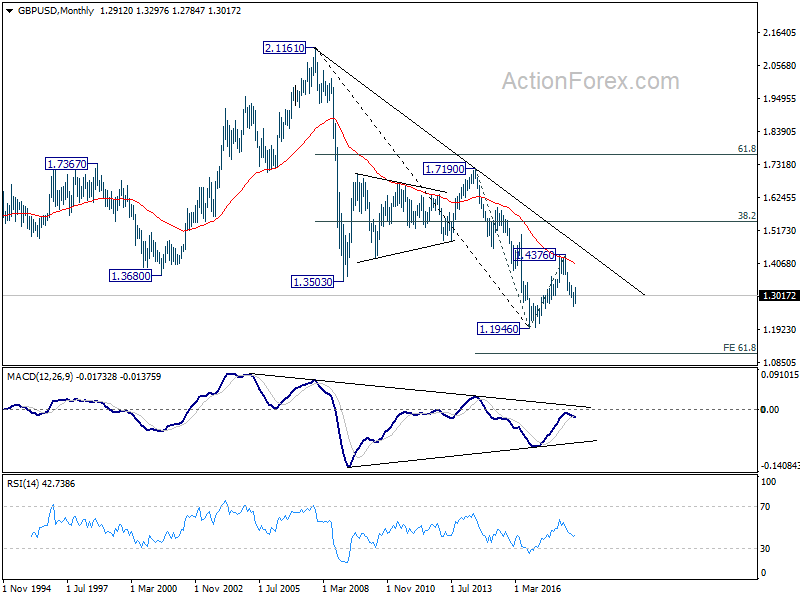
In the longer term picture, outlook in GBP/USD is held bearish. Rebound from 1.1946 was rejected solidly by falling 55 month EMA. The pair was limited well below 38.2% retracement of 2.1161 (2007 high) to 1.1946, as well as the decade long falling trend line. On break of 1.1946, next target will be 61.8% projection of 1.7190 to 1.1946 from 1.4376 at 1.1135.
USD/CHF Weekly Outlook
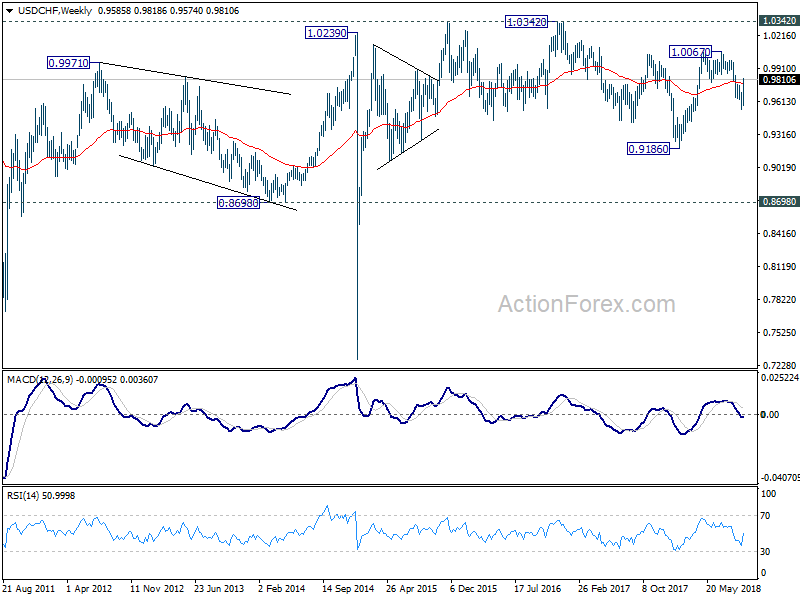
USD/CHF surged to as high as 0.9818 last week. The development confirmed near term reversal level. Initial bias stays on the upside this week for 0.9866 key resistance level, 61.8% retracement of 1.0067 to 0.9541 at 0.9866. Decisive break there will bring retest of 1.0067 high. On the downside, below 0.9736 minor support will turn intraday bias neutral first.
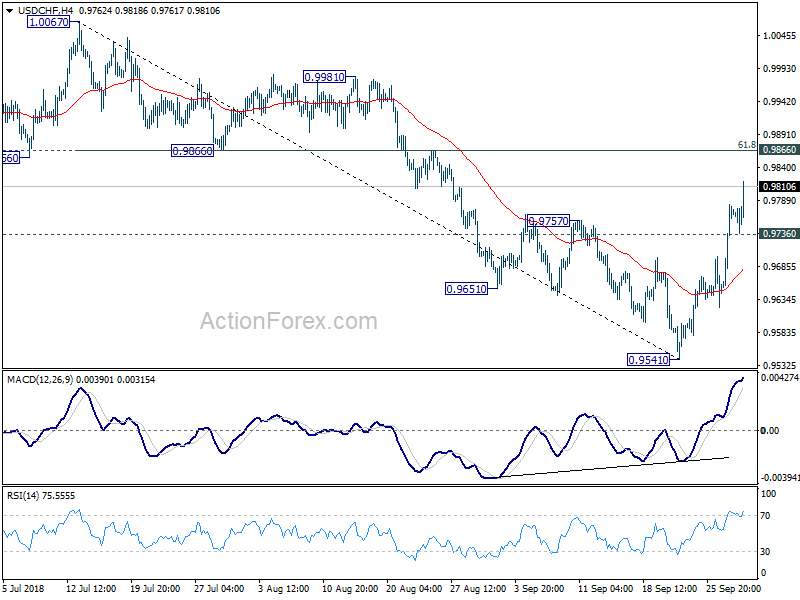
In the bigger picture, focus is now back on 0.9866 support turned resistance. Decisive break there will suggests that pull back from 1.0067 has completed at 0.9541. And larger rise from 0.9186 low is ready to resume. Decisive break of 1.0067 will pave the way to 1.0342 key resistance next. Meanwhile, break of 0.9541 will extend the decline but we don't expect a break of 0.9186 low even in that case.
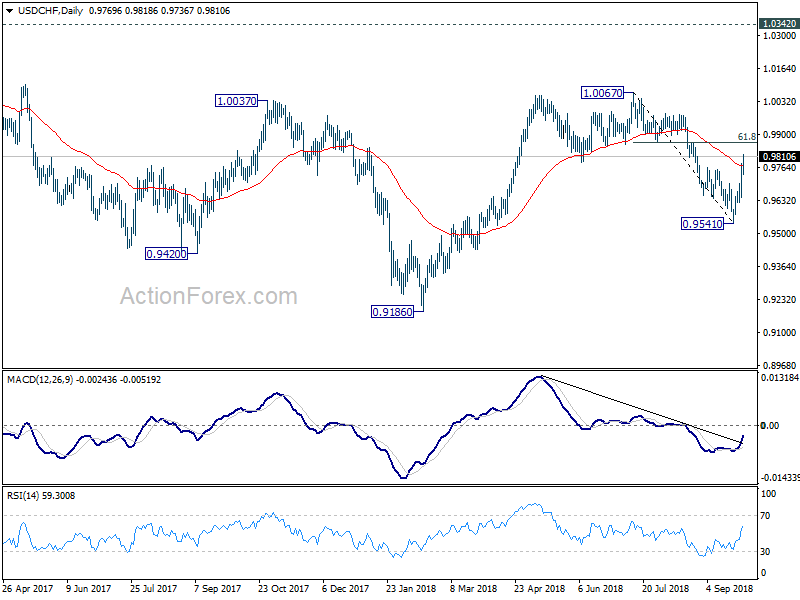
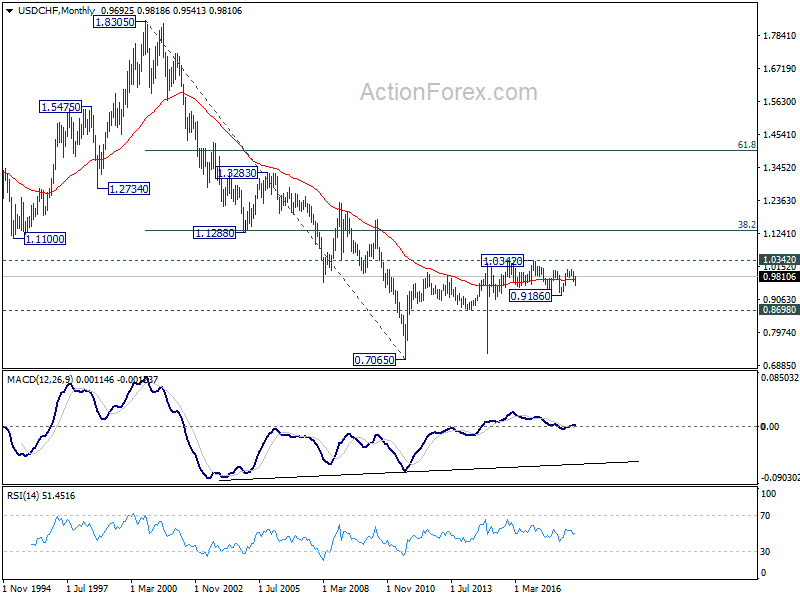
In the long term picture, price actions from 0.7065 (2011 low) are not clearly impulsive yet. Thus, we'll treat it as developing into a corrective pattern, at least, until a firm break of 1.0342 resistance.