Sample Category Title
AUD/USD Weekly Outlook
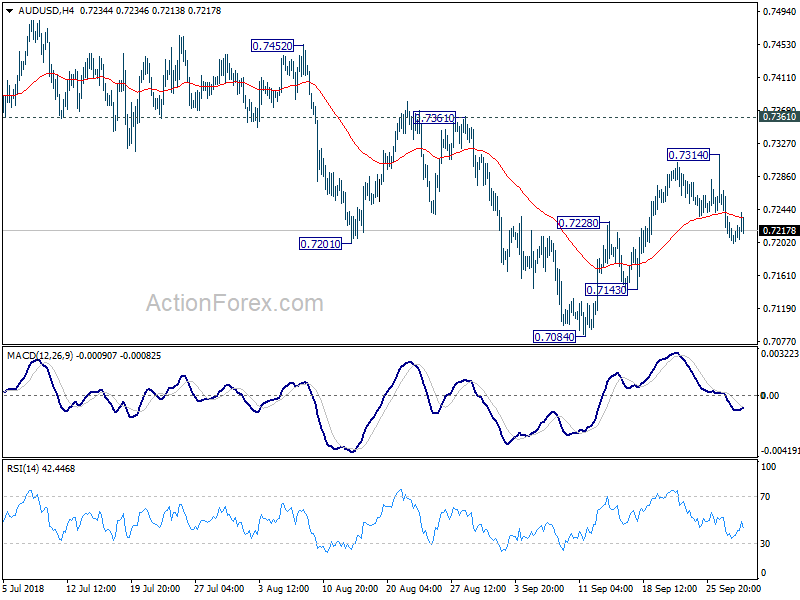
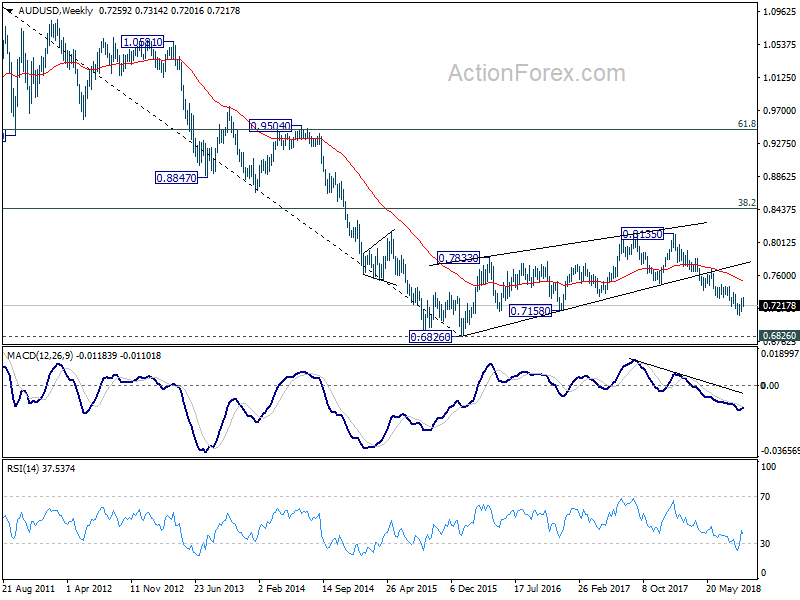
AUD/USD's break of 0.7228 resistance turned support suggests that corrective rebound from 0.7084 has completed at 0.7314 already. Initial bias stays on the downside for 0.7143 support first. Break should resume whole decline from 0.8135 through 0.7804 support. In case of another rise, upside should be limited well below 0.7361 resistance to complete the correction and bring down trend resumption.
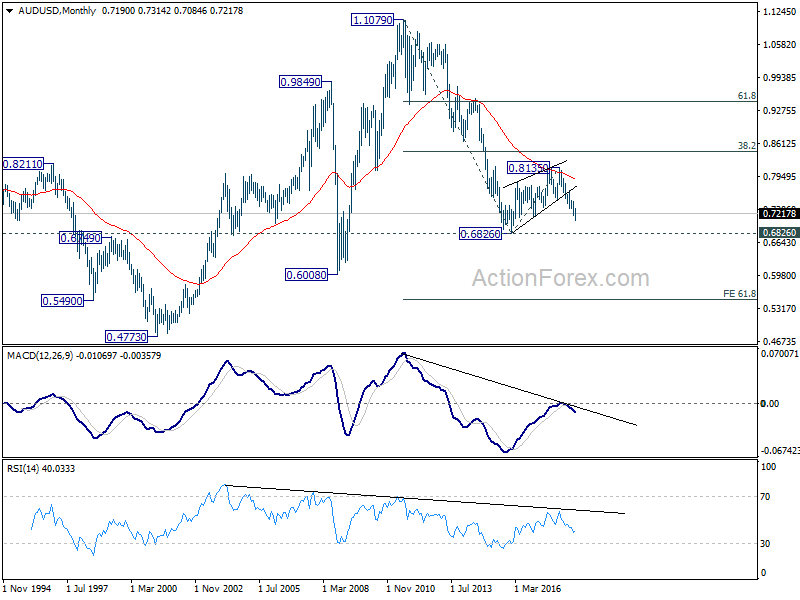
In the bigger picture, rebound from 0.6826 (2016 low) is seen as a corrective move that should be completed at 0.8135. Fall from there would extend to have a test on 0.6826. There is prospect of resuming long term down trend from 1.1079 (2011 high). Current downside momentum as seen in weekly MACD support this bearish case. Firm break of 0.6826 will target 0.6008 key support next (2008 low). On the upside, break of 0.7361 resistance, however, argues that a medium term bottom is possibly in place, and stronger rebound could follow. We'll assess the medium term outlook later if this happens.
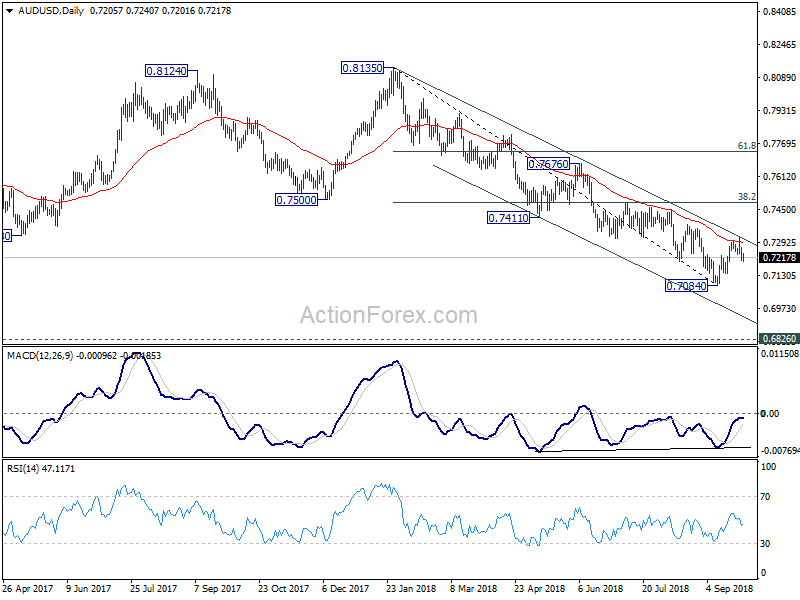
In the longer term picture, the corrective structure of rebound from 0.6826 (2016 low) to 0.8135, and the failure to break 38.2% retracement of 1.1079 (2011 high) to 0.6826 at 0.8451, carry bearish implications. AUD/USD was also rejected by 55 month EMA. Now, the down trend from 1.1079 is in favor to extend. On break of 0.6826, next target will be 61.8% projection of 1.1079 to 0.6826 from 0.8135 at 0.5507.
USD/CAD Weekly Outlook
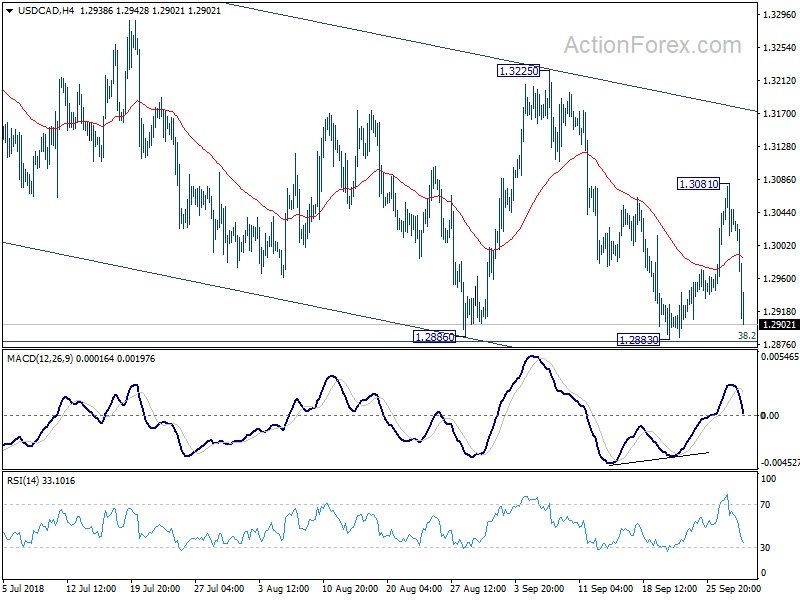
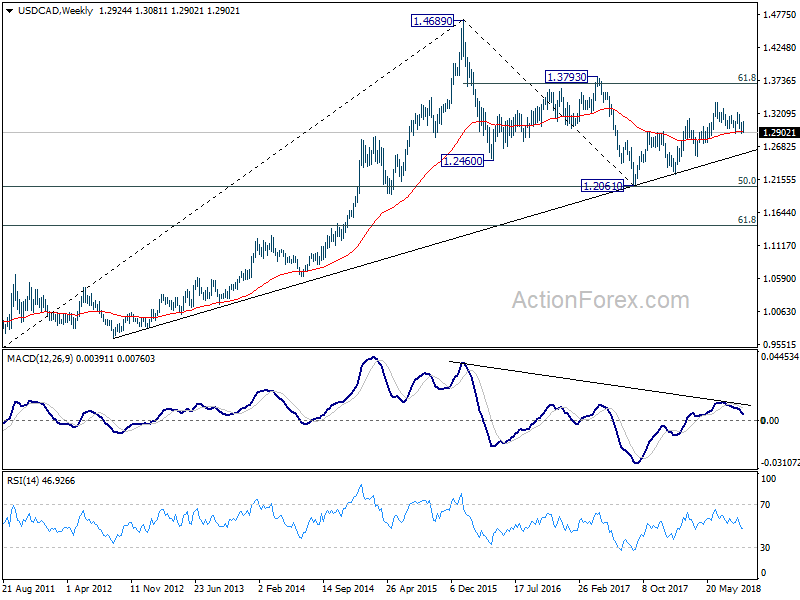
Despite edging higher to 1.3081, USD/CAD reversed from there and dropped sharply. Initial bias is now on the downside for 1.2883 support this week. Based on current momentum, this support will likely be taken out. In that case, whole decline from 1.3385 should resume for 50% retracement of 1.2061 to 1.3385 at 1.2723 next. On the upside, break of 1.3081 resistance is needed to indicate short term bottoming. Otherwise, deeper decline will now be mildly in favor.
In the bigger picture, focus is back on 38.2% retracement of 1.2061 to 1.3385 at 1.2879 key fibonacci level. As long as it holds, rise from 2017 low at 1.2061 is still in progress. Break of 1.3384 should target 61.8% retracement of 1.4689 (2015 high) to 1.2061 (2017 low) at 1.3685. However, sustained break of 1.2879 will dampen his bullish view and turn focus back to 61.8% retracement at 1.2567, which is close to 1.2526 support.
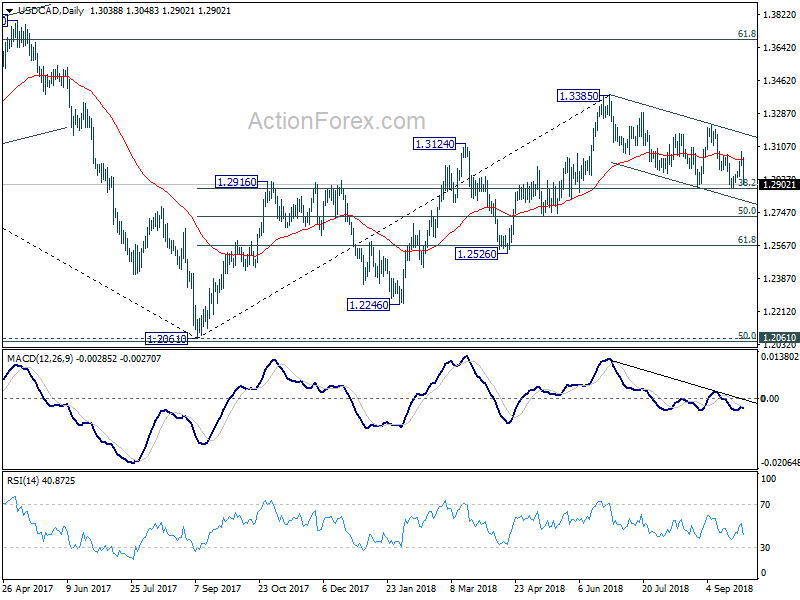
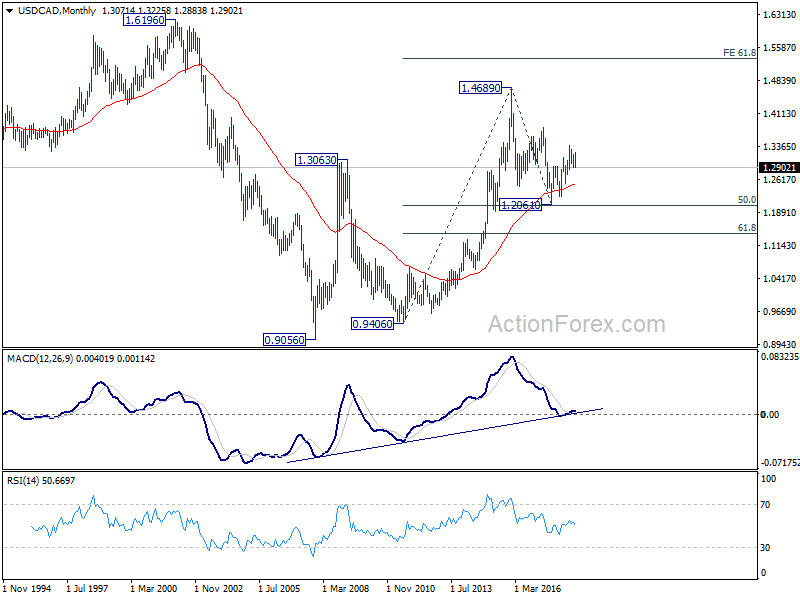
In the longer term picture, corrective fall from 1.4689 (2015 high) should have completed with three waves down to 1.2061, just ahead of 50% retracement of 0.9406 (2011 low) to 1.4689 (2015 high) at 1.2048. The development keeps long term up trend from 0.9406 and that from 0.9056 (2007 low) intact. For now, there is prospect of extending the long term up trend to 61.8% projection of 0.9406 to 1.4689 from 1.2061 at 1.5326 in medium to long term.
GBP/JPY Weekly Outlook
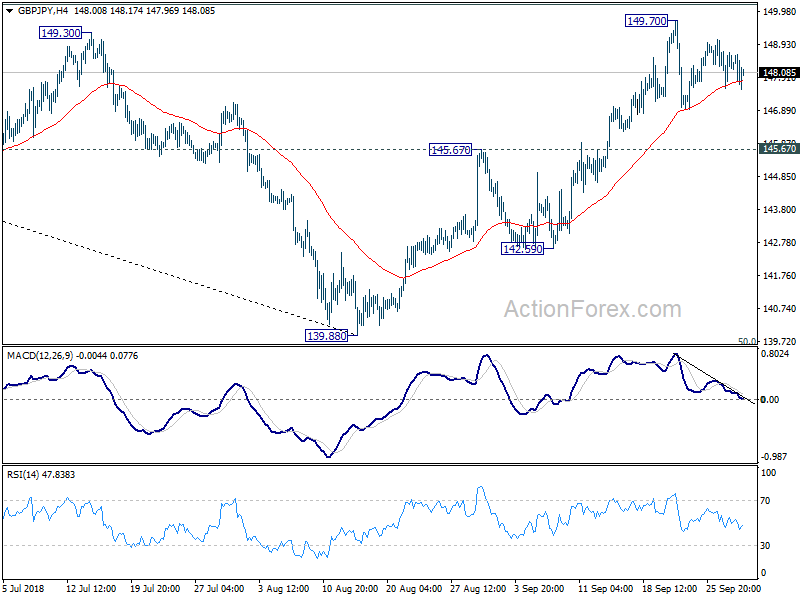
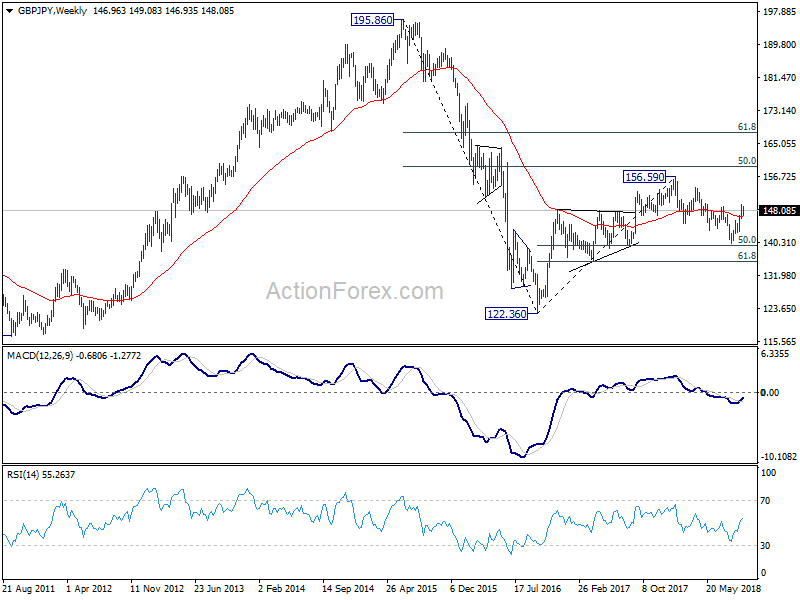
GBP/JPY stayed in consolidation below 149.70 last week but held above 145.67 resistance turned support. Initial bias remains neutral this week and another rally is in favor. On the upside, above 149.70 will target 153.84/156.69 resistance zone next. However, break of 145.67 will suggest that the rebound from 139.88 has completed and turn near term outlook bearish again.
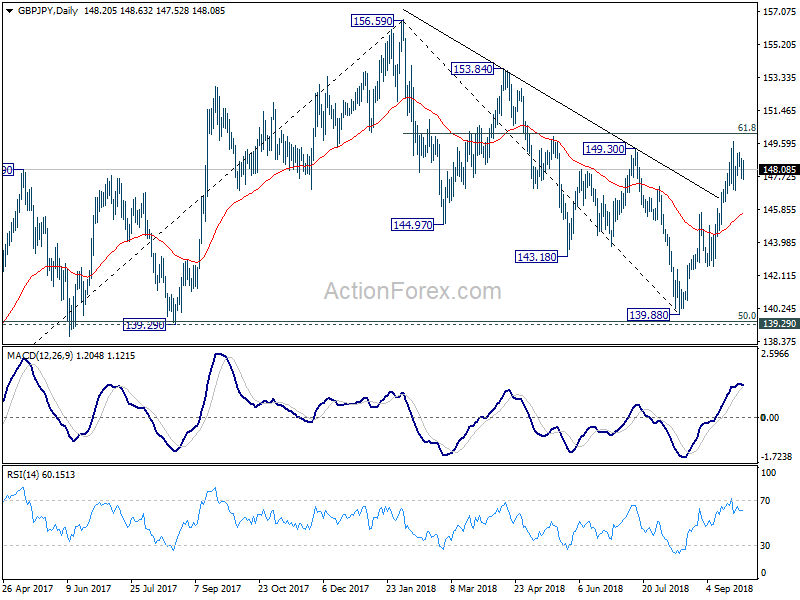
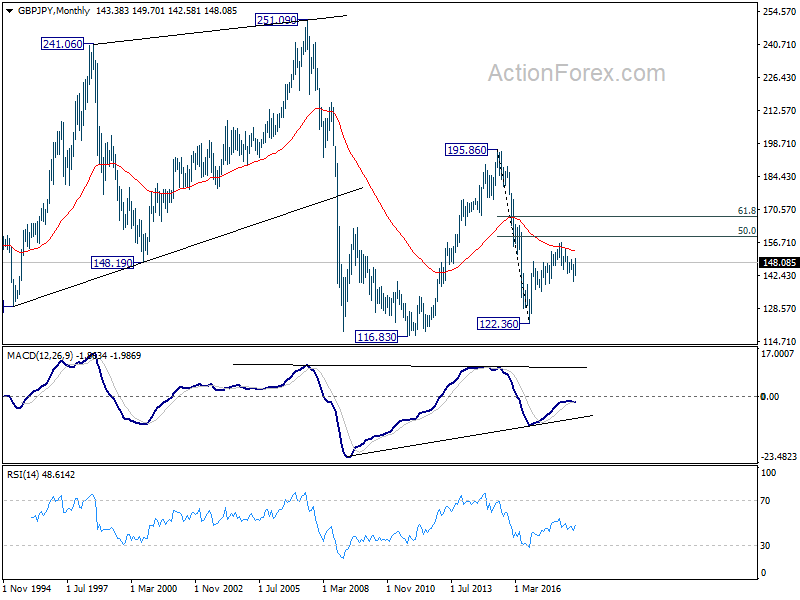
In the bigger picture, current development suggests that GBP/JPY has successfully defended 139.29 cluster support (50% retracement of 122.36 to 156.59 at 139.47). And, the rally from 122.36 (2016 low) is still intact. Such medium to long term rise would extend through 156.96 high. This will now be the preferred case as long as 145.67 near term support holds. However, break of 145.67 will turn focus back to 139.29/47 key support zone.
In the longer term picture, the failure to sustain above 55 month EMA (now at 152.97) mixed the outlook. Nonetheless, as long as 139.29 holds, rise from 122.36 is in favor to extend to 50% retracement of 195.86 (2015 high) to 122.36 (2016 low) at 159.11, and possibly further to 61.8% retracement at 167.78 before completion. However, firm break of 139.29 will turn focus back to 116.83/122.36 support zone instead.
EUR/JPY Weekly Outlook
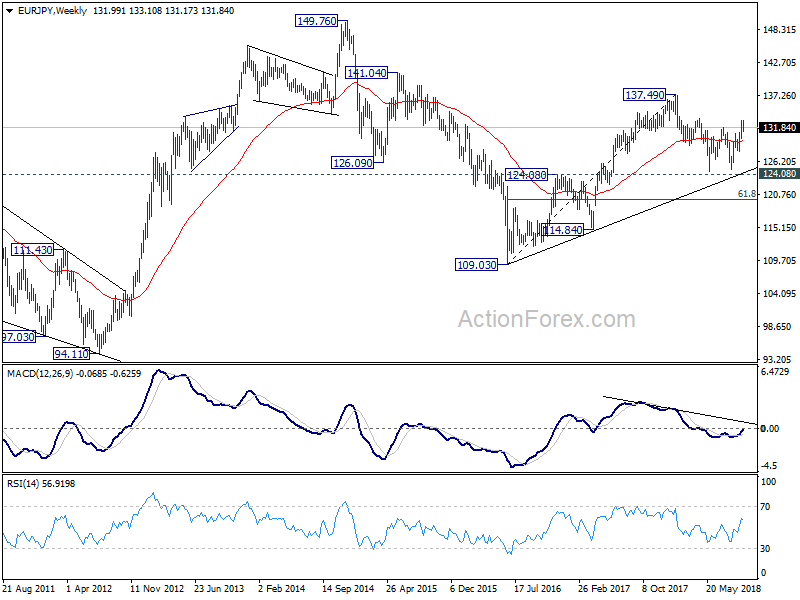
EUR/JPY's consolidation from 133.12 continued last week but downside was contained above 130.86 resistance turned support so far. Initial bias stays neutral this week first, and further rise remains in favor. On the upside, above 133.12 will target 100% projection of 124.89 to 130.86 from 127.85 at 133.82 first. Break will target 137.49 high. However, firm break of 130.86 will turn focus back to 127.85 support.
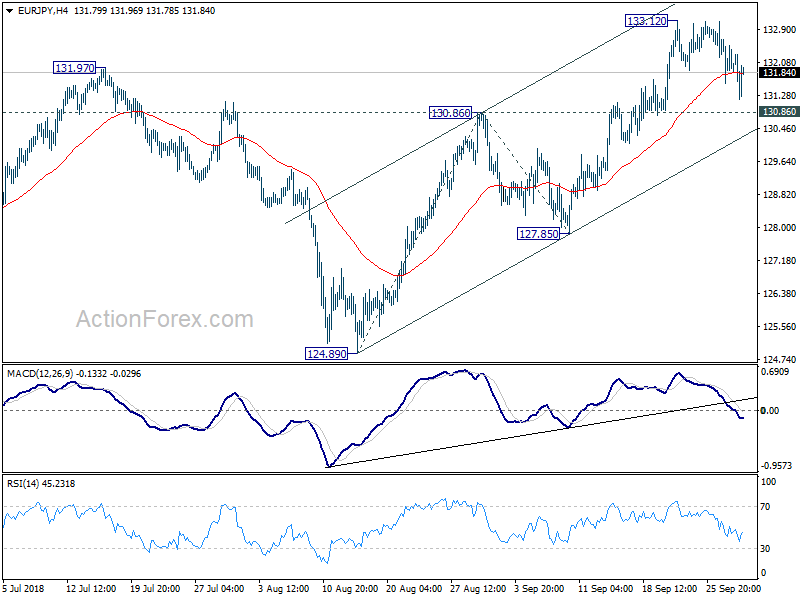
In the bigger picture, current development suggests that EUR/JPY has defended key support level of 124.08 key resistance turned support. And, the larger up trend from 109.03 (2016 low) is still in progress. Firm break of 137.49 will target 141.04/149.76 resistance zone next. This will now be the preferred case as long as 127.85 near term support holds.
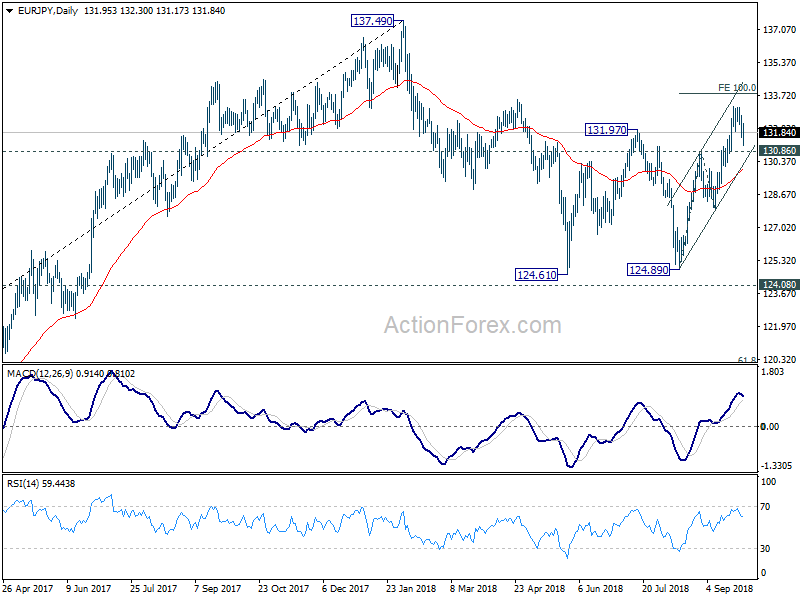
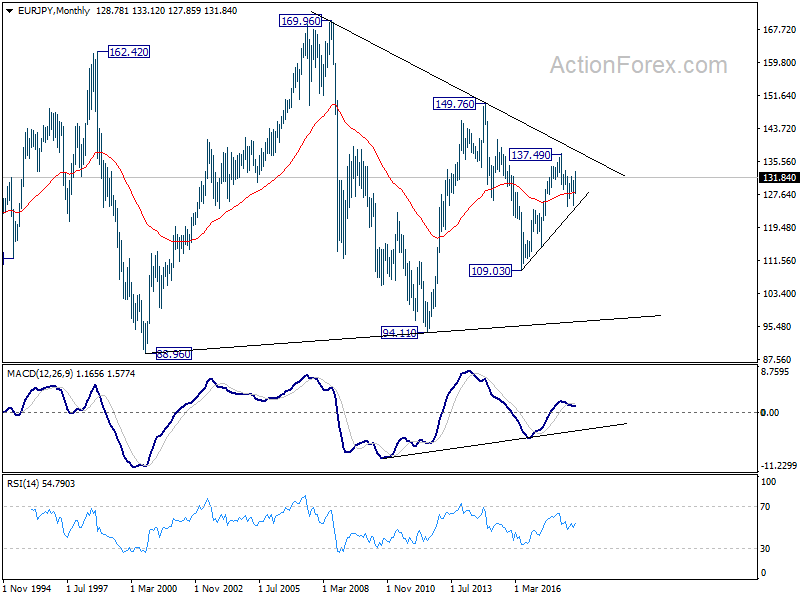
In the long term picture, at this point, EUR/JPY is staying in long term sideway pattern, established since 2000. Rise from 109.03 is seen as a leg inside the pattern. As long as 124.08 support holds, further rally is in favor in medium to long term through 149.76 high. However, break of 124.08 could extend the fall through 109.03 low instead.
EUR/GBP Weekly Outlook
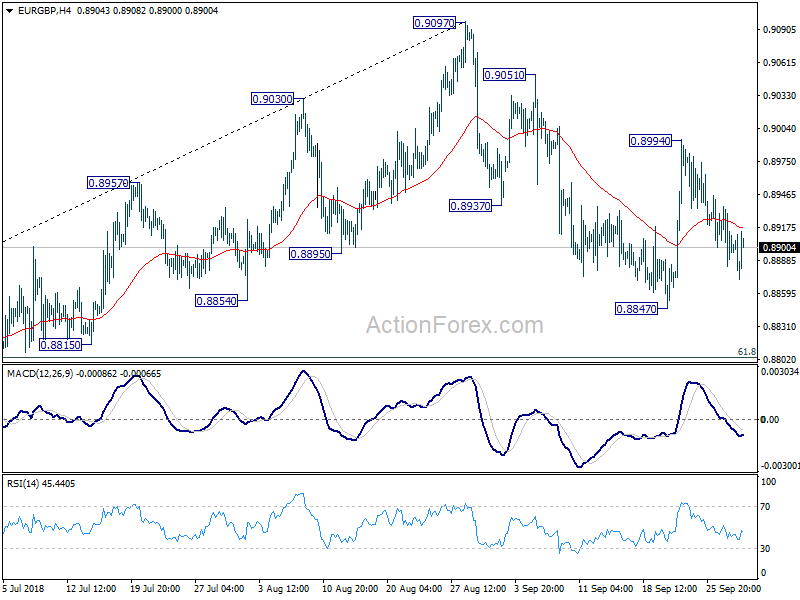
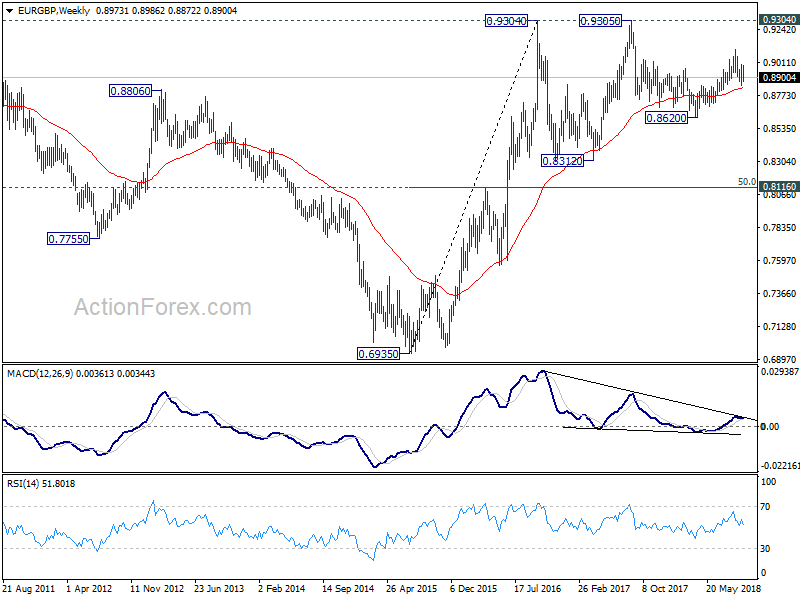
EUR/GBP's pull back from 0.8994 extended lower last week. While it's deep, the structure still suggests that it's a correction. Thus we're holding on to the view that pull back from 0.9097 has completed at 0.8847 already. Initial bias stays neutral this week first. On the upside, break of 0.8994 will target a test on 0.9097 high. Firm break there will resume the rise from 0.8620 towards 0.9305 high.
In the bigger picture, EUR/GBP is staying in long term range pattern from 0.9304 (2016 high). At this point, there is no clear sign of range break out yet. And more corrective trading would continue. On the upside, in case of another rise, we'd stay cautious on strong resistance from 0.9304/5 to limit upside in case of further rally. Meanwhile, if there is another medium term decline, strong support will likely be seen from 0.8303 to contain downside.
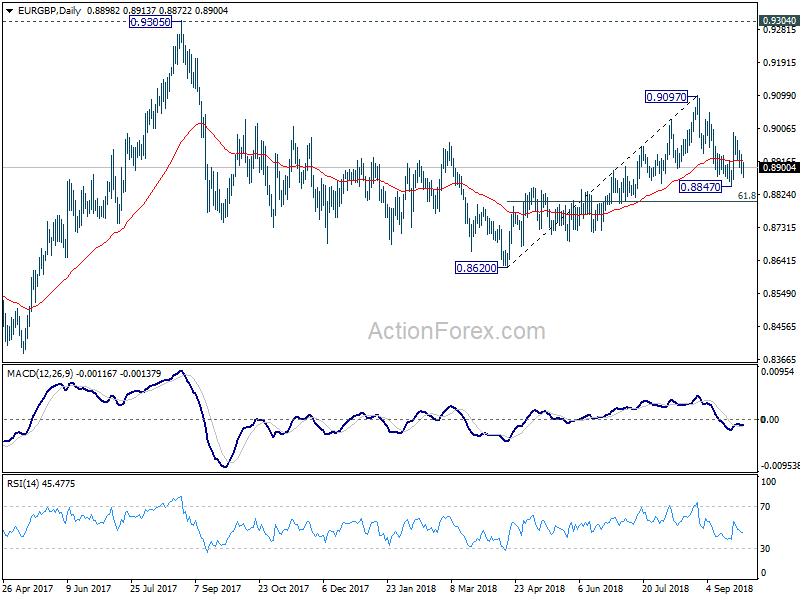
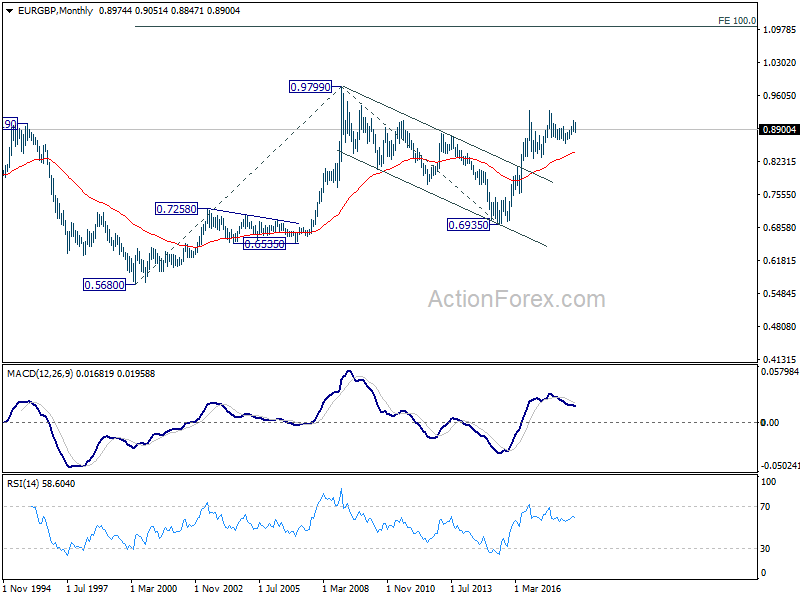
In the long term picture, we're holding on to the view that rise from 0.6935 (2015 low) is resuming the up trend from 0.5680 (2000 low). Hence, after the consolidation from 0.9304 completes, we'd expect another medium term up trend through 0.9799 to 100% projection of 0.5680 to 0.9799 from 0.6935 at 1.1054.
EUR/AUD Weekly Outlook
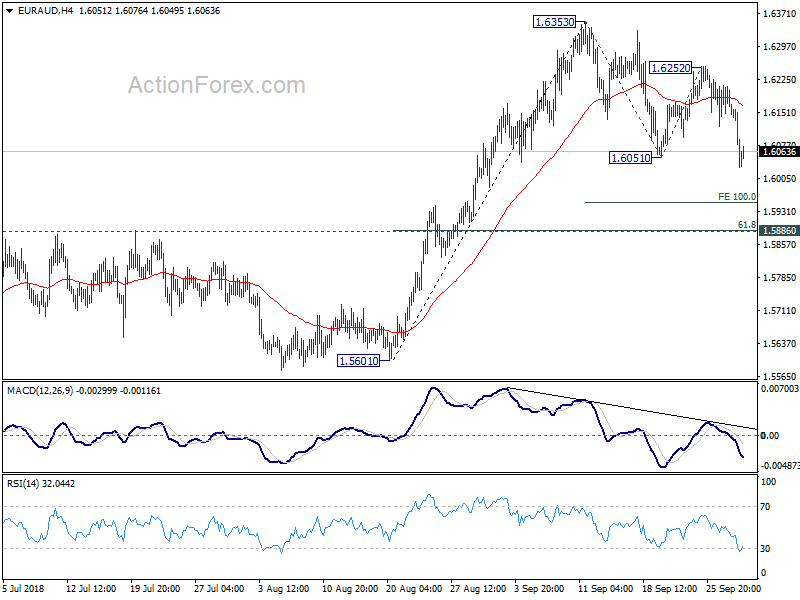
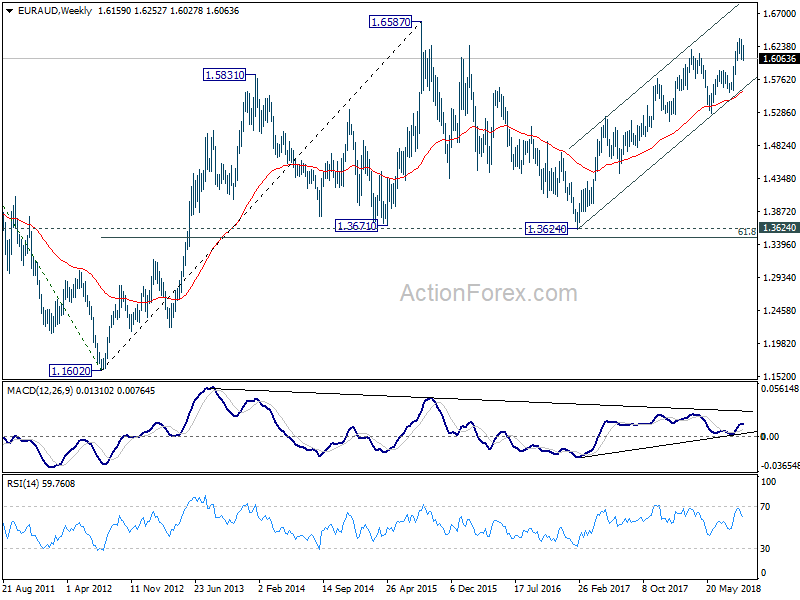
EUR/AUD's correction from 1.6353 last week resumed by taking out 1.6051. Initial bias is on the downside this week for 100% projection of 1.6353 to 1.6051 from 1.6252 at 1.5950. But downside should be contained above 1.5886 cluster support (61.8% retracement of 1.5601 to 1.6353 at 1.5888) to bring rebound and then rise resumption. On the upside, above 1.6252 will target a retest on 1.6353 first.
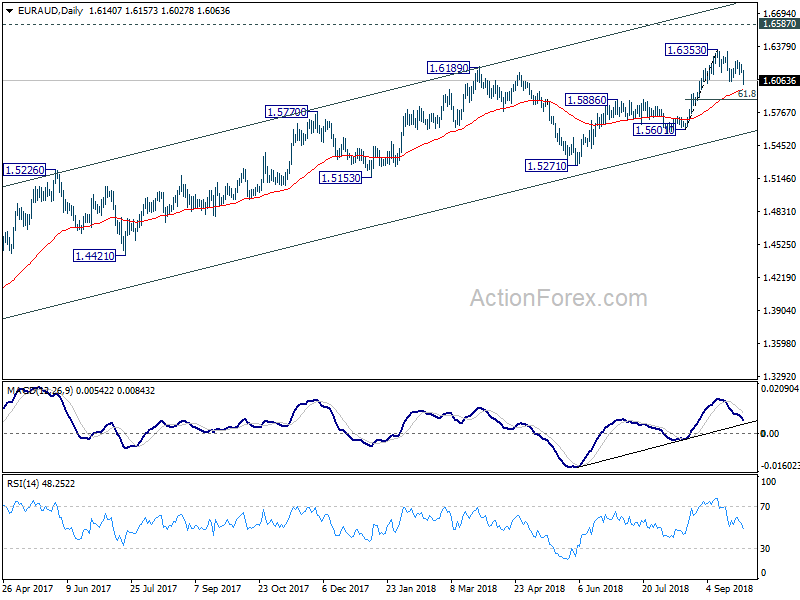
In the bigger picture, up trend from 1.3624 (2017 low) is still in progress. Further rise should be seen to retest 1.6587 (2015 high). Decisive break there will resume the long term rally and target 1.7488 fibonacci level. On the downside, break of 1.5886 resistance turned support is need to be the first sign of medium term reversal. Otherwise, outlook will remain bullish in case of deep pull back.
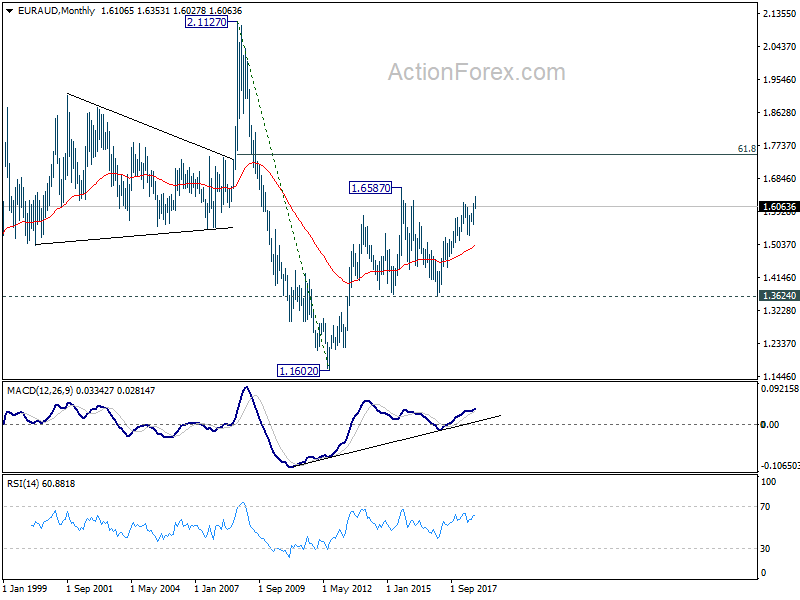
In the longer term picture, the rise from 1.1602 long term bottom (2012 low) isn't over yet. We'll keep monitoring the development but there is prospect of extending the rise to 61.8% retracement of 2.1127 to 1.1602 at 1.7488 and above. However, sustained trading below 1.3624 key support should indicate long term reversal and target 1.1602 long term bottom again.
EUR/CHF Weekly Outlook
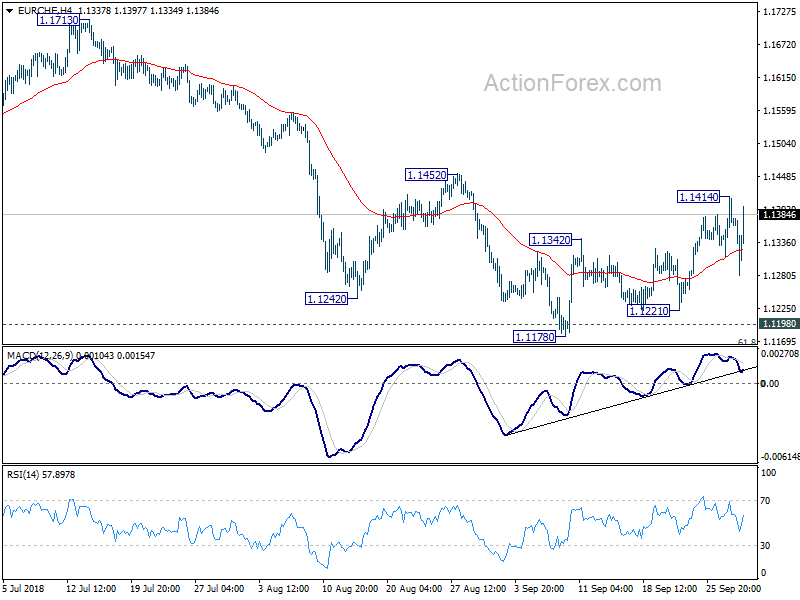
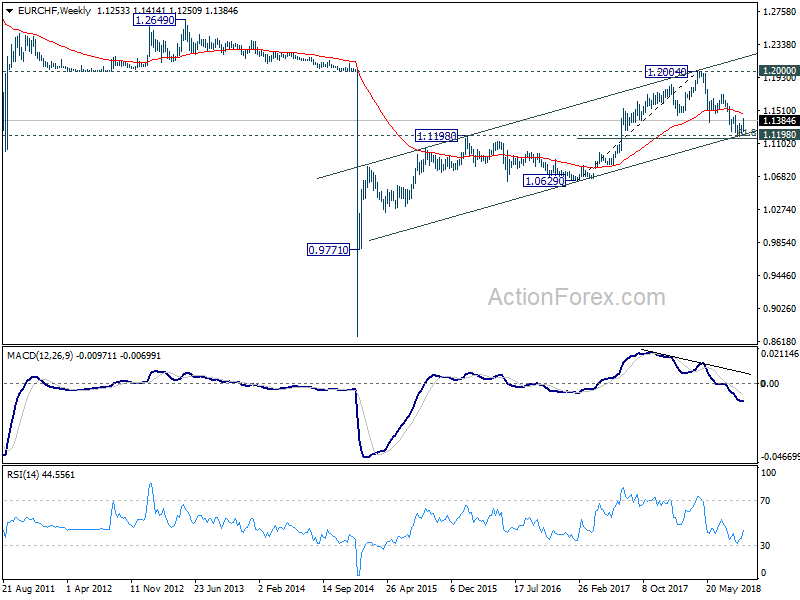
EUR/CHF's rebound halted after hitting 1.1414 last week. But subsequent retreat was contained well above 1.1221 so support so far. Intraday bias stays neutral this week and further rise remains in favor. On the, above 1.1414 will target 1.1452 resistance first. Decisive break there should confirm bullish reversal, after drawing strong support from 1.1154/98 zone. In that case, outlook will be turned bullish for 1.1713 resistance next. However, break of 1.1221 will turn focus back to 1.1154/98.
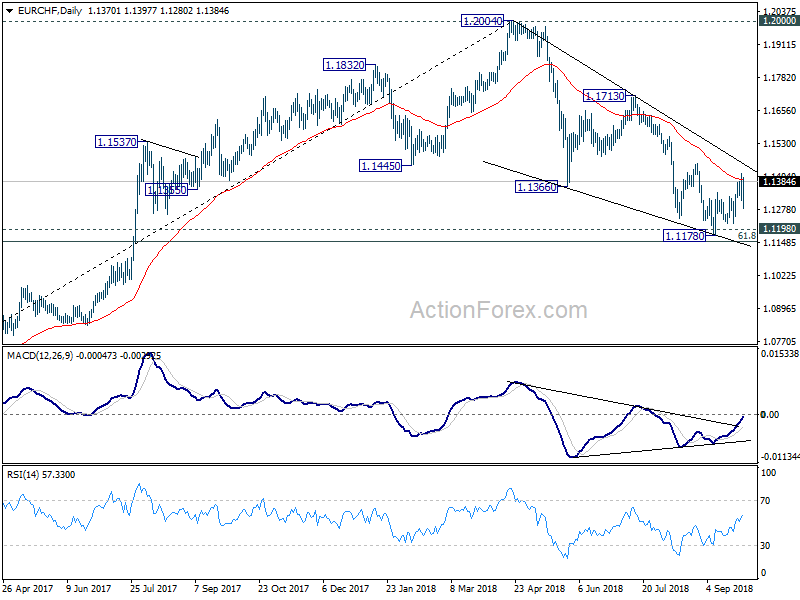
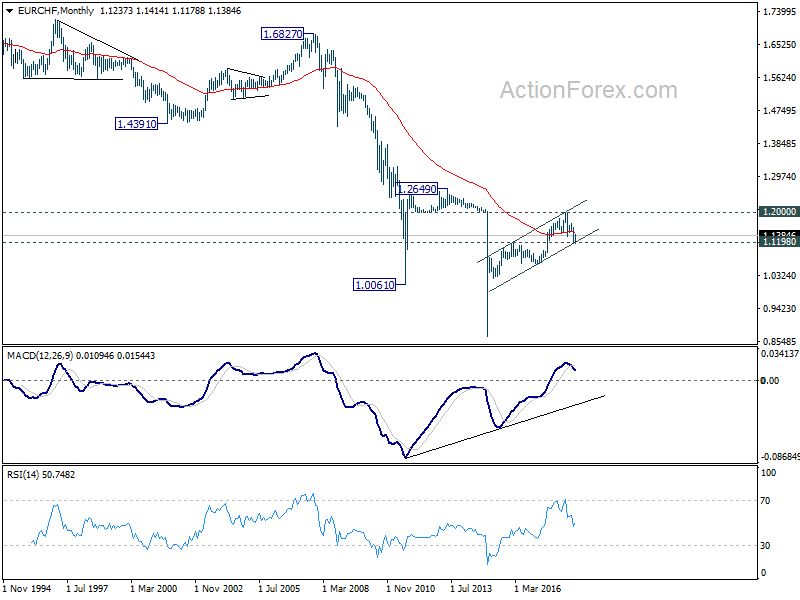
In the bigger picture, price actions from 1.2004 medium term top is seen as a correction only. Downside should be contained by support zone of 1.1198 (2016 high) and 61.8% retracement of 1.0629 to 1.2004 at 1.1154 to complete it and bring rebound. This cluster level is in proximity to long term channel support (now at 1.1234) too. A break of 1.2 key resistance is still expected in the medium term long term. However, sustained break of the mentioned support zone will mark reversal of the long term trend. In that case, 1.0629 key support will be back into focus.
Dollar Higher on Hawkish Fed, Euro Dragged Down by Italy
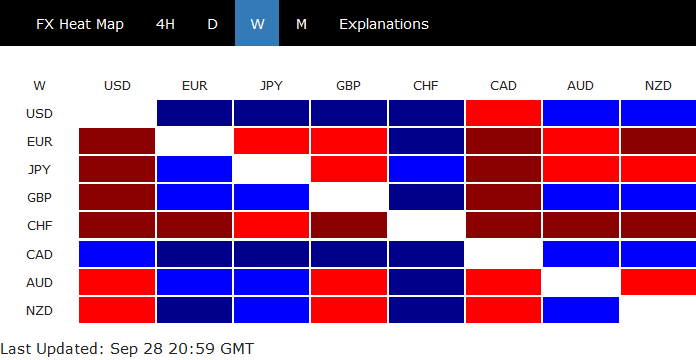
Dollar rose broadly last week as markets received Fed's hawkish rate hike rather week, despite initial hesitation. However, the greenback was just the second strongest, overshadowed by Canadian Dollar. Stronger than expected GDP data from Canada solidify the case of October hike by BoC. Furthermore comments by BoC Governor Stephen Poloz suggested that it's cycle is not over yet. Sterling was the third strongest one as Brexit moved to the back stage, awaiting further developments.
Swiss Franc ended as the weakest one mainly on surging global treasury yields. Euro followed as the second weakest after Italy raised budget deficit target, not only for 2019, but for two more years afterwards. The lack of positive support to the Swiss Franc from Italy budget jitter argues that the Franc's rally since mid-July was mainly due to emerging market problems, like Turkey and Argentina. The Franc didn't care much about Italy so far. Yen was the third weakest, partly due to strength in treasury yields outside Japan, and partly due to return of risk appetite in Asia.
Upside potential still exist for Dollar after Fed's hawkish hike
Fed raised federal funds rate by 25bps to 2.00-2.25% as widely expected. Most importantly, the revised projections suggested that doves have become less dovish. The long run federal funds rate estimate was also raised to 3.00%. It's now less doubtful for Fed continue to raise interest rate to neutral level at around 3.00% and possibly one or two hikes above, as the median projections showed.
There is one argument that the good news on Dollar, that is, Fed's rate path, is already reflected. And there is relatively little room for the greenback to extend the up trend. We'd tend to disagree with this view. Firstly, it's clear that not all FOMC members are totally convinced of hiking towards neutral, like Dudley and Bostic. There are rooms for them to turn more optimistic and thus, solidifying the rate path.
Secondly, long term treasury yields are pressing key resistance level and we could see powerful rally if these levels are broken. More importantly, as we notice recently, rally in yields appear to be stronger at the long end. If the pattern follows, it would be a strong factor that comforts Fed doves.
Thirdly, the mystery of low unemployment rate and low inflation is still not solved. The possibility of sudden pick up in wage growth as unemployment drops further is there. And that could extend Fed's cycle or even quicken it. So, there are indeed still a lot of upside potential Dollar.
Though, a main downside risk we see now is a landslide win by the Democrats in the mid-term elections. That might be a hindrance for Trump to continue with his hostile international trade policy, which has been lifting Dollar all the way. Returning back to negotiation table with China, and others, could weigh on the greenback.
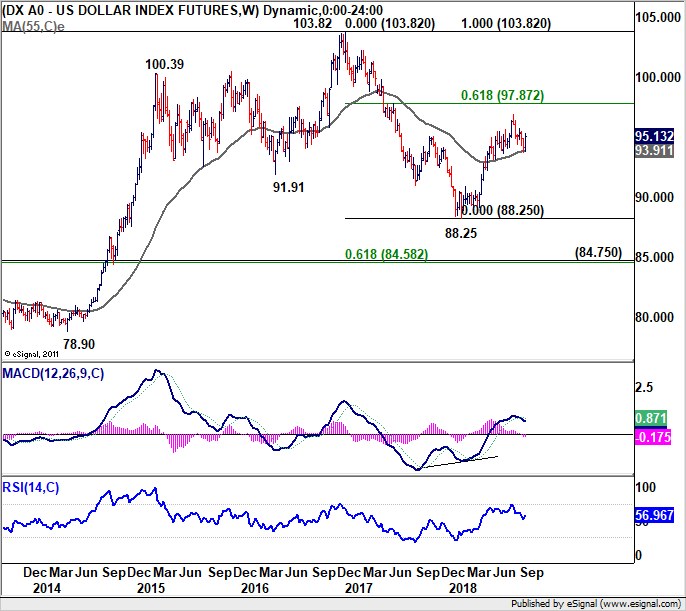
Dollar index defended 93.65 fibonacci support
Dollar index's strong rebound confirmed that key support level of 38.2% retracement of 88.25 to 96.98 at 93.65 was well defended, in line with our view. It's too early to confirm if DXY is resuming larger up trend. But at least, the range is set if consolidation from 96.98 is going to extend. For the near term we'd expect a take on 95.73 and break will bring retest on 96.98 high.
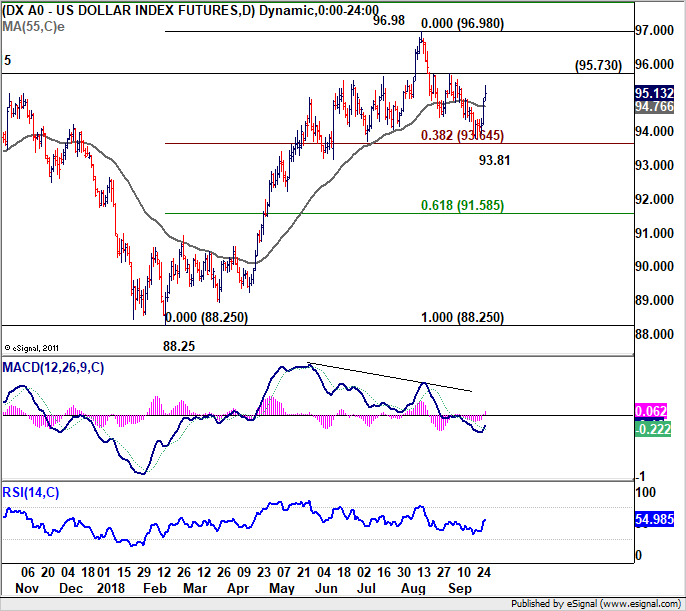
In the bigger picture, the strong support from 55 week EMA also suggests that rise from 88.25 is not over. We'd expect another rally through 96.98 to 61.8% retracement of 103.82 to 88.25 at 97.87 and above, at a later stage.
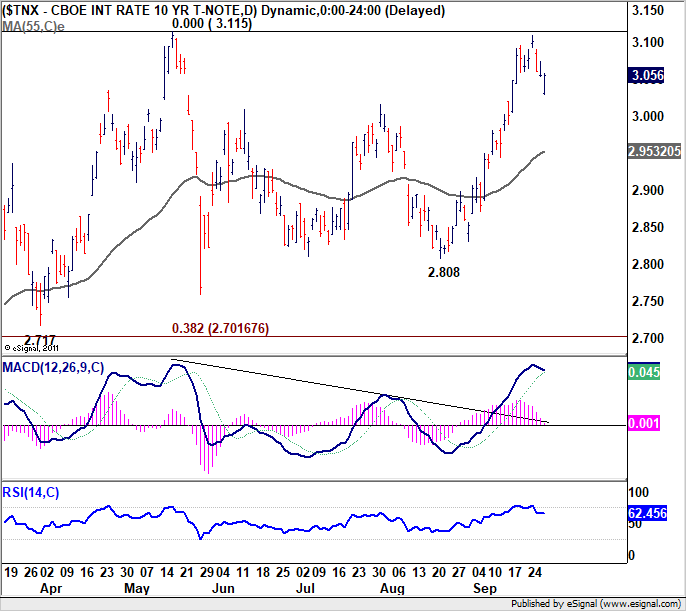
10 year yield to take on 3.115 key resistance again soon
10 year yield edged higher to 3.11 last week but failed to take out 3.115 key resistance and retreated. However, Friday's strong close should be noted. TNX gapped lower to 3.031 but ended up flat at 3.056. That should be a sign of underlying near term strength. We'd expect a retest on 3.115 soon.
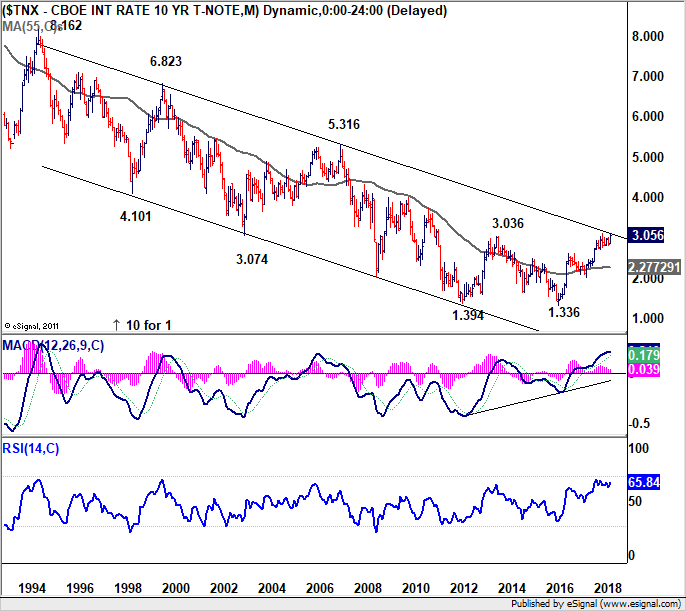
And we'd reiterate that strong break of 3.115 will have multi decade channel resistance taken out too. That should confirm the start of an era of rising US treasury yields.
European markets dragged down by Italy and the issue will continue
Italy occupied a lot of the headlines in the EU last week. In short, the coalition leaders eventually forced Economy Minister Giovanni Tria to raise budget deficit target for the next three years to 2.4% of GDP, from his preferred 1.9%. Technically, speaking it's within EU rules of sub 3% deficit. However, it drew strong criticism from EU officials.
European Commission Vice-President for the Euro and Social Dialogue Valdis Dombrovskis made it rather clear that 2.4% deficit target would put Italy in "breach of its obligations" as the Italian government is "obliged to improve its budget balance so as to reduce its debt mountain." However, from EU's angle, headline deficit has to be at around 1.6% or below to start having improvement in the structural balance of the country's budget.
It's doesn't really matter which side, the anti-establishment Italian coalition or the EU, is right. The point is, both side will continue the clash ahead. As European Economics Commissioner Pierre Moscovici noted that nothing would be gained from a clash with Italy, but added "we don't have any interest either that Italy does not respect the rules and does not reduce its debt, which remains explosive."
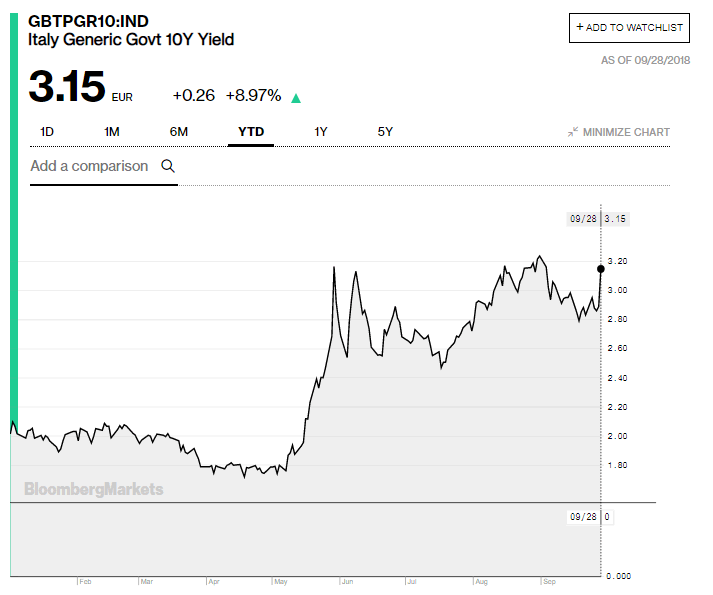
Reactions from the European financial markets were overwhelmingly negative. Italian 10 year yield closed at 3.15, back near to peak hit in late August/early September.
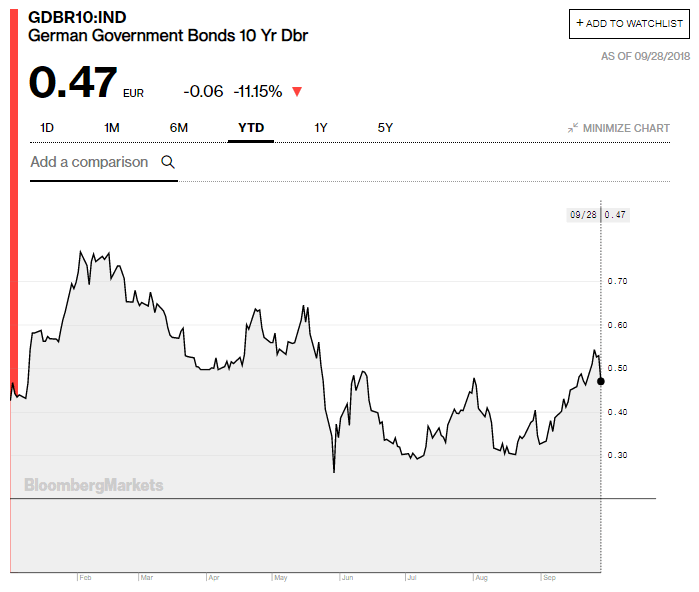
German 10 year yield broke 0.50 handle in the middle of the week with hope that it could be back in non-crisis level. But it closed at 0.47 as safe haven demand flew back.
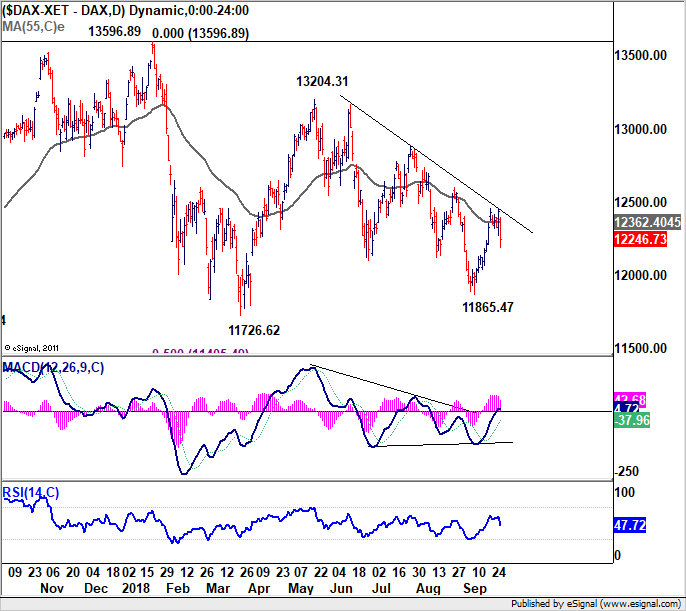
German DAX also suffered steep setback. Failing to sustain above 55 day EMA and rejection by near term falling trend line argues that the choppy from 132.04.31 is still on course for testing 11726.62 low.
Asian markets showed returned of risk appetite
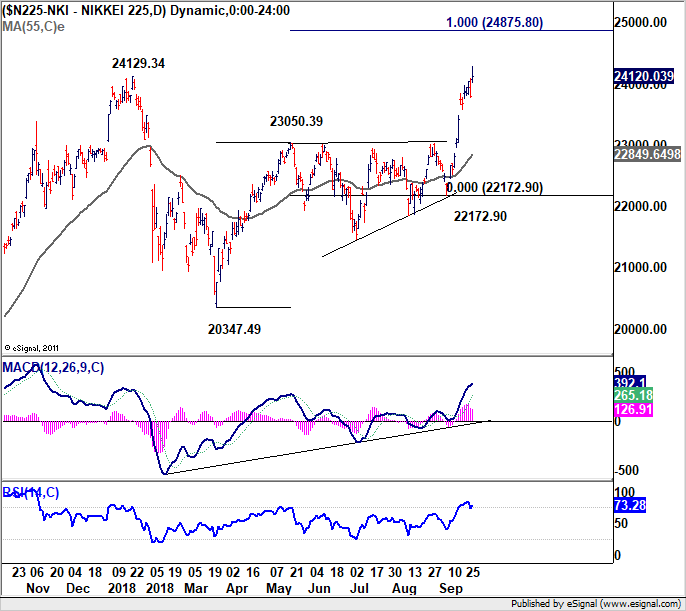
Developments in Asian markets were much more positive. For example, Nikkei breached key resistance level at 24129.34 last week The development suggests that medium term up trend might be resuming and further rally could be seen to 100% projection of 20347.49 to 23050.39 from 22172.90 at 24875.80 in near term.
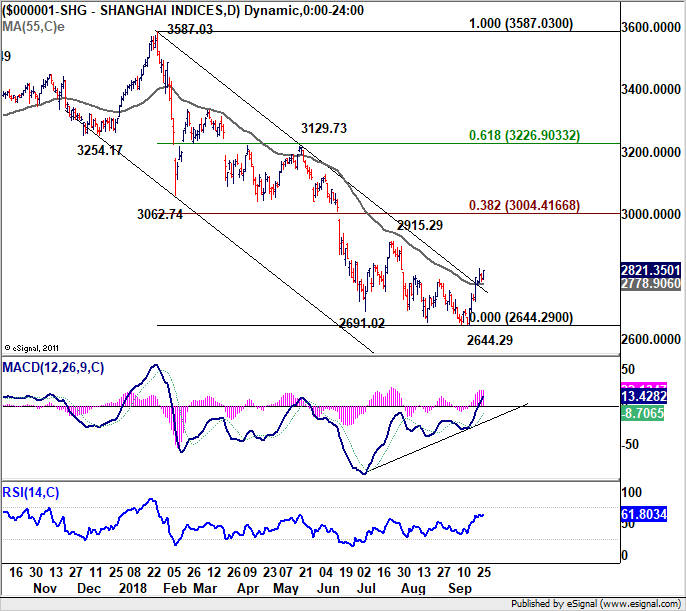
China's Shanghai SSE was boosted on new that MSCI is considering to significantly raise the weighting on A shares in it's indices. SSE's solid break of 55 day EMA and medium term falling channel suggests medium term bottoming at 2644.29, on bullish convergence condition in daily MACD. Key support of 2016 low at 2638.30 was also defended well. More upside should be seen in the near term back towards 2915.29 resistance. Though for now, we don't see any reason for breaking 3000 handle yet. Nonetheless, developments in Asian markets could provide some additional support to Aussie and some pressure on Yen.
Position trading strategy
Our GBP/USD short strategy as noted in last weekly report, was entered at 1.3150. As GBP/USD's decline from 1.3297 finally resumed on Friday, we've lowered the stop to break even at 1.3150 in this update.
Our view is unchanged that corrective rise from 1.2661 has completed with three waves up to 1.3297, just head of 38.2% retracement of 1.4376 to 1.2661 at 1.3316. There is prospect that fall from 1.3297 is resuming larger down trend from 1.4376. We'll keep monitoring downside momentum to decide whether we'll exit in 1.2661/2784 support zone, or hold it the position through.
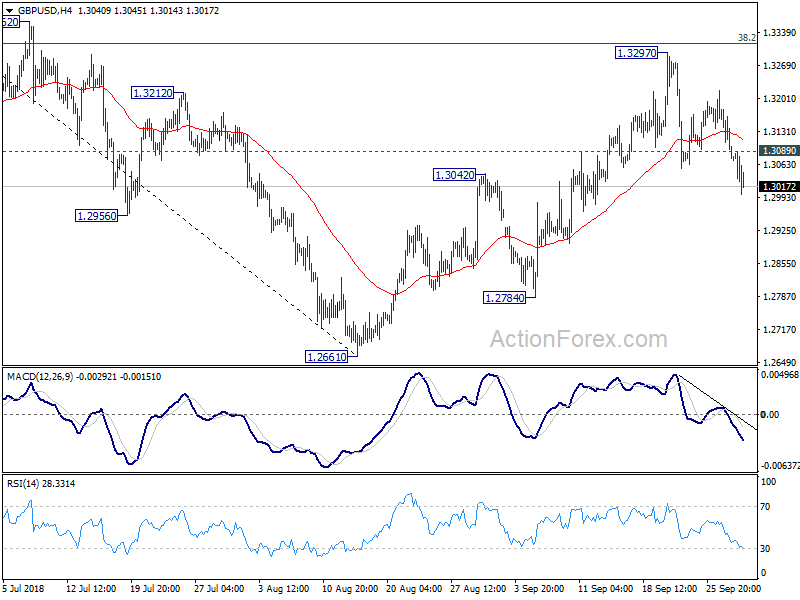
But there is one point to note. If the most bearish view is correct, current decline should be a wave three in a five wave sequence from 1.3297. And there should be some downside acceleration ahead. Therefore, ideally, we should not see a recovery through 1.3089 minor resistance. If 1.3089 is broken, there might be something wrong.
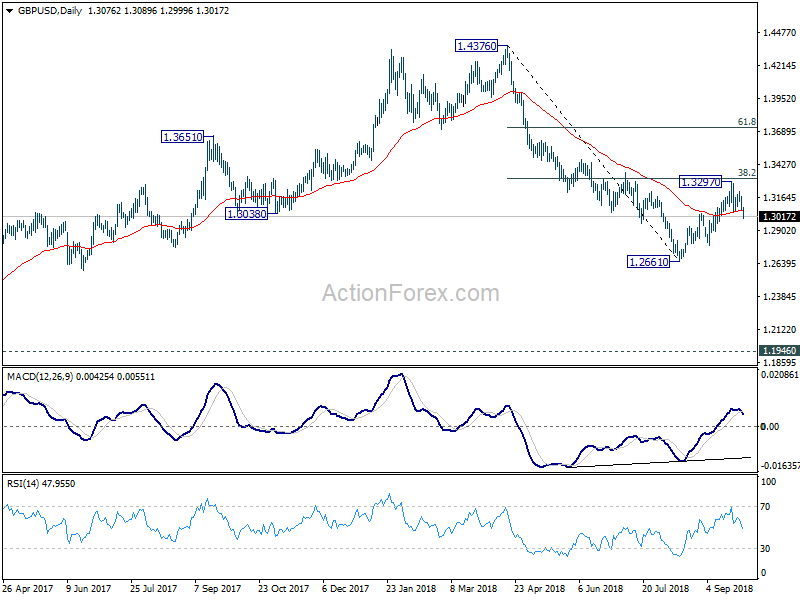
Therefore, to conclude, we'll hold short in GBP/USD, keep the stop at 1.3150. Exit price will be determined later. At the same time, we'll start to consider abandoning the position if 1.3089 is broken, even if the stop at 1.3150 is not hit.
In terms of new strategies, we've looked at a CAD long opportunities to hold ahead of BoC rate hike on October 25. CAD/JPY's strong rally on Friday suggests that both rise from 83.75 and that from 80.52 has resumed. More importantly, the solid break of 86.74 support turned resistance, a double top neckline (91.62, 91.56) carries bullish implication. Current rise should target 100% projection of 80.52 to 87.09 from 83.75 at 90.32 and possibly further to 91.62.
One way to enter is buy at 87.44, prior week's high as resistance turned support, with stop at 86.20 and target at 90.32. However, that only gives a risk reward ratio of 1:2.43.
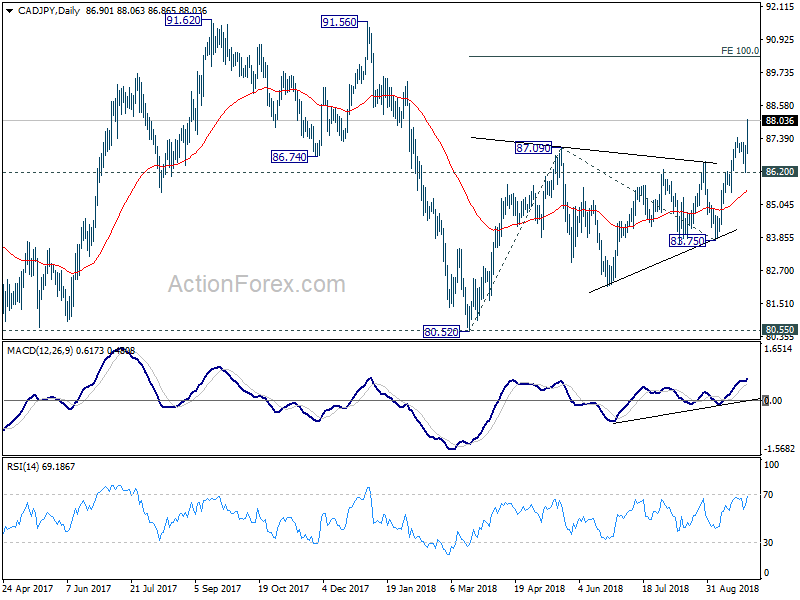
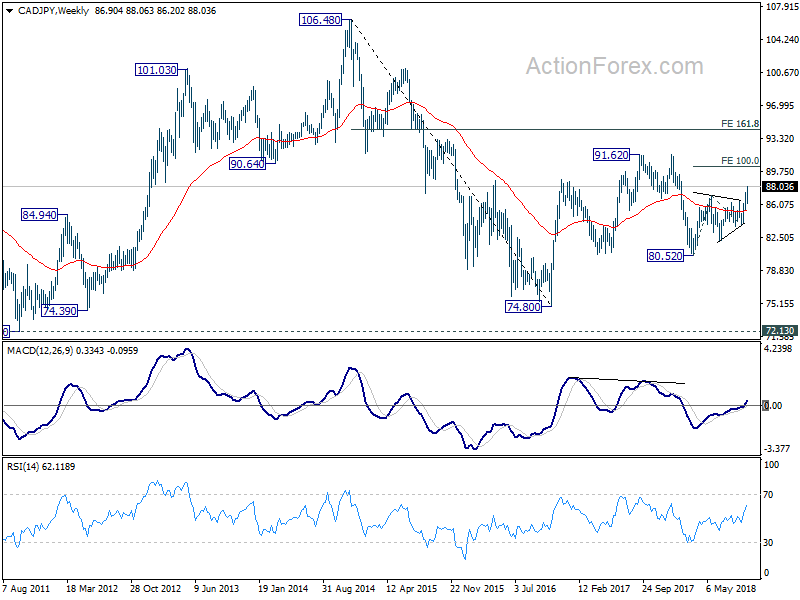
Risk reward could be boosted to 1:3.46 if we put the target at 91.55. However, looking at the weekly chart, we're not too convinced that CAD/JPY is resuming the rally from 74.80 through 91.62. Current rise from 80.52 could just be a leg inside the range pattern. Thus, it may not be able to take on 91.62 high. Hence, having all considerations, we'll give it a pass and won't trade CAD/JPY for now.
USD/CHF Weekly Outlook
USD/CHF surged to as high as 0.9818 last week. The development confirmed near term reversal level. Initial bias stays on the upside this week for 0.9866 key resistance level, 61.8% retracement of 1.0067 to 0.9541 at 0.9866. Decisive break there will bring retest of 1.0067 high. On the downside, below 0.9736 minor support will turn intraday bias neutral first.
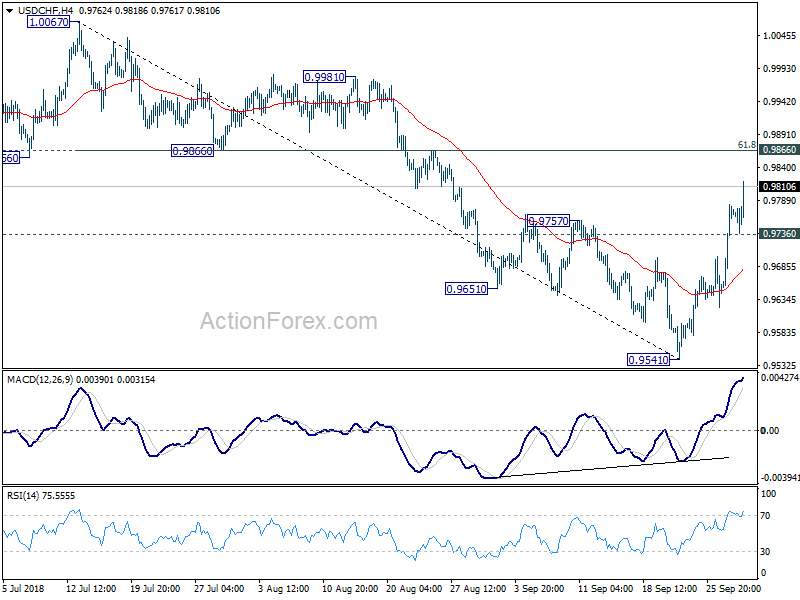
In the bigger picture, focus is now back on 0.9866 support turned resistance. Decisive break there will suggests that pull back from 1.0067 has completed at 0.9541. And larger rise from 0.9186 low is ready to resume. Decisive break of 1.0067 will pave the way to 1.0342 key resistance next. Meanwhile, break of 0.9541 will extend the decline but we don't expect a break of 0.9186 low even in that case.
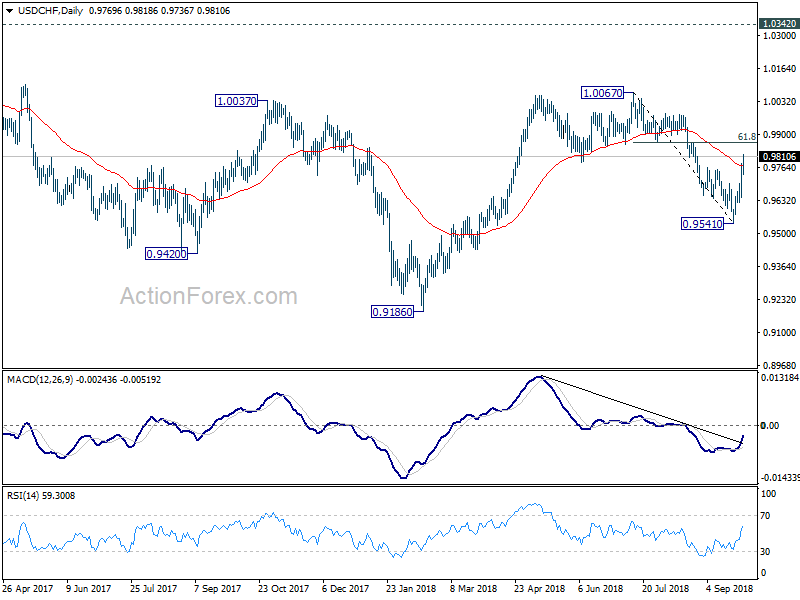
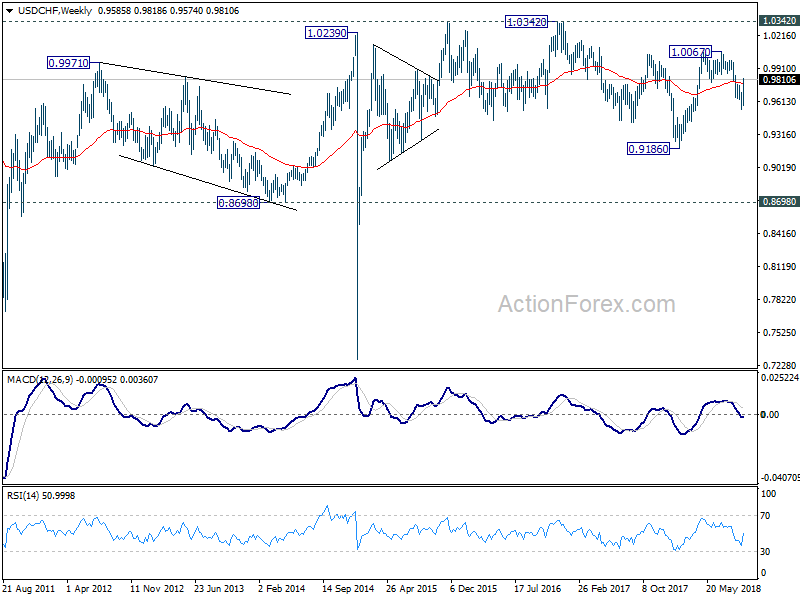
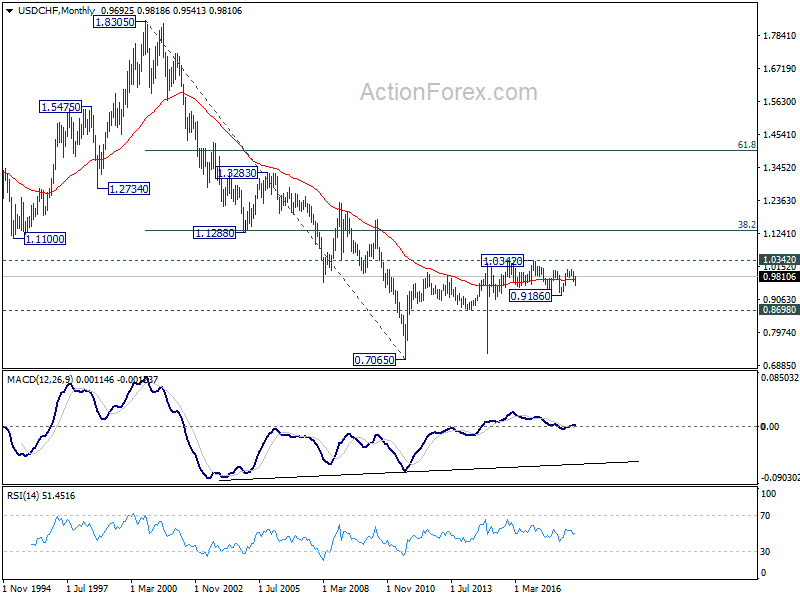
In the long term picture, price actions from 0.7065 (2011 low) are not clearly impulsive yet. Thus, we'll treat it as developing into a corrective pattern, at least, until a firm break of 1.0342 resistance.
Summary 10/1 – 10/5
Monday, Oct 1, 2018
[php_everywhere instance="1"]
Tuesday, Oct 2, 2018
[php_everywhere instance="2"]
Wednesday, Oct 3 2018
[php_everywhere instance="3"]
Thursday, Oct 4, 2018
[php_everywhere instance="4"]
Friday, Oct 5, 2018
[php_everywhere instance="5"]
Weekly Economic and Financial Commentary: Central Banks in Focus as Growth Remains Steady
U.S. Review
Fed Rate Hike Took Center Stage This Week
- The Federal Open Market Committee (FOMC) raised the fed funds rate 25 bps this week in a widely-expected move. The removal of language characterizing monetary policy as "accommodative" in its statement signals that FOMC members recognize that the funds rate has moved into neutral territory.
- The consumer confidence index neared an all-time high in September, while personal income and spending data released this week generally support consumers' upbeat sentiment surrounding the near-term outlook.
- New home sales and durable goods orders data look a bit less impressive once we look beneath the headline gains.
Fed Rate Hike Took Center Stage This Week
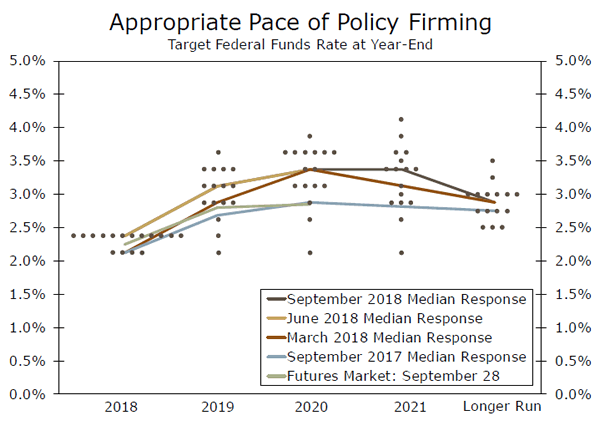
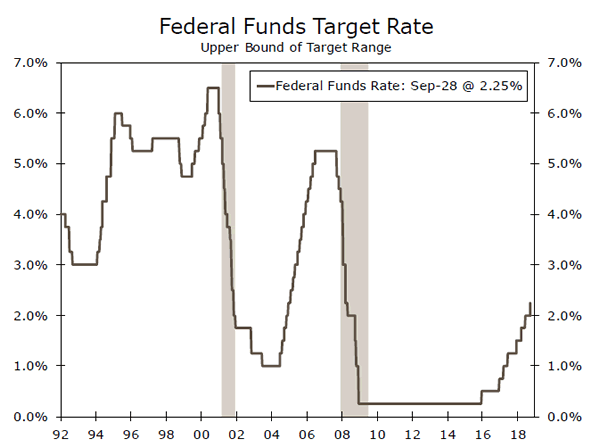
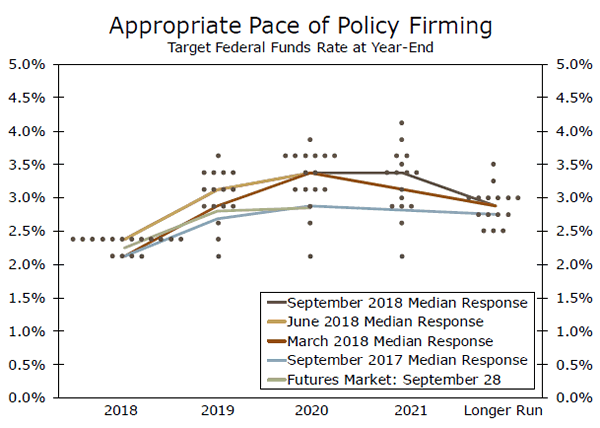
The FOMC decision was the headline event this week, even though its unanimous 25 bps rate hike was widely expected. What was decidedly more interesting were key changes in the language of the committee's policy statement, as well as the rollout of its 2021 fed funds rate projections (see chart on first page). While the FOMC has been steadily increasing interest rates since late 2015 (top chart), it has kept language in its statement to say that "monetary policy remains accommodative." However, that language disappeared this week, meaning the committee is implicitly signaling that the fed funds rate has moved into neutral territory. That said, the neutral fed funds rate estimate is not precise and could take on a broad range. Indeed, the median FOMC member still looks for another 25 bps rate hike before year-end and 75 bps of tightening next year, in line with our own forecast. The FOMC also upped its median GDP growth projections, now at 3.1% this year and 2.5% in 2019, up from 2.8% and 2.4% previously.
Actions this week reinforce the Fed's view of a strong domestic economy, a tight labor market and on-target inflationary pressures. Indeed, data released today showed that the PCE deflator rose 2.2% in August year-over-year, just above the Fed's 2% target. Our own forecasts tend to move with the Fed's in the near term. However, we look for fading fiscal stimulus and passthrough effects of monetary tightening to the broader economy to eventually slow growth and lead the Fed to cut the fed funds rate 25 bps at the end of 2020. We acknowledge that our vision into 2020 is less than perfect, and see the FOMC continuing to tighten policy at a gradual pace in the near-to-medium term.
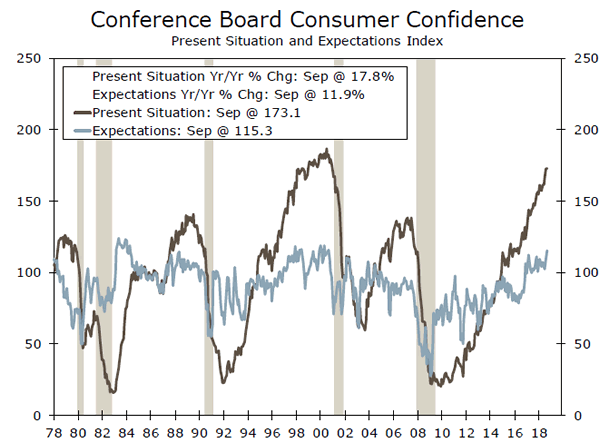
While the FOMC decision took center stage, several other indicators released this week also support the Fed's assessment of strong economic growth. The headline consumer confidence index rose 3.7 points to 138.4 in September, approaching its all-time high registered in 2000 (middle chart). Although the present situation index continues to run ahead of future expectations, the latter still increased six points, signaling that consumers remain upbeat about the near-term outlook. The income and spending data generally confirm the strong survey data this week. While personal spending growth slowed slightly to 0.3% in August, wages and salaries rose a stronger 0.5%, confirming that a tight labor market is likely propelling wage growth in the near term.
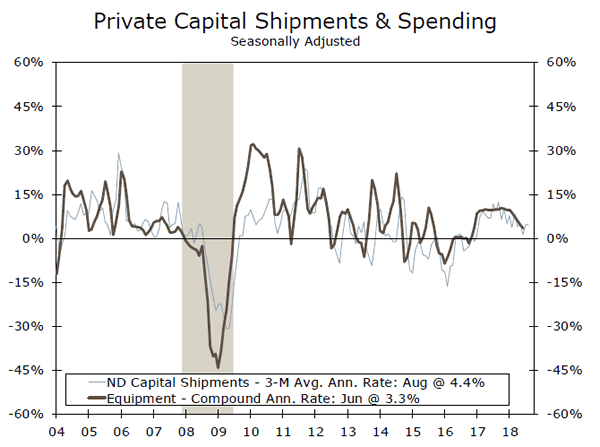
New home sales rebounded in August, rising 3.5% to a 629,000-unit pace after trending lower in prior months. However, affordability remains a concern, as home prices continue to rise and higher interest rates reinforce upward pressure on mortgage rates, giving us little room to see much upside to home sales later this year. Looking beyond the consumer sector, August durable goods orders were a bit less encouraging for business spending in Q3. While headline orders rose a stronger-than-expected 4.5%, core capital goods orders actually declined 0.5% after removing the volatile aircraft component that accounted for most of the headline beat. Private capital shipments, which feed into the BEA's equipment spending estimates, have also moderated recently and signal a likely slower pace of spending in Q3 (bottom chart).
U.S. Outlook
ISM Manufacturing • Monday
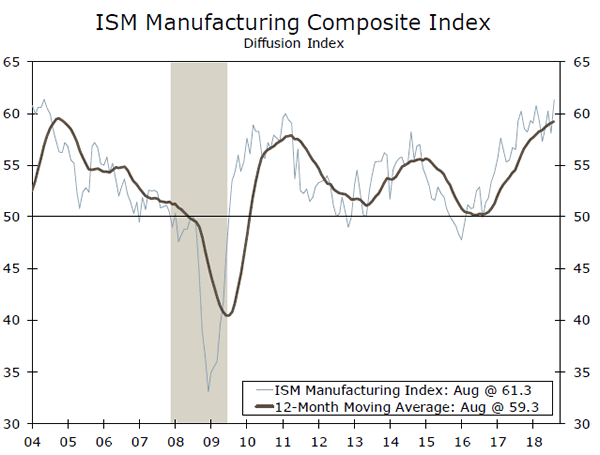
The ISM manufacturing index rose to a 14-year high in August and suggests that activity in the factory sector remains solid. Nevertheless, we expect to see a modest pullback in August, with the index slipping to 60.0. The latest regional Fed purchasing managers' indices point to some moderation, with the averages for new orders, production and employment having come down in recent months. More generally, such elevated readings are not usually sustainable in a strong-dollar environment.
Even with some cooling in September, the ISM survey is likely to signal supply chains remain tight. Supplier delivery times have been increasing at the fastest pace of the expansion and, along with rising backlogs, point to price pressures from the sector staying elevated.
Previous: 61.3 Wells Fargo: 60.0 Consensus: 60.0
Trade Balance • Friday
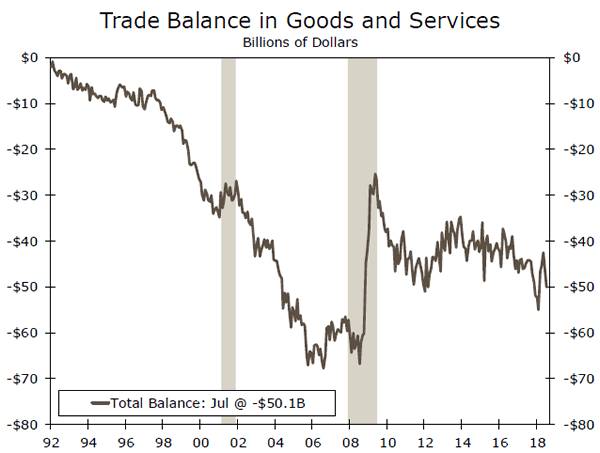
The trade balance narrowed significantly in Q2 amid a jump in exports that was driven by some U.S. businesses rushing to get their merchandise overseas before retaliatory tariffs went into effect. The trade balance reversed course in July, however, with the deficit climbing to a sixth-month high.
We expect to see the trade deficit widen further in August. The advance look at the merchandise trade deficit showed exports falling 1.6% last month while imports rose 0.7%. While recent tariff measures in the United States and abroad add uncertainty to the outlook, we anticipate that the trade deficit will continue to grow wider on trend. Strong consumer and business spending point to rising imports, as does the rise in the dollar since early this year, which, all else equal, makes imports less expensive and exports pricier.
Previous: -$50.1 B Wells Fargo: -$53.7 B Consensus: -$51.0 B
Employment • Friday
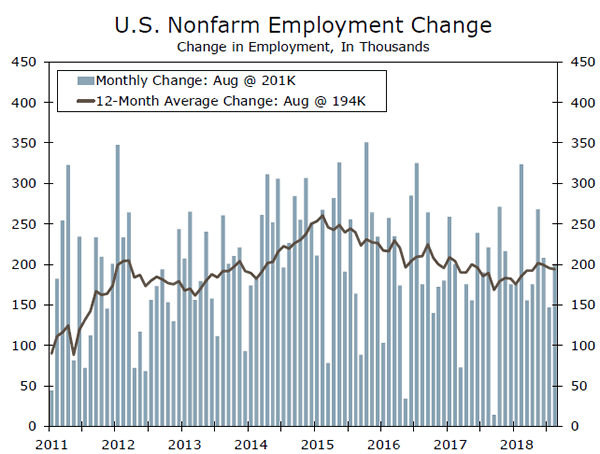
Job growth continued its tear in August, with employers adding 201,000 jobs. We expect to see a similarly strong gain for September and look for payrolls to rise by 185,000. Demand for workers remains exceptionally strong. Job openings and the share of small business reporting they have at least one job to fill are at record highs, while jobless claims are at the lowest levels since the late 1960s when the workforce was half its current size.
The amount of available labor continues to shrink as a result. Although the unemployment rate has fallen more slowly over the past year as more prime-age workers (ages 25-54) join the labor force, we expect to see it tick back down to 3.8% in August. Average hourly earnings may slow a touch in September after an impressive 0.4% rise last month, but should continue to rise on trend in the coming months as the labor market tightens further.
Previous: 201,000 Wells Fargo: 185,000 Consensus: 185,000
Global Review
Central Banks in Focus as Growth Remains Steady
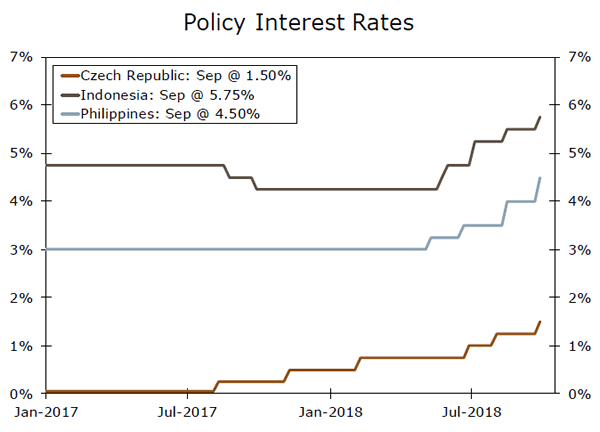
- In addition to the Federal Reserve's policy announcement, it was a busy week on the international policy front. Central banks in the Czech Republic, Philippines and Indonesia raised interest rates, while New Zealand and Taiwan held rates steady. While not yet a sizeable step toward renewed global monetary policy convergence, it hints that the market theme may become more visible going forward, especially as we move into 2019.
- Eurozone confidence surveys remain consistent with steady growth, with few signs yet of a strong upswing. With Eurozone inflation also remaining subdued, further monetary tightening is likely some way away.
Global Central Banks: Lots of Talk and Some Action
The past week saw several monetary policy announcements from international central banks, with plenty of talk and a moderate amount of action. Focusing first on central banks that adjusted their policy stance, the Czech central bank raised interest rates 25 bps to 1.50%, and said that while the next move will likely be up, the timing was difficult to predict. Indonesia's central bank raised its reference rate 25 bps to 5.75%, and said it would not hesitate to respond to rupiah volatility, while the Philippine central bank hiked its overnight borrowing rate 50 bps to 4.50%, as expected.
On the less active side, the Reserve Bank of New Zealand held its Official Cash Rate at 1.75% and, despite firmer GDP data recently, kept the option of further monetary easing open. Taiwan's central bank kept its benchmark interest rate at 1.375%, saying monetary policy remains moderately loose, and appears to be comfortably on hold for the time being. Assessing this week's decisions, it was not a case of across the board action from central banks, and in some cases rate hikes were defensive in nature in response to currency weakness and rising inflation pressures. In that context, we do not view this week's moves as a significant step along the path of renewed global monetary policy convergence. That said, international central banks are at least becoming more active, suggesting scope for monetary policy convergence to become a more visible theme going forward, especially as we move into 2019.
Eurozone: Still Waiting for a Strong Upswing
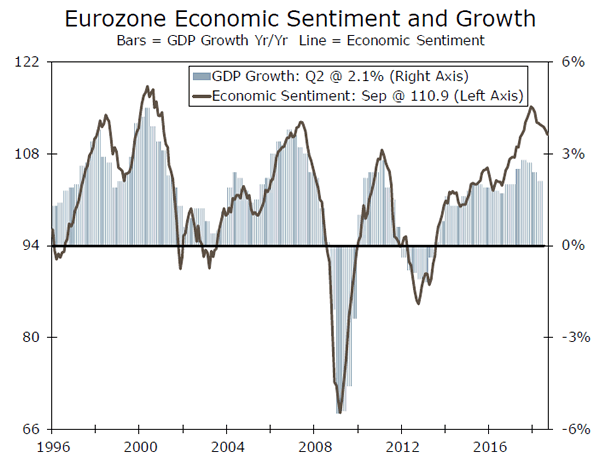
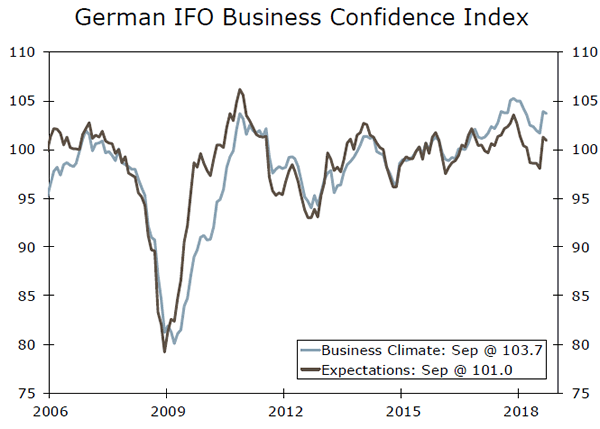
The incoming economic data point to a Eurozone economy that is still awaiting a stronger economic upswing. Germany's IFO business confidence index – the key survey data from the Eurozone's largest economy – eased less than expected in September, to 103.7. Still, that slight decline comes following increases since mid-year, and the index remains relatively close to multi-year highs. Overall, there are hints that Germany's economy could be emerging from a "soft patch" during early 2018. In contrast, Eurozone September economic confidence eased more than forecast, to 110.9, a ninth straight fall, with the manufacturing component falling but the services component rising. Separately, trends in monetary data point to a subdued rate of growth for the time being. August M3 money growth slowed to 3.5% year-overyear, although on a more encouraging note growth in private sector loans firmed slightly to 3.4%. While we expect Eurozone growth to pick up from its sluggish pace of early 2018, it may take a little while longer before a stronger upswing gains traction.
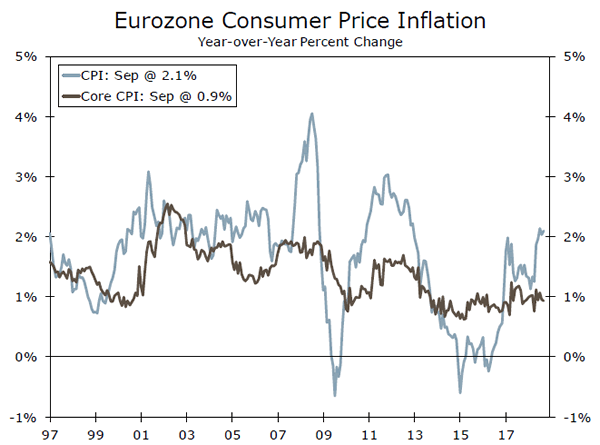
Finally, September Eurozone CPI inflation was slightly softer than forecast. The headline CPI rose 2.1% year-over-year, matching expectations, but core CPI inflation unexpectedly slowed to 0.9% year-over-year. Earlier this week ECB President Draghi spoke and sounded constructive on the price outlook, saying that he sees a relatively vigorous pickup in underlying inflation, that firmer wage growth will continue and that fiscal policies in some countries could become less neutral. Still, with few price pressures evident as of yet, further ECB tightening is likely still some way away.
Global Outlook
Japan's Tankan Survey • Monday
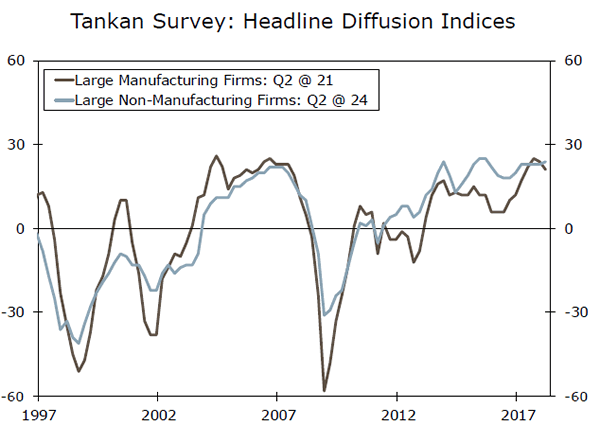
The Tankan survey is one Japan's most closely followed economic releases, offering timely insights into the performance of Japan's economy. The Q3-2018 release is due Monday, several weeks ahead of the official GDP release. Japan's economy has grown quite solidly over the past several quarters, and the Tankan survey will be scanned for clues as to whether that growth can continue.
In Q2, the large manufacturers' diffusion index fell for the second time since early 2016, but for Q3 the consensus expects the manufacturers' index to partially recover, to +22 from +21. In contrast, the large non-manufacturers' index is expected to ease to +23 from +24, after many quarters where that index has been steady to stronger. Finally, capital spending plans for fiscal year 2018 for all industries are expected to strengthen, to an increase of 13.9%. Taken together, these survey details would be sturdy enough to suggest Japan's steady economic growth can continue for the time being.
Previous: +21 (Large Manufacturers' Index) Consensus: +22 (Large Manufacturers' Index)
U.K. PMI Surveys • Monday
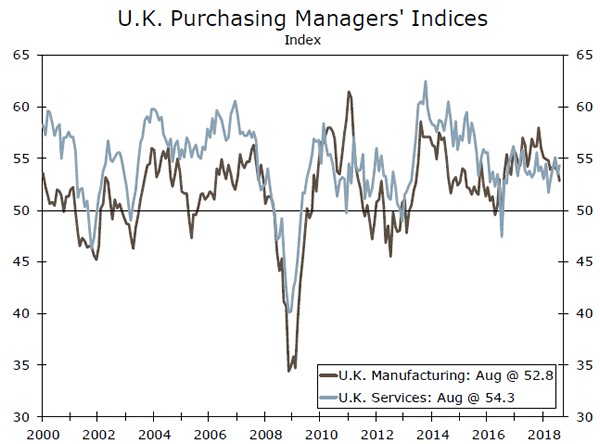
The start of the month sees the usual raft of Purchasing Managers Indices (PMI), timely and high frequency indicators that offer clues on the current state of the economy. In the U.K., the manufacturing PMI has dropped for the past three months, and is expected to slip further in September, to 52.5 from 52.8. The U.K. services PMI has been a bit more stable in recent months, but is also expected to decline in September, to 54.0 from 54.3. Overall, the PMI surveys remain at levels consistent with steady rather than strong U.K. economic growth.
The U.K. is not the only European country that releases survey data for September. In Sweden, the manufacturing PMI is expected to ease to 52.3 and the services PMI is also released. Switzerland's manufacturing PMI is forecast to decline to 62.5, while Norway's September manufacturing PMI is due.
Previous: 52.8 (Manufacturing), 54.3 (Services) Consensus: 52.5 (Manufacturing), 54.0 (Services)
Reserve Bank of Australia • Tuesday
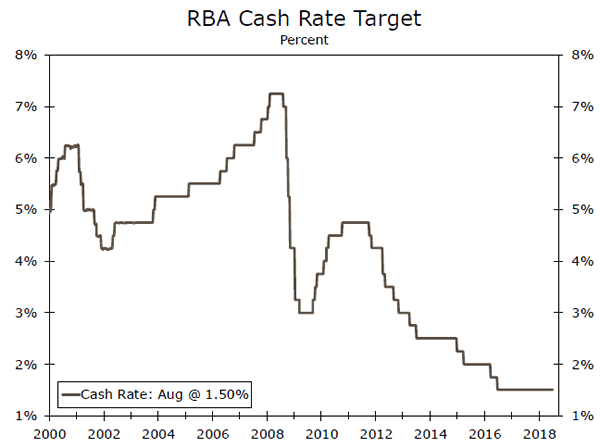
The Reserve Bank of Australia (RBA) has held its Cash Rate at 1.50% since mid-2016, and is expected to hold rates steady again when it announces its monetary policy decision next week. Growth firmed modestly in Q2, although for now CPI inflation remains near the bottom end of the central bank's 2% to 3% target range, and wage pressures remain muted. While the latest monetary policy minutes reaffirmed that the next move in the Cash Rate was more likely to be an increase than a decrease, policymakers also saw no strong case for a near-term adjustment. Accordingly, we expect the Reserve Bank of Australian to remain on hold at next week's meeting.
The Reserve Bank of India also announces its policy decision against a backdrop of strong GDP growth but some easing of inflation. India's central bank has raised rates twice since mid-year, and should raise its repo rate and reverse repo rate a further 25 bps next week.
Previous: 1.50% Wells Fargo: 1.50% Consensus: 1.50%
Point of View
Interest Rate Watch
Is Fed Policy Now "Neutral"?
As widely expected, the FOMC decided by unanimous vote on Wednesday today to raise its target range for the fed funds rate 25 bps. But in our view, the most interesting aspect of the statement that the Fed released at the end the meeting was that the FOMC no longer characterizes monetary policy as "accommodative."
In recent public announcements, some Fed policymakers have expressed their opinion that the fed funds rate would soon enter "neutral" territory. That is, monetary policy would no longer be stimulating, nor would it yet be restraining, the pace of economic activity. By removing the reference to accommodative monetary policy, the committee seems to be implicitly acknowledging that the fed funds rate has moved into neutral territory.
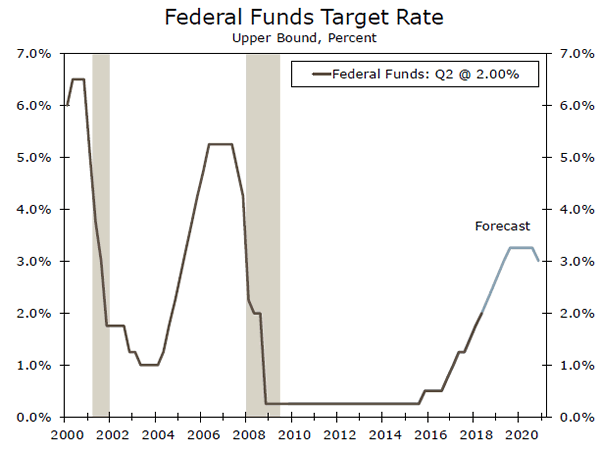
That is not to say that rates will not rise further from here. Indeed, the so-called "dot plot" shows that the FOMC believes that another 25 bps rate hike by the end of the year with another 75 bps of tightening in 2019 would be appropriate (top chart). The Fed's projection is in line with our own forecast, which looks for 100 bps of further rate hikes by the end of next year (middle chart).
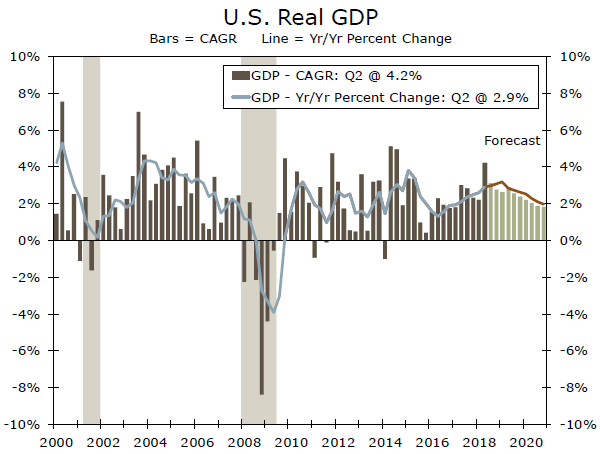
We forecast that real GDP growth will generally remain solid in coming quarters, but that it will slow somewhat from the 4.2% annualized rate that was registered in Q2-2018, as fiscal stimulus fades and as previous monetary tightening exerts some headwinds on the economy (bottom chart). Looking into 2020, we believe that growth will slow enough to lead the Fed to reverse itself by cutting rates 25 bps at the end of 2020. Admittedly, the end of 2020 is a long time from now and our visibility two years ahead is undoubtedly cloudy. In the meantime, it seems likely that the FOMC will continue to hike rates at a gradual pace. The end of this tightening cycle has not yet arrived. But by removing its reference to accommodative monetary policy in its recent policy statement, the FOMC may be signaling (in the words of Sir Winston Churchill) "the end of the beginning" of the current tightening cycle.
Credit Market Insights
More Short-Term Corporate Debt
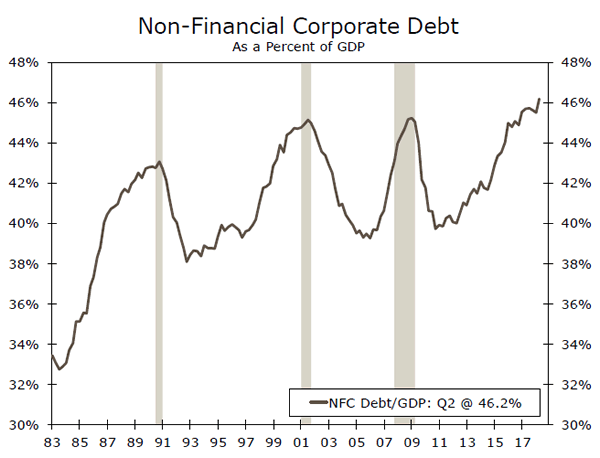
Nonfinancial corporate (NFC) debt rose to an all-time high of $9.4 trillion in Q2. This pushed the ratio of aggregate NFC debt to GDP up to 46%, also a record. Driving recent increases in corporate debt has been shortterm debt, which accounted for a disproportionate 75% of the debt increase in Q2. However, the short-term debt share remains modest relative to historical standards at 30%.
Throughout the early part of the current expansion, corporations unloaded shortterm debt, creating a rare decline in nominal aggregate NFC debt for seven consecutive quarters from 2008 to 2010. Consequently, the short-term debt share fell almost 10 percentage points from its 2007 level, to a low of 25% in late 2010, before beginning to slowly march higher again.
The choice of debt maturity for corporations depends on cyclical and secular factors. From a cyclical perspective, interest rates are important; corporations tend to favor long-term debt in the early years of an expansion in order to lock in low rates. As an expansion matures and rate cuts seem more likely in the near future, short-term debt becomes increasingly attractive. We expect corporations to continue to shift toward short-term debt as the current expansion progresses in its 10th year.
The secular trend, however, shows a decline in the short-term corporate debt share, which stood above 45% in the mid-80s, as bond markets have opened up and the term premium has fallen.
Topic of the Week
U.S. Corporate Sector Health: Should We Worry?
The current economic expansion, which recently entered its 10th year, looks likely to become the longest on record. That distinction underscores the notion that the economy is likely much closer to the next recession than it is from the past one, which has many observers wondering what might be the catalyst for the next downturn.
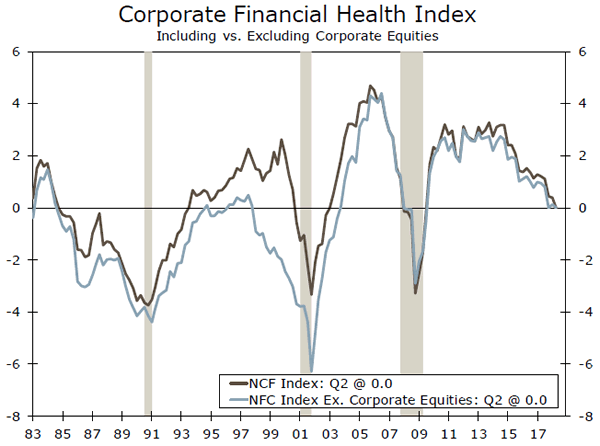
One area where an imbalance may be developing in the U.S. economy is in the nonfinancial corporate (NFC) sector. Consistent with the late stage of the credit cycle, U.S. corporations have loaded up on debt (top chart). This buildup could lead to a retrenchment in investment spending and hiring if firms face adverse developments and become financially stretched. Banks could also suffer if charge-offs rise. To gauge the health of the U.S. business sector, we have developed a Corporate Financial Health Index, which succinctly captures eight metrics.
Our index suggests that the financial health of the U.S. corporate sector has deteriorated over the past few years. Although individually none of the index's components have yet to enter "dangerous" territory, six of the eight metrics are weakening. For starters, interest rates are rising, which makes it harder for companies to service debt. Relatedly, the interest coverage ratio has declined. Leverage has also increased, while the short-term share of debt has edged higher. This makes the NFC sector more susceptible to rising rates. The quick ratio (current assets to current liabilities) has ticked down. Meanwhile, return on assets has trended lower in recent quarters.
That said, two metrics—the debt-to-asset ratio and the market-to-book ratio—are improving. In addition, the weakening in the index in recent years has not been as abrupt as it was before the prior two recessions. We also point out that a comparison to the 1990s is distorted by that era's stock market bubble, which boosted asset values and our index, until stock prices swooned (bottom chart). Today, corporate equities make up a much smaller share of assets. While we do not think that corporate financial health is "poor" at present, we see further deterioration ahead and will be watching our index.