

Sample Category Title
USDCAD Outlook: Loonie Advances after Better than Expected Canada GDP Data
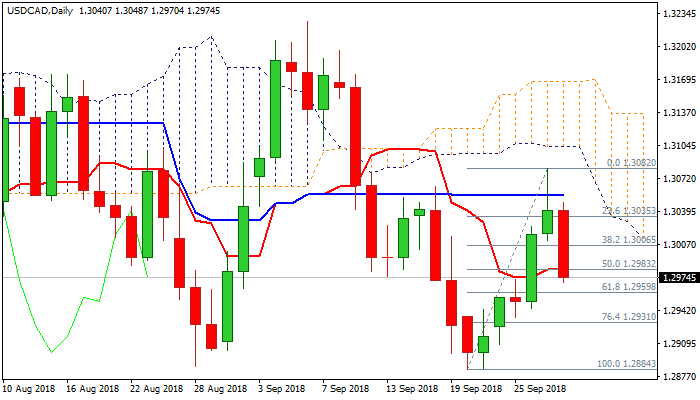
The USDCAD accelerated lower and broke below 1.30 support on Friday after data showed Canada’s economy expanded more than expected (July GDP 0.2% vs 0.1% f/c and 0.0% in June), supporting expectations for BoC’s rate hike next month.
Fresh bearish acceleration comes after Thursday’s strong upside rejection at 1.3082 (just under the base of thick daily cloud) which left daily candle with long upper shadow and signaled growing downside pressure.
Near-term structure weakened after fresh bears retraced over 50% of 1.2884/1.3082 recovery leg, while daily techs remain in bearish mode and favor further downside.
Bears found footstep at 1.2970 (10SMA), ahead of lower pivots at 1.2959 (Fibo 61.8% of 1.2884/1.3082) and 1.2927 (cracked top of weekly cloud), break of which is needed to confirm lower top and re-focus key support at 1.2884 (20 Sep low).
Res: 1.3000; 1.3024; 1.3054; 1.3087
Sup: 1.2970; 1.2959; 1.2927; 1.2884
Sunset Market Commentary
Markets
Global core bonds eked out gains today with German Bunds outperforming US Treasuries. The first upleg resulted from Italian-related safe haven flows. Technocrat FM Tria last night agreed to give the Lega-5SM coalition more budgetary leeway than agreed with Europe. The move risks triggering rating downgrades by Moody’s (Baa2) and Fitch (BBB). Italian yields increased by 32 bps to 42 bps in the 2-10yr sector with the belly of the curve underperforming. The Italian stock markets loses more than 4%. The Bund gained more pace after disappointing EMU core inflation (0.9% Y/Y from 1% Y/Y vs 1.1% Y/Y expected) which clinched with ECB President Draghi’s comments earlier this week about a vigorous (core) inflationary pressures ahead. Two technical elements – the German 10-yr yield’s return below 0.5% and end-of-month extension buying – complete today’s story. US PCE core (2% Y/Y) and headline (2.1% Y/Y) inflation matched forecasts across the Atlantic. German yields lose 3.4 bps (2-yr) to 7.3 bps (10-yr) at the time of writing. US yield decline between 1.5 and 2.0 bps across the curve. Peripheral yield spread changes vs Germany increase by 42 bps for Italy, 24 bps for Greece, 8 bps for Portugal and 7 bps for Spain.
Today, the political agreement on the Italian budget deficit dominated global trading. Italian and European equities, Italian government bonds and the euro were sold aggressively as the Italian government allowed a bigger than expected 2019 deficit (2.4% of GDP). EMU headline inflation was as expected (2.1% Y/Y). Core inflation declined to 0.9% j/j. Especially the latter was a surprise after higher than expected German inflation yesterday. However, it was only a secondary negative for the euro. Italy-driven euro selling dominated. EUR/USD traded in the mid 1.16 area at the start of European dealings, but started an almost uninterrupted decline during the morning session, reaching an intraday low in the 1.1570 area. Selling became less aggressive as US investors joined. US data spending and income data (including deflators) were marginally softer than expected but no issue for (FX) trading. EUR/USD (1.1585 area) stabilizes within reach of the intraday low. The yen is trading remarkably soft. USD/JPY (113.50 area) hardly ceded any ground despite the overall risk-off. In addition, the BOJ indicated that it will reduce buying of bonds with a maturity longer than 25 year. For now, the higher yield on these maturities isn’t enough to attract additional yen buying.
As was the case yesterday, cable and EUR/GBP mainly followed the broader trends of the dollar and the euro. EUR/GBP drifted further below the 0.89 big figure. However, the sterling ‘outperformance’ was hampered by disappointing UK eco data (current account deficit, weak Q2 business investment). EUR/GBP trades in the 0.8890 area. Cable is drifting back south in the 1.30 big figure. Markets are looking forward to the Party conference of the Conservative Party starting in Birmingham this weekend.
News Headlines
Despite the strong German inflation numbers of yesterday, today’s EMU aggregate inflation printed lower than expected. Headline inflation (Y/Y) rose from 2.0% in August to 2.1% in September. The rise is largely due to higher food and energy prices, shown by the unexpected decrease in core inflation to 0.9% Y/Y, from 1.0% Y/Y.
US inflation numbers remain near the Federal Reserve’s 2% target. The PCE deflator (Y/Y) rose 2.2% in August, a small fall from the 2.3% in July. Core inflation (Y/Y) increased 2.0%, which is stable with the month before. Consumer spending grew only 0.3% (smallest gain in six months), from 0.4% in July. Incomes rose 0.3%, while 0.4% expected.
Italian president has asked his Finance Minister Tria not to resign over his failed attempt to keep Italy’s 2019 budget deficit within the 1.6% limit. Tria already indicated he will stay on to avoid market uncertainty. Deputy PM Di Maio said Italy must dialogue with Europe and remains confident that the country’s debt will fall, despite the higher deficit.
Canada GDP Rose 0.2% in July Despite Oil Production Disruptions
Highlights:
- Canadian GDP rose a stronger-than-expected 0.2% in July as an expected transitory drop in oil sands production proved smaller than feared. Markets expected a 0.1% increase.
- Looking through a transitory dip in oil sands output — as well as a weather-related jump in utilities production — underlying growth continues to look solid.
- International trade concerns remain, but the current economic backdrop also clearly still looks strong enough to warrant further interest rate hikes.
Our Take:
The upside surprise relative to market expectations for a 0.1% increase was largely accounted for by a smaller-than-assumed drop in nonconventional oil extraction despite transitory production disruptions at a major oil sands producer. A 3.2% decline in oil sands production nonetheless still subtracted about 0.1ppt from the headline increase. Underlying details were about as firm as expected. Manufacturing production jumped 1.2% and wholesale trade rose 1.4%. Activity at real estate brokerages increased for a second straight month. Utilities output jumped 2.1% although that should reverse as temperatures return to normal after an unusually hot summer. A sharp 1.5% pullback in residential construction activity was the main soft spot. Housing starts were down from earlier in the year over the last couple of months but are still running at a relatively solid 200k+level.
With the increase in July, Q3 GDP growth is tracking almost a percentage point above the Bank of Canada’s call in July for a 1.5% increase (and our own call for a 1.6% gain) in large part, though, because of a smaller-than-expected transitory decline in oil production. Less of a drag from that factor in Q3 also means less of a rebound in Q4 to leave underlying trends running about as expected — and still looking quite solid. Fears of significant trade disruptions with the U.S. have not gone away but, in the mean-time, the economic backdrop still looks clearly strong enough to warrant further Bank of Canada interest rate hikes.
USD/JPY Mid-Day Outlook
Daily Pivots: (S1) 112.82; (P) 113.15; (R1) 113.73; More...
Intraday bias in USD/JPY remains on the upside for the moment. Rise from 104.62 has just resumed. Further rally should be seen to 114.73 key resistance next. Decisive break there will should confirm larger bullish case. On the downside, break of 112.55 support is needed to indicate short term topping. Otherwise, near term outlook will remain bullish in case of retreat.
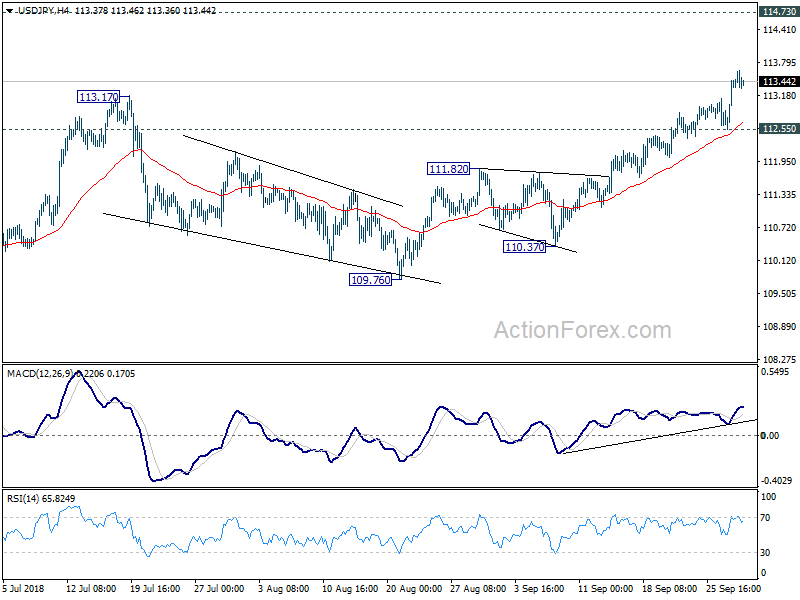
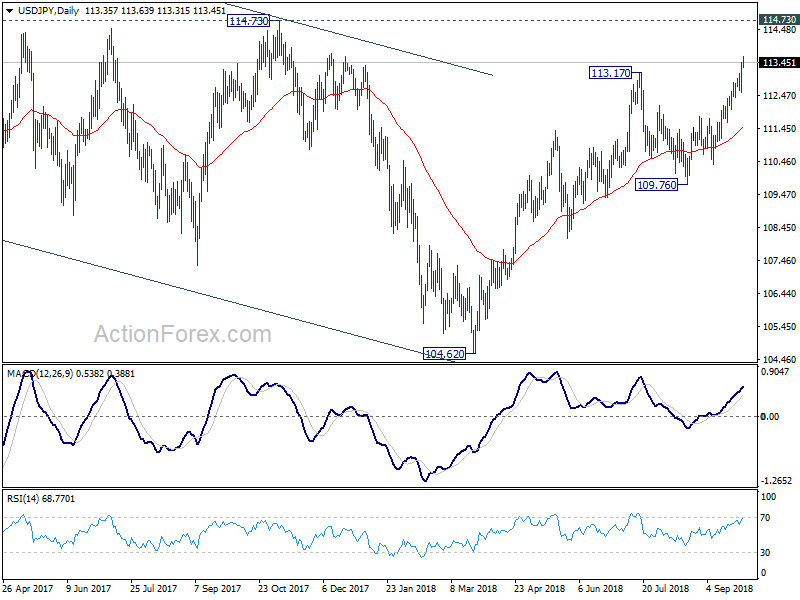
In the bigger picture, corrective fall from 118.65 (2016 high) should have completed with three waves down to 104.62. Decisive break of 114.73 resistance will likely resume whole rally from 98.97 (2016 low) to 100% projection of 98.97 to 118.65 from 104.62 at 124.30, which is reasonably close to 125.85 (2015 high). This will stay as the preferred case as long as 109.76 support holds.
USD/CHF Mid-Day Outlook
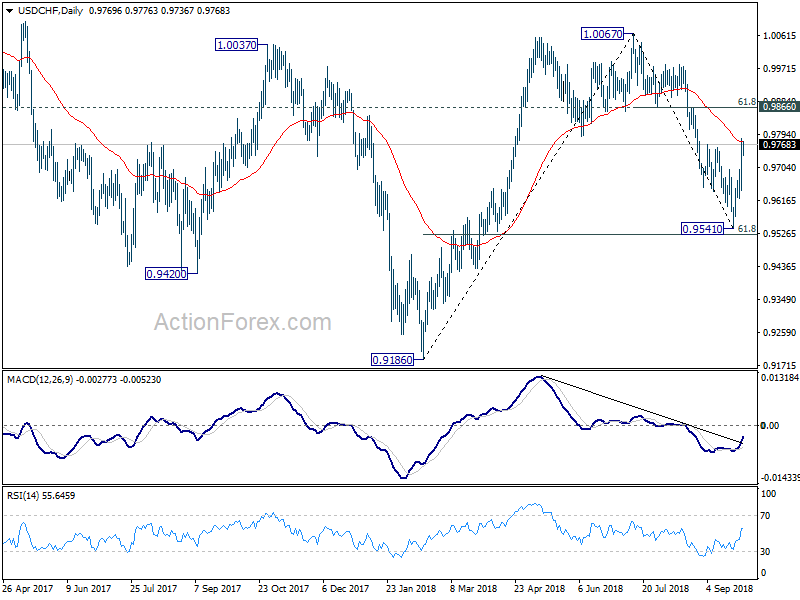
Daily Pivots: (S1) 0.9685; (P) 0.9734; (R1) 0.9822; More...
Intraday bias in USD/CHF remains on the upside as rebound from 0.9541 is in progress. Further rally should be seen to 0.9866 key resistance level, 61.8% retracement of 1.0067 to 0.9541 at 0.9866. Decisive break there will bring retest of 1.0067 high. On the downside, below 0.9700 minor support will turn intraday bias neutral first.
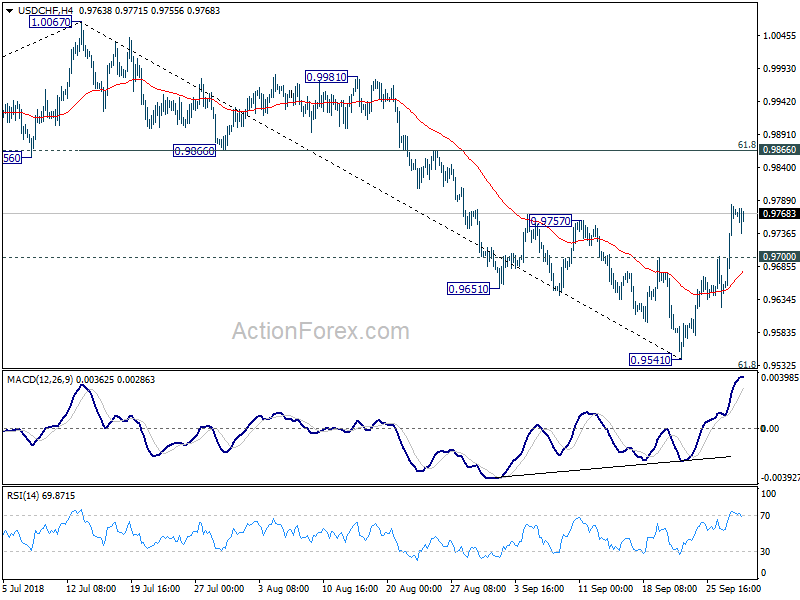
In the bigger picture, rise from 0.9186 low has completed at 1.0067, after failing to sustain above 1.0037 resistance. Fall from 1.0067 could extend to 61.8% retracement of 0.9816 to 1.0067 at 0.9523 and possibly below. But for now, we don't expect a break of 0.9186 low. On the upside, firm break of 0.9866 support turned resistance will suggest that fall from 1.0067 has completed and rise from 0.9186 is resuming.
GBP/USD Mid-Day Outlook
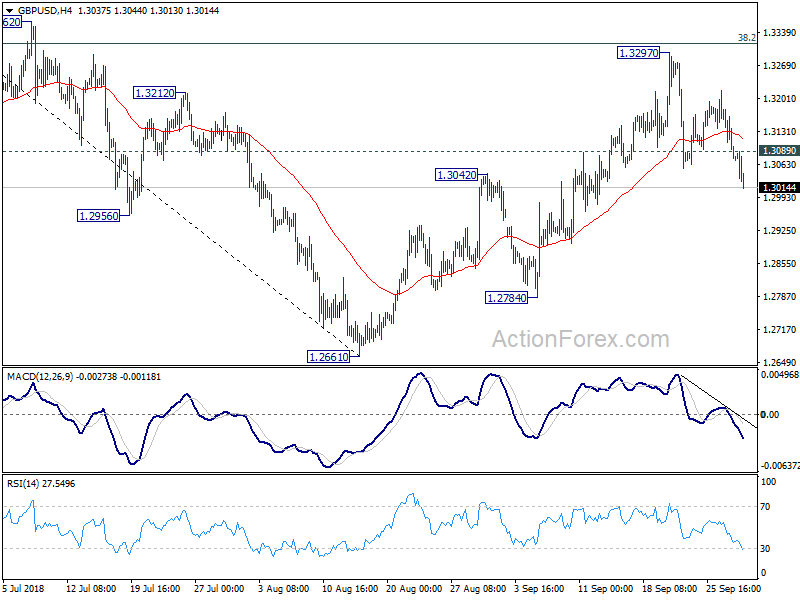
Daily Pivots: (S1) 1.3040; (P) 1.3114; (R1) 1.3153; More...
GBP/USD drops to as low as 1.3013 so far today. The break of 1.3042 resistance turned support confirmed our view that corrective rise from 1.2661 has completed at 1.3297, ahead of 1.3316 key fibonacci level. Intraday bias is back on the downside for 1.2784 support first. Break will likely resume larger down trend from 1.4376 through 1.2661. On the upside, above 1.3089 minor resistance will turn intraday bias neutral and bring consolidation, before staging another decline.
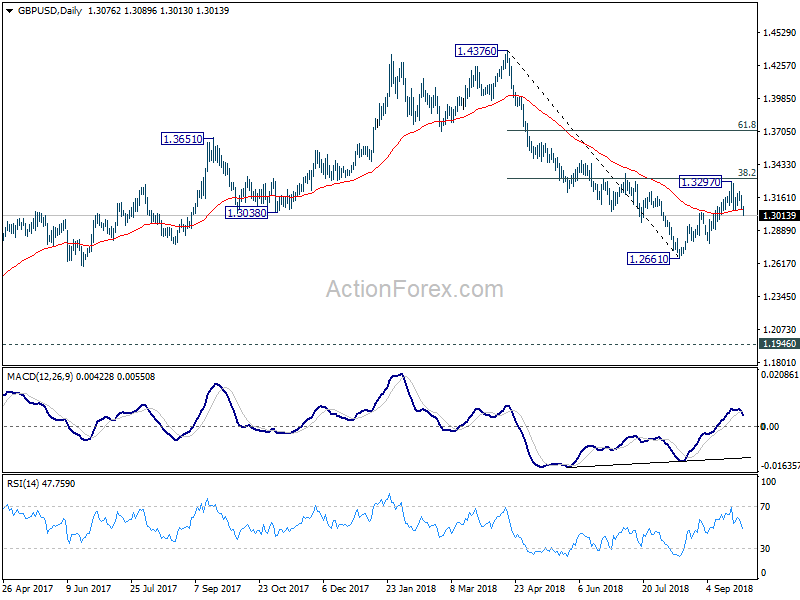
In the bigger picture, whole medium term rebound from 1.1946 (2016 low) should have completed at 1.4376 already, after rejection from 55 month EMA (now at 1.4062). The structure and momentum of the fall from 1.4376 argues that it's resuming long term down trend. And this will be the preferred case as long as 38.2% retracement of 1.4376 to 1.2661 at 1.3316 holds. However, firm break of 1.3316 would bring stronger rebound to 61.8% retracement at 1.3721. And, the eventual depth of the fall from 1.4376, and the chance of hitting 1.1946 low, will depend on the strength of the interim corrective rebound from 1.2661.
Canada Starts Q3 on Solid Footing
Economic activity rose 0.2% month-on-month in July. Gains were relatively concentrated as 12 of 20 major industries increased their output during the month.
Both the goods and services producing sides of the economy advanced. On the goods side (+0.3% m/m), manufacturers led the charge, up 1.2%. Non-durables manufacturing roared ahead 2.4% in the wake of earlier maintenance shutdowns, while durables output rose 0.3% in July. One weak spot was mining, quarrying and oil and gas (-0.3%), where a back-to-back drop in oil and gas extraction held activity back, owing largely to a disruption at a major facility.
On the services side (+0.2% m/m), wholesale trade (+1.4%) and transportation (+0.9%) topped the growth charts. The recovery in housing activity continues to make itself felt via real estate agents and brokers – the 1.0% climb in this subsector helped drive a 0.3% monthly climb in the broader real estate, rental and leasing sector.
Key Implications
Not too shabby. Economic growth may be set to moderate after the second quarter's impressive performance, but we still look set for another above-trend quarter. Today's data gives us more confidence in our above-consensus tracking of 2.4% for Q3 growth (Q/Q, annualized).
If there is a weak point in today's release, it is the lack of breadth. Much of the gain can be put down to a handful of sectors, with performances in utilities and manufacturing unlikely to be repeated. On the flip side, the resumption of activity in the oil and gas sector should provide a decent backing for further growth over the remainder of the summer. Long story short, we are once again seeing decent fundamentals masked by idiosyncratic (but positive) surprises.
With both growth and inflation set to outpace the Bank of Canada's expectations, unless we see a significant setback on NAFTA or a serious deterioration in the Business Outlook Survey, another policy interest rate increase at the October 24th decision remains a safe bet.
US: Core Inflation at 2% amidst Healthy Consumer Spending
Personal income rose 0.3% in August, a hair below market expectations for 0.4% Adjusted for inflation and removing taxes, real disposable income was up a softer 0.1% in the month.
Personal spending also rose 0.3% in nominal terms, on par with the consensus estimate. In real terms, spending rose 0.2%, led by non-durable spending (+0.4%). Both durables and services came in at a solid 0.2%.
The headline PCE price index rose 0.1% in August, while the core measure was flat in the month. Year-over-year, headline inflation edged down to 2.2%, but the core measure held in at 2.0%.
Key Implications
As consumers go, so goes the economy. Consumer spending is likely to advance by over 3.0% in the third quarter and remain a mainstay of economic growth. Beyond that, spending growth should be expected to slow somewhat as the boost from tax cuts fades.
Core inflation is at the Federal Reserve's target, but shows few signs of breaking out much above it. We continue to watch for signs of tariff impacts creeping into price growth, but so far evidence is relatively scant, an outcome we attribute to the buoyant U.S. dollar.
EUR/USD Mid-Day Outlook
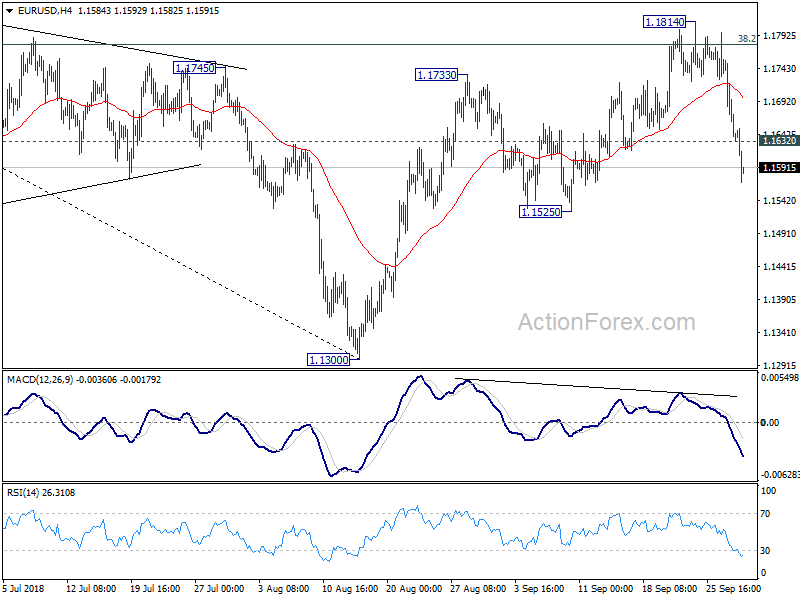
Daily Pivots: (S1) 1.1601; (P) 1.1680; (R1) 1.1721; More.....
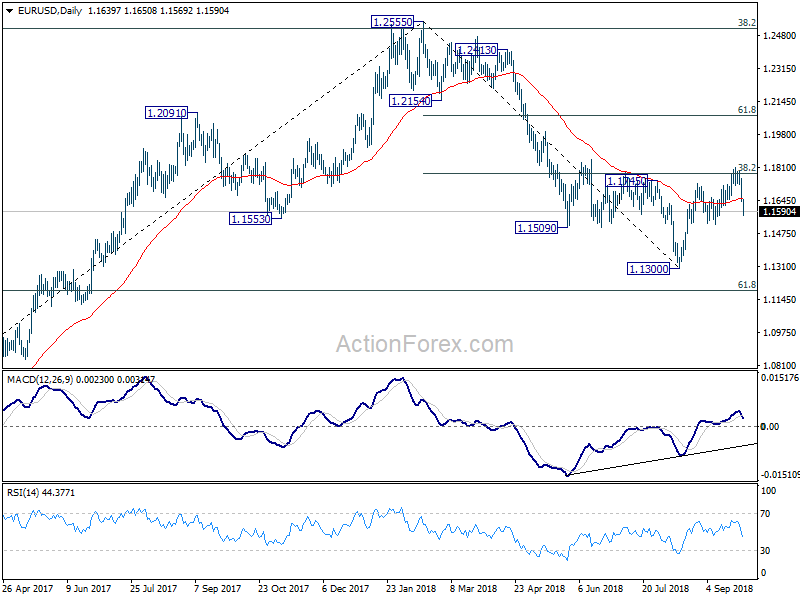
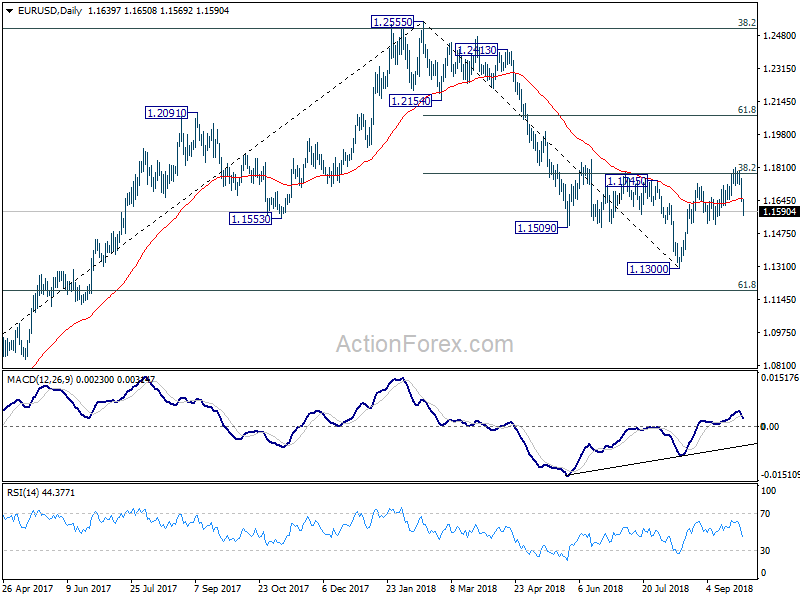
EUR/USD's decline from 1.1814 accelerates to as low as 1.1569 so far today. Intraday bias remains on the downside for 1.1525 support. . As noted before, corrective rise from 1.1300 should have completed at 1.1814, after meeting strong resistance from 38.2% retracement of 1.2555 to 1.1300 at 1.1779. Break of 1.1525 support will confirm this bearish view and target a test on 1.1300 low. On the upside, above 1.1632 minor resistance will turn intraday bias neutral and bring recovery. But upside should be limited well below 1.1814 to bring fall resumption.
In the bigger picture, a medium term bottom should be in place at 1.1300, on bullish convergence condition in daily MACD and some consolidations would be seen. But still, note that EUR/USD was rejected by 38.2% retracement of 1.6039 (2008 high) to 1.0339 (2017 low) at 1.2516. That carries some long term bearish implications. Thus, we'd expect fall from 1.2555 high to resume after consolidation completes. Below 1.1300 should send EUR/USD through 61.8% retracement of 1.0339 to 1.2555 at 1.1186. And, in that case, EUR/USD would head to retest 1.0339 (2017 low).
Euro Selloff Intensifies as Markets Response to Italy Budget Deficit Overwhelmingly Negative
A long list of economic data are released today. But the main focus is on Italy. The coalition government's decision to target budget deficit at 2.4% of GDP for the next three years drew heavy criticism from EU. Also, financial market reactions are overwhelmingly negative. European stocks decoupled from risk appetite in Asian and trade deeply in red. Italian yield surged to the level at the beginning of the month while German 10 year bund is back deep below 0.5.
Euro suffered broad based selling and is trading as the weakest one for the day. Sterling follows as the second weakest and New Zealand Dollar as the third weakest. Canadian Dollar is boosted by stronger than expected GDP data and is now the strongest one for the day. It's followed by Australian Dollar and than Swiss Franc. Meanwhile, Dollar is mixed as post FOMC rally lost momentum while PCE provided no inspirations.
In other markets, at the time of writing, DAX leads European decline and is down -1.79%, CAC down -1.19%. FTSE is down -0.55%. Italian 10 year yield is trading up 0.364 at 3.256. German 10 year bund yield is down -0.700 at 0.462, well below 0.5 handle now. Risk appetite was strong in Asia though. Nikkei reached as high as 24286 and breached 24129.34 resistance. But it closed at 24120.04, up 1.36%. Hong Kong HSI was up 0.26%, China Shanghai SSE up 1.06% and Singapore Strait Times was up 0.64%.
US personal income and spending missed expectations, core PCE unchanged at 2%
US personal income rose 0.3% in August, below expectation of 0.4%. Spending rose 0.3%, below expectation of 0.4%. Headline PCE slowed to 2.2% yoy, down from 2.3% yoy and missed expectation of 2.3% yoy. Core PCE was unchanged at 2.0% yoy, matched expectations.
Canadian Dollar jumps as GDP grew 0.2%, led by manufacturing
Canadian Dollar surges after stronger than expected GDP data. GDP grew 0.2% mom in July versus expectation of 0.1% mom. The growth was "concentrated" as 12 of 20 sectors were up, led by manufacturing, wholesale trade, utilities and transportation and warehousing. Good-producing industries grew 0.3% mom while services-producing industries grew 0.2% mom. Also from Canada, IPPI dropped -0.5% mom in August. RMPI dropped -4.6% mom.
Italian bond yield jumps on budget deficit target, 5-star Maio not worried
European Commission said today that it would assess the draft budget plan of Italy before end of November. But it's spokesman emphasized it's just "part of the normal European Semester process, the EU's economic policy coordination cycle, and happens each year."
European Economics Commissioner Pierre Moscovici noted that nothing would be gained from a clash with Italy but added "we don't have any interest either that Italy does not respect the rules and does not reduce its debt, which remains explosive."
5-Star Movement leader Luigi Di Maio, also Deputy Prime Minister of Italy, said he was not worried by market reaction and will meet investors soon.
Eurozone CPI rose to 2.1% but core slowed to 0.9%
Eurozone headline CPI rose to 2.1% yoy in September, up from 2.0% yoy and matched expectation. However, Core CPI slowed to 0.9% yoy, down from 1.0% yoy and missed expectation of 1.1% yoy. Energy inflation remained strong, at 9.5% yoy, followed by food, alcohol & tobacco at 2.7%. The reading is likely unwelcome by ECB.
Also released, Germany unemployment rose 23k in September, unemployment rate dropped 0.1% to 5.2%.
UK Q2 GDP finalized at 0.4% qoq, unrevised
UK Q2 GDP was finalized at 0.4% qoq, unrevised. Growth were driven by services sector, which increased by 0.6%, partly on retail sales. Household spending grew 0.4% but business investment dropped notably by -0.7%. ONS noted that "the recent narrative on UK GDP remains unchanged – the underlying trend is still one of slowing real GDP growth." Also from UK, current account deficit widened to GBP -20.3B in Q2.
Swiss KOF rose to 102.2, down trend halted
Swiss KOF Economic Barometer rose notably to 102.2 in September, up 3.3 pts from 98.9. It also beat expectation of 100.1. KOF noted the this may imply that the downward trend, which has been visible since the beginning of 2018, might have come to a halt.
The strongest positive contributions came from manufacturing sector. And among manufacturing, "positive development can be attributed mainly to the metal processing industry, followed by the machine building and the food processing as well as the textile industries and finally the chemical industry." Meanwhile, overall improvement in manufacturing is driven by "a more optimistic assessment of employment, followed by the assessments of production and the overall business situation".
BoJ: Growing downside risks stemming from trade frictions
In the summary of opinions of September 18-19 BoJ meeting, it's noted that the "he underlying trend in Japan's economic activity has not changed significantly". But there were growing downside risks "stemming from trade friction between such economies as the United States and China as well as from fluctuations in financial markets."
On inflation, the summary noted "it is gradually becoming clear that the delay in a rise in inflation is affected by not only a mere demand shortage, but also various factors such as the persistent deflationary mindset and improvement in productivity stemming from expansion in supply capacity."
On monetary policy, the summary noted both then need to "persistently maintain highly accommodative financial conditions" and "carefully examining the positive effects and side effects" of easing. Also, there is "room" to make policy "more flexible" for "market functioning".
A batch of economic data is also released from Japan. Tokyo CPI core accelerated to 1.0% yoy in September versus expectation of 0.9% yoy Unemployment rate dropped to 2.4% in August versus expectation of 2.5%. Retail sales rose more than expected by 2.7% yoy. However, industrial production missed and rose only 0.7% mom.
EUR/USD Mid-Day Outlook
Daily Pivots: (S1) 1.1601; (P) 1.1680; (R1) 1.1721; More.....
EUR/USD's decline from 1.1814 accelerates to as low as 1.1569 so far today. Intraday bias remains on the downside for 1.1525 support. . As noted before, corrective rise from 1.1300 should have completed at 1.1814, after meeting strong resistance from 38.2% retracement of 1.2555 to 1.1300 at 1.1779. Break of 1.1525 support will confirm this bearish view and target a test on 1.1300 low. On the upside, above 1.1632 minor resistance will turn intraday bias neutral and bring recovery. But upside should be limited well below 1.1814 to bring fall resumption.
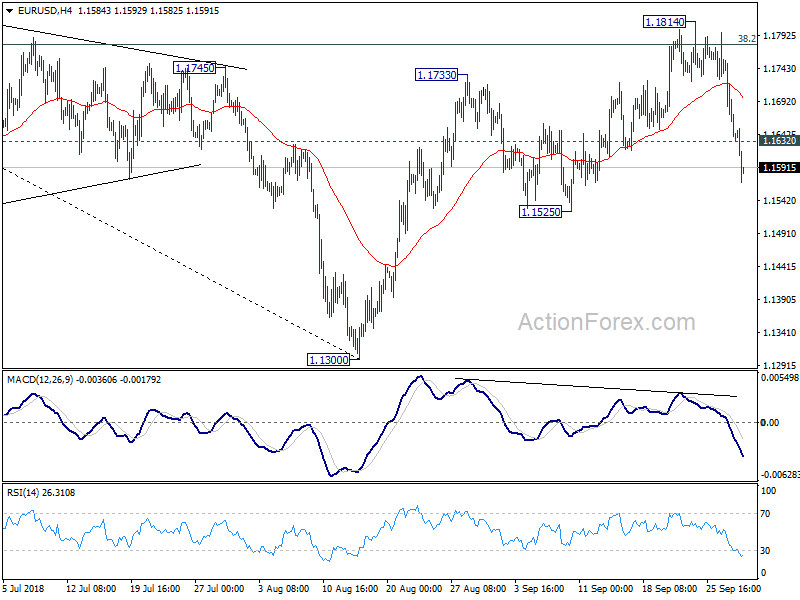
In the bigger picture, a medium term bottom should be in place at 1.1300, on bullish convergence condition in daily MACD and some consolidations would be seen. But still, note that EUR/USD was rejected by 38.2% retracement of 1.6039 (2008 high) to 1.0339 (2017 low) at 1.2516. That carries some long term bearish implications. Thus, we'd expect fall from 1.2555 high to resume after consolidation completes. Below 1.1300 should send EUR/USD through 61.8% retracement of 1.0339 to 1.2555 at 1.1186. And, in that case, EUR/USD would head to retest 1.0339 (2017 low).
Economic Indicators Update
| GMT | Ccy | Events | Actual | Forecast | Previous | Revised |
|---|---|---|---|---|---|---|
| 22:45 | NZD | Building Permits M/M Aug | 7.80% | -10.30% | -10.80% | |
| 23:01 | GBP | GfK Consumer Confidence Sep | -9 | -8 | -7 | |
| 23:30 | JPY | Unemployment Rate Aug | 2.40% | 2.50% | 2.50% | |
| 23:30 | JPY | Tokyo CPI Core Y/Y Sep | 1.00% | 0.90% | 0.90% | |
| 23:50 | JPY | BOJ Summary of Opinions | ||||
| 23:50 | JPY | Industrial Production M/M Aug P | 0.70% | 1.50% | -0.10% | -0.20% |
| 23:50 | JPY | Retail Trade Y/Y Aug | 2.70% | 2.20% | 1.50% | |
| 05:00 | JPY | Housing Starts Y/Y Aug | 1.60% | 0.40% | -0.70% | |
| 07:00 | CHF | KOF Leading Indicator Sep | 102.2 | 100.1 | 100.3 | 98.9 |
| 07:55 | EUR | German Unemployment Change Sep | 23K | -9K | -8K | |
| 07:55 | EUR | German Unemployment Claims Rate Sep | 5.10% | 5.20% | 5.20% | |
| 08:30 | GBP | Current Account Balance (GBP) Q2 | -20.3B | -19.4B | -17.7B | -15.7B |
| 08:30 | GBP | GDP Q/Q Q2 F | 0.40% | 0.40% | 0.40% | |
| 09:00 | EUR | Eurozone CPI Estimate Y/Y Sep | 2.10% | 2.10% | 2.00% | |
| 09:00 | EUR | Eurozone CPI Core Y/Y Sep A | 0.90% | 1.10% | 1.00% | |
| 12:30 | CAD | Industrial Product Price M/M Aug | -0.50% | 0.60% | -0.20% | |
| 12:30 | CAD | Raw Materials Price Index M/M Aug | -4.60% | 0.80% | 0.70% | |
| 12:30 | CAD | GDP M/M Jul | 0.20% | 0.10% | 0.00% | |
| 12:30 | USD | Personal Income Aug | 0.30% | 0.40% | 0.30% | |
| 12:30 | USD | Personal Spending Aug | 0.30% | 0.40% | 0.40% | |
| 12:30 | USD | PCE Deflator M/M Aug | 0.10% | 0.20% | 0.10% | |
| 12:30 | USD | PCE Deflator Y/Y Aug | 2.20% | 2.30% | 2.30% | |
| 12:30 | USD | PCE Core M/M Aug | 0.00% | 0.20% | 0.20% | |
| 12:30 | USD | PCE Core Y/Y Aug | 2.00% | 2.00% | 2.00% | |
| 13:45 | USD | Chicago PMI Sep | 63.8 | 63.6 | ||
| 14:00 | USD | U. of Mich. Sentiment Sep F | 96 | 100.8 |