Sample Category Title
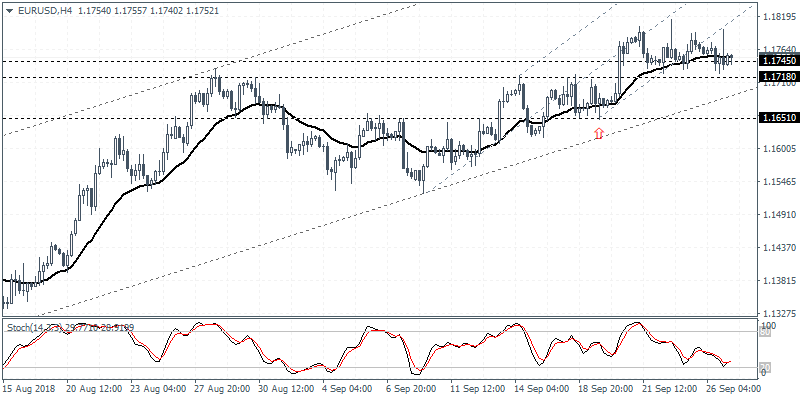
DAX Key Resistance At 12415.00
Pivot (invalidation): 12415.00
Our preference Short positions below 12415.00 with targets at 12318.00 & 12265.00 in extension.
Alternative scenario Above 12415.00 look for further upside with 12460.00 & 12530.00 as targets.
Comment The RSI is mixed.
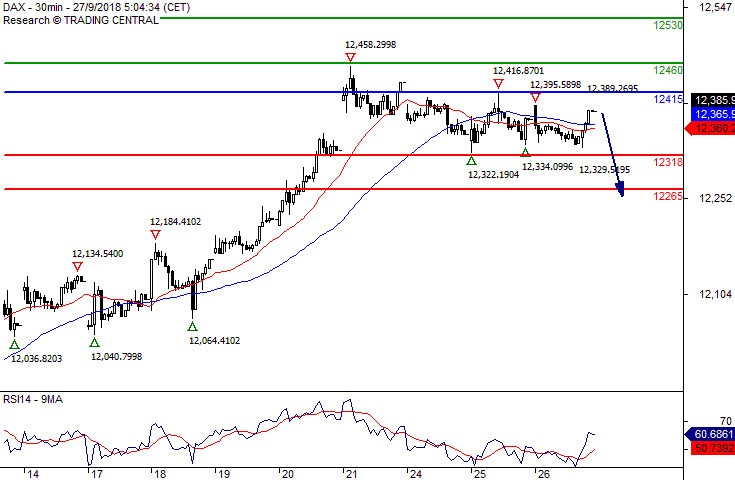
Crude Oil Turning Up
Pivot (invalidation): 71.90
Our preference Long positions above 71.90 with targets at 72.80 & 73.20 in extension.
Alternative scenario Below 71.90 look for further downside with 71.45 & 70.95 as targets.
Comment The RSI advocates for further upside.
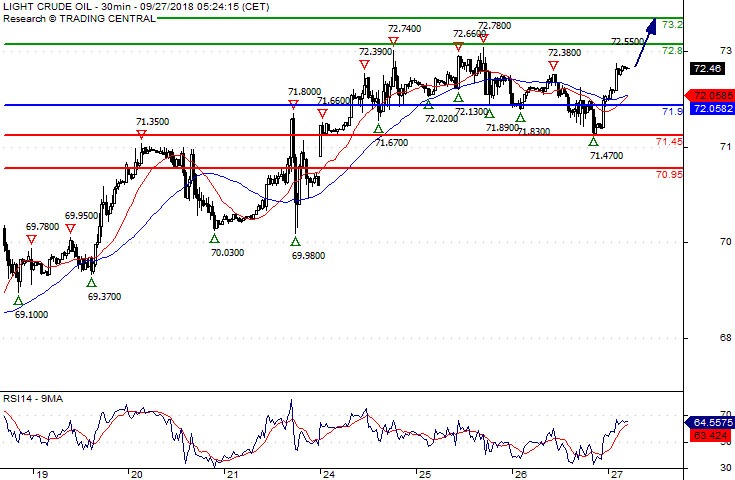
Silver Spot Turning Up
Pivot (invalidation): 14.3400
Our preference Long positions above 14.3400 with targets at 14.5600 & 14.6500 in extension.
Alternative scenario Below 14.3400 look for further downside with 14.2900 & 14.2000 as targets.
Comment The RSI shows upside momentum.
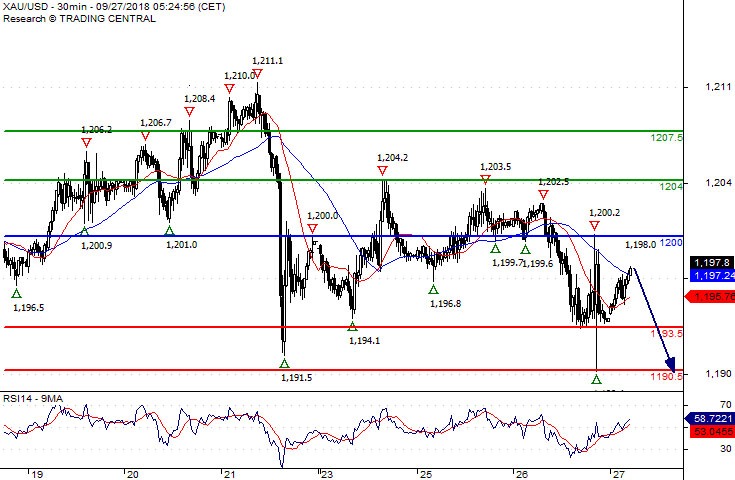
Gold Spot Key Resistance At 1200.00
Pivot (invalidation): 1200.00
Our preference Short positions below 1200.00 with targets at 1193.50 & 1190.50 in extension.
Alternative scenario Above 1200.00 look for further upside with 1204.00 & 1207.50 as targets.
Comment A break below 1193.50 would trigger a drop towards 1190.50.
GBP/USD Challenges Support Of Bear Flag Chart Pattern
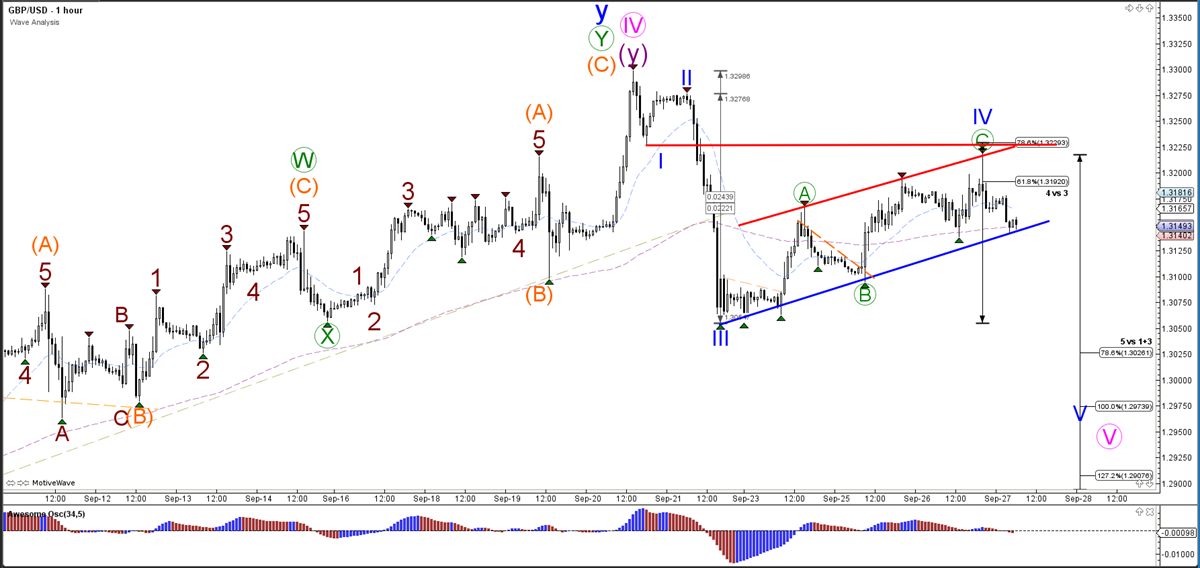
The GBPUSD currency pair is building a potential bear flag chart pattern, which could be part of a wave 4 (blue) pattern as long as the price does not break above the bottom of wave 1, which is indicated by the red trend line. A break below the support (blue) of the bear flag could indicate a continuation towards the Fibonacci targets.
The GBPUSD currency pair could have made an ABC (green) pattern within wave 4 (blue), but the confirmation of that occurs when the price breaks through the support line (blue). A break above the resistance invalidates this wave pattern.
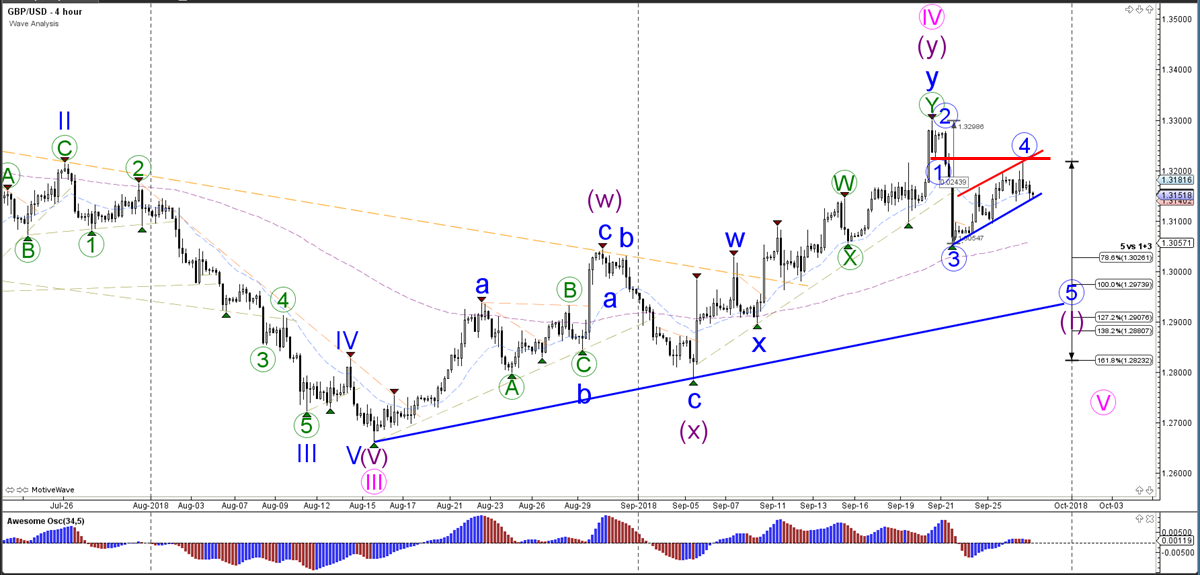
The GBPUSD currency pair made a bearish bounce at the 38.2% Fibonacci level when reviewing the daily chart. The price needs to break the support trend line (blue) before the completion of wave 4 (pink), and the start of wave 5 (pink) becomes more likely.
EUR/USD Bearish Reversal After Failure To Break Above 1.18
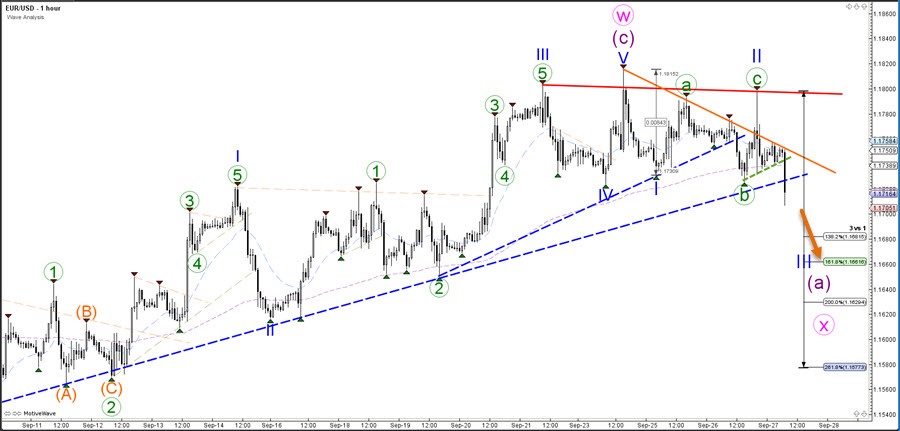
The EUR/USD broke below the support trend lines (green/blue) which is indicating a larger bearish breakout. The uptrend failed to break the resistance lines and price is now showing potential for a larger reversal.
The EUR/USD bearish breakout could indicate the end of the wave W (pink) and the start of the wave X (pink). The main targets are probably the 50-61.8%Fibonacci levels around 1.15 and 1.550.
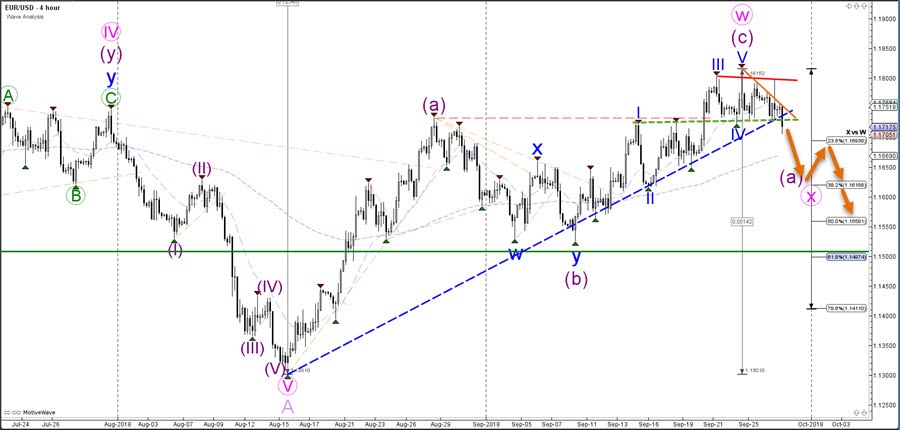
The EUR/USD failed to break resistance and instead broke below the support zone. This makes it likely that price is not in a bullish wave pattern but in a bearish 123 (blue).
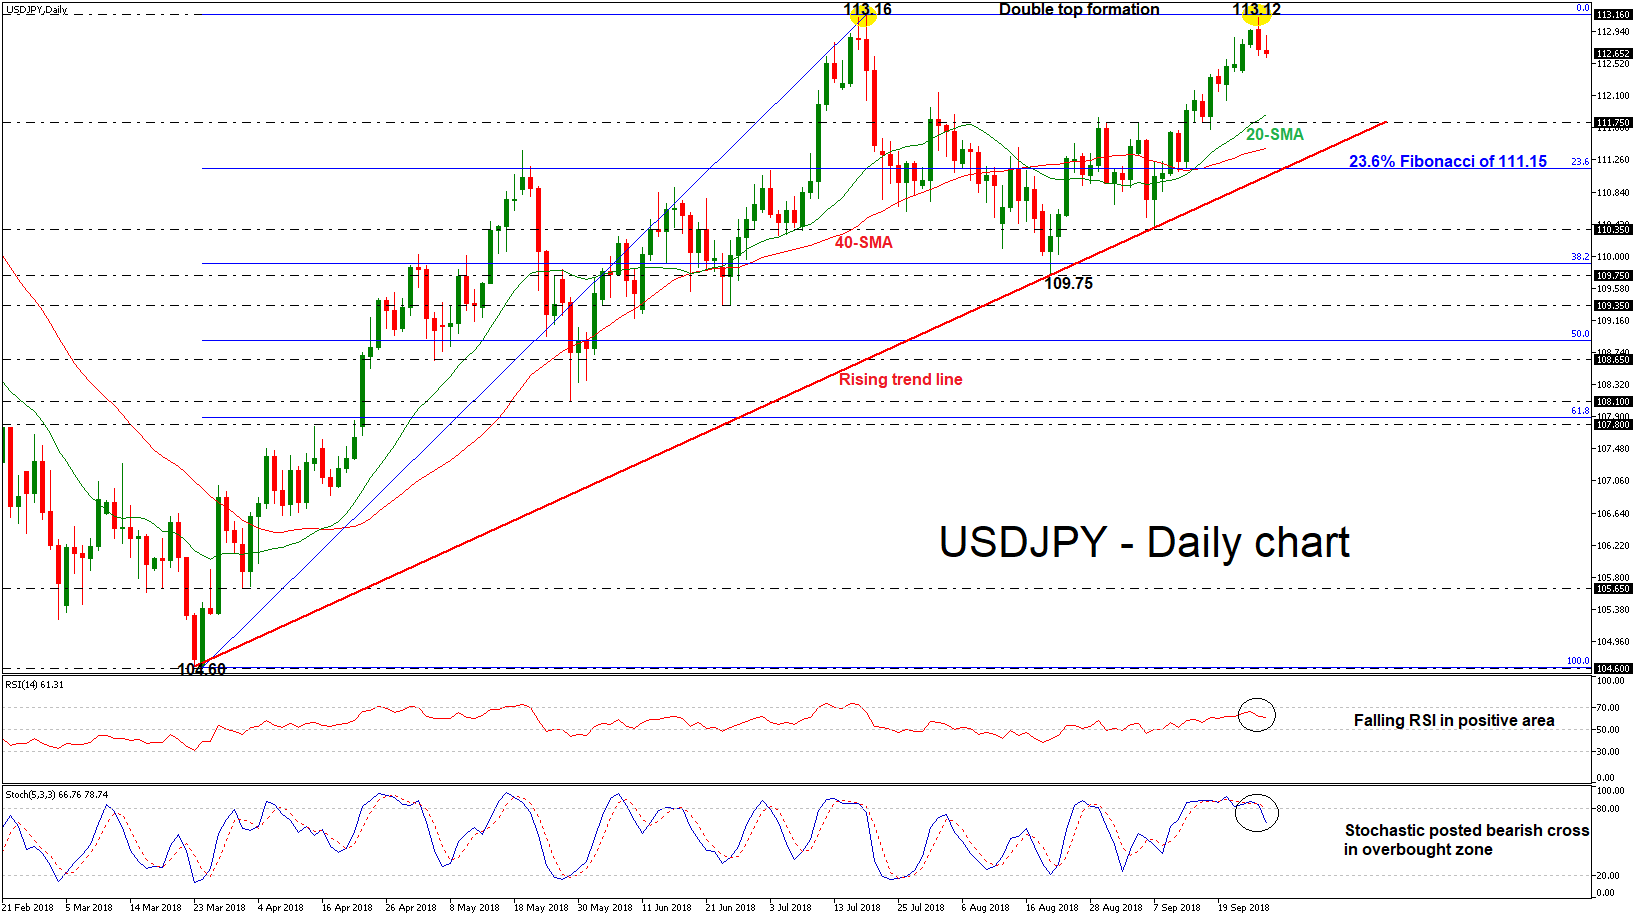
USDJPY Erases Gains After Hitting 2-Month High, Posts Double Top Near 113.12
USDJPY has reversed to the downside after printing a new two-month high of 113.12 in Wednesday’s trading session, posting a double top formation. Despite the latest pullback though, the pair has not posted a fresh lower low, which makes one hesitant to trust further strong declines for now. However, a short-term bearish correction is possible.
Looking at momentum indicators, the RSI is slipping in the positive territory, suggesting that the market could keep moving slightly lower in the near term. The stochastic oscillator recorded a bearish crossover within its blue %K line and the red %D line, indicating more losses.
Should the pair manage to strengthen its negative momentum, the next support could come around the 111.75 region, which stands near the 20-day simple moving average (SMA). A break below this area would challenge the medium-term ascending trend line, near the 23.6% Fibonacci retracement level of the upleg from 104.60 to 113.16, at 111.15. Moreover, a penetration to the downside of the ascending line would shift the bias to a more neutral to bearish one.
On the flip side, if the bulls take the upper hand again, price advances may stall initially near the latest highs near 113.16. A potential upside violation of the aforementioned level would drive the pair until the next resistance of 113.70, taken from the high on December 2017. Further gains could open the door for the 114.70 hurdle, identified by the peak on November 2017.
Overall, USDJPY has been developing within an uptrend since March 26, however, it created a double top formation near 113.12, indicating a possible bearish retracement in the near term.
XAUUSD Intraday Analysis
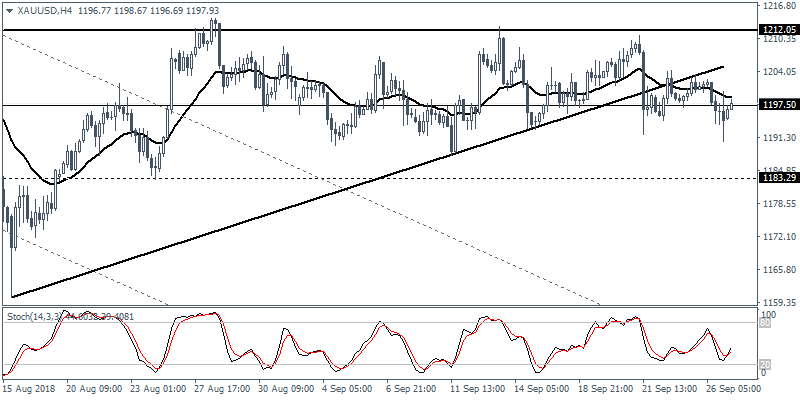
XAUUSD (1197.93): Gold prices continue to trade flat within the 1212.20 and 1196.00 levels. The downside breakout of the minor rising trend line indicates a possible decline toward the 1183.30 level of support. The direction remains flat at the moment, but we could expect to see a reversal near the lower support. Failure to hold the declines near 1183.30 could, however, turn the trend to the downside
GBPUSD Intraday Analysis
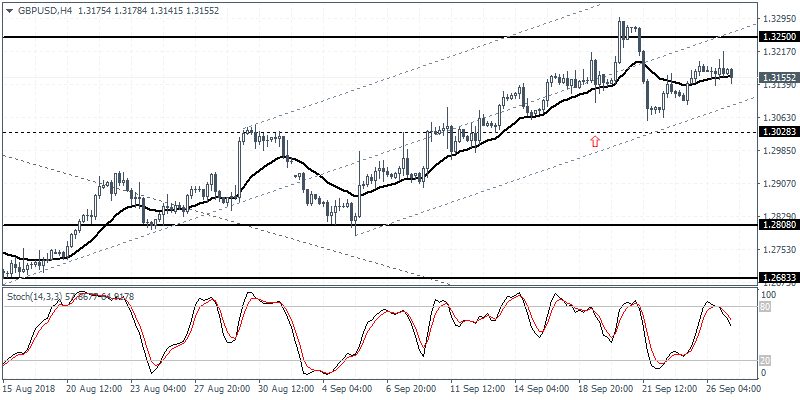
GBPUSD (1.3155): The British pound closed with a doji pattern on Wednesday. Price action is likely to see a modest pullback in the near term. The support at 1.3028 is yet to be tested firmly in the near term. There is scope for GBPUSD to retest the previously established resistance level at 1.3250. However, a bounce of 1.3028 support is required to confirm the upside
EURUSD Intraday Analysis
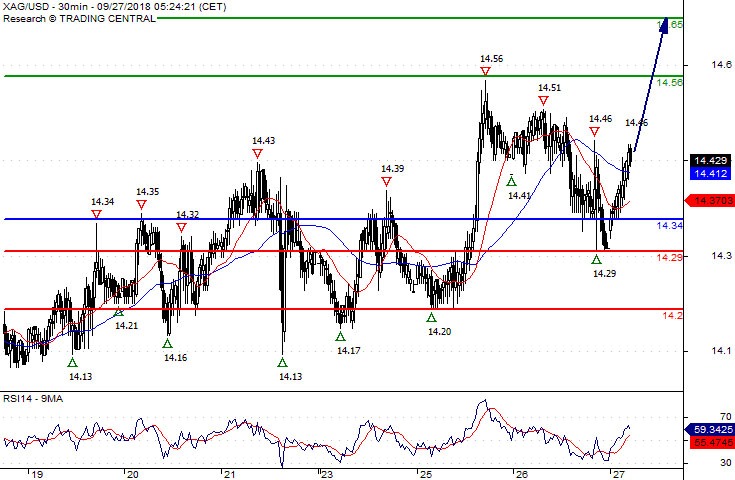
EURUSD (1.1752): The EURUSD currency pair managed to hold the ground staying around the 1.1745 handle. With the support area of 1.1745 - 1.1718 holding, price action could be seen pushing gradually higher. The 4-hour Stochastics oscillator is also likely to signal a move to the upside. The common currency will need to break out above the previous highs of 1.1795 to post further gains. The next main target is seen at 1.1960 - 1.1920 level of resistance.