Sample Category Title
Swiss Franc Trading Lower In The Asian Session
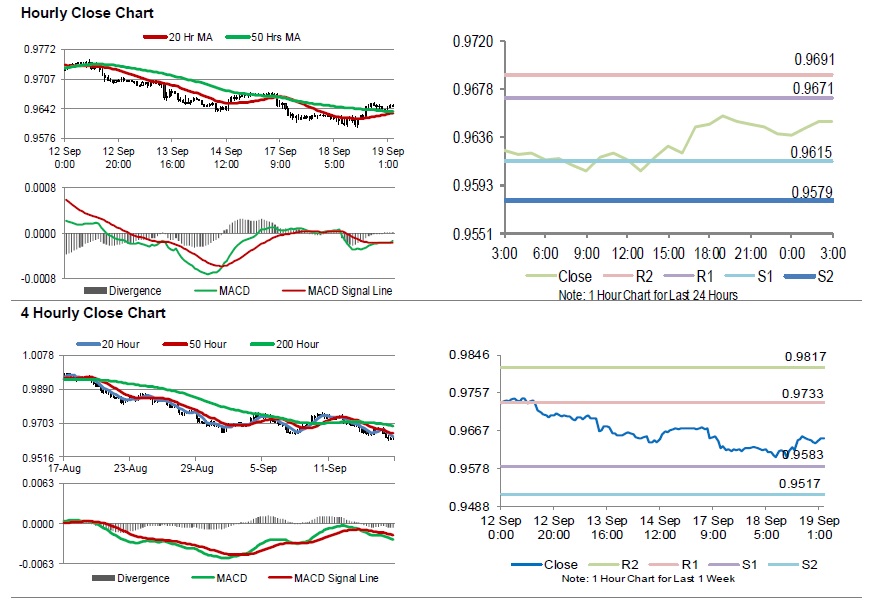
For the 24 hours to 23:00 GMT, the USD rose 0.15% against the CHF and closed at 0.9639.
In the Asian session, at GMT0300, the pair is trading at 0.9650, with the USD trading 0.11% higher against the CHF from yesterday’s close.
The pair is expected to find support at 0.9615, and a fall through could take it to the next support level of 0.9579. The pair is expected to find its first resistance at 0.9671, and a rise through could take it to the next resistance level of 0.9691.
Trading trend in the Swiss Franc today is expected to be determined by Switzerland’s SECO economic forecasts for September, set to release in a while.
The currency pair is trading above its 20 Hr and 50 Hr moving averages.
Canada’s Manufacturing Shipments Advanced More-Than-Estimated In July
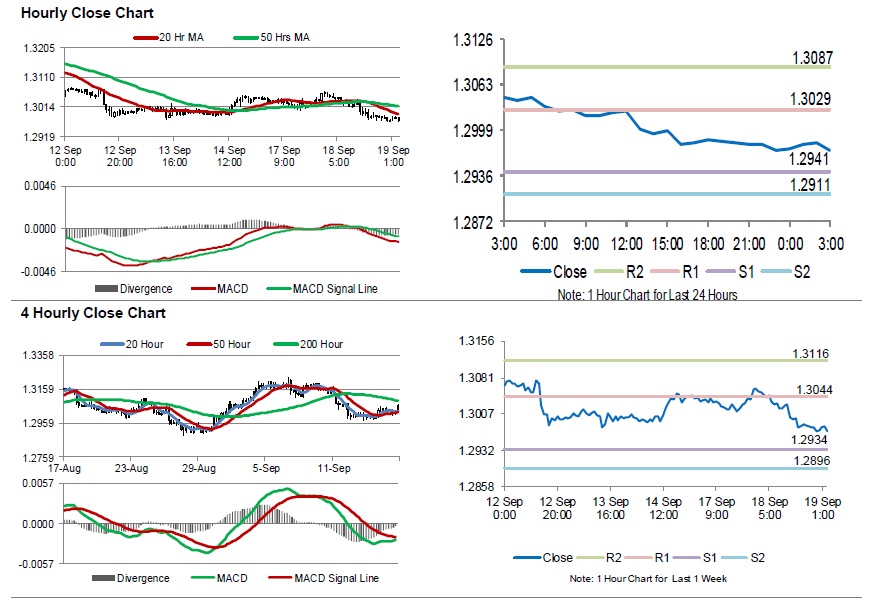
For the 24 hours to 23:00 GMT, the USD declined 0.65% against the CAD and closed at 1.2972.
On the data front, Canada's manufacturing shipments rose 0.9% on a monthly basis in July, higher than market expectations for an advance of 0.6%. In the previous month, manufacturing shipments had recorded a revised gain of 1.3%.
In the Asian session, at GMT0300, the pair is trading at 1.2971, with the USD trading slightly lower against the CAD from yesterday's close.
The pair is expected to find support at 1.2941, and a fall through could take it to the next support level of 1.2911. The pair is expected to find its first resistance at 1.3029, and a rise through could take it to the next resistance level of 1.3087.
In absence of key economic releases in Canada today, traders would keep an eye on global macroeconomic releases for further direction.
The currency pair is trading below its 20 Hr and 50 Hr moving averages.
Aussie Trading On Weaker Footing In The Asian Session
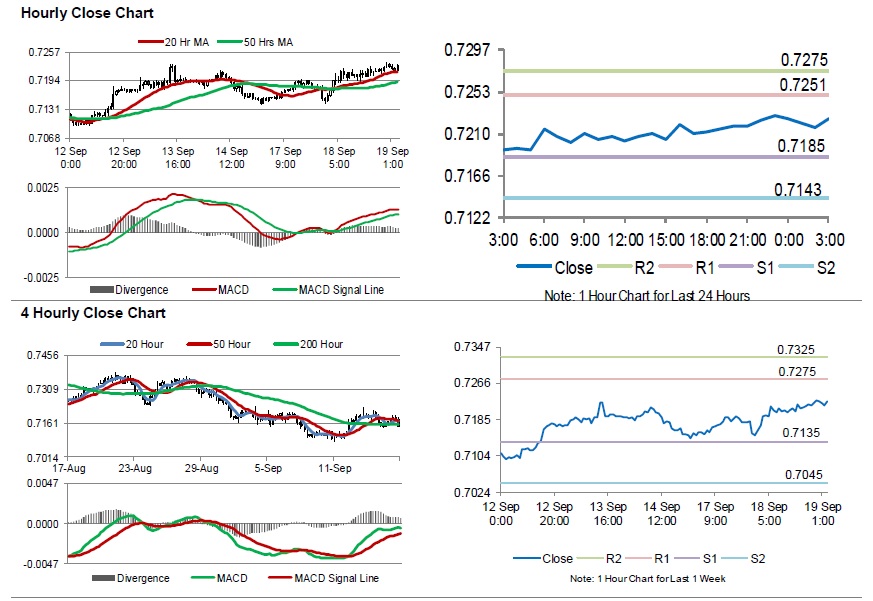
For the 24 hours to 23:00 GMT, the AUD rose 1.03% against the USD and closed at 0.7228.
LME Copper prices rose 2.4% or $143.0/MT to $6003.0/MT. Aluminium prices rose 1.4% or $27.0/MT to $2012.0/MT.
In the Asian session, at GMT0300, the pair is trading at 0.7226, with the AUD trading slightly lower against the USD from yesterday’s close.
Overnight data revealed that Australia’s Westpac leading index advanced 0.06% on a monthly basis in August, compared to a revised gain of 0.02% in the preceding month.
The pair is expected to find support at 0.7185, and a fall through could take it to the next support level of 0.7143. The pair is expected to find its first resistance at 0.7251, and a rise through could take it to the next resistance level of 0.7275.
Amid lack of economic releases in Australia today, traders would focus on global macroeconomic events for further direction.
The currency pair is showing convergence with its 20 Hr moving average and trading above its 50 Hr moving average.
Gold: Yellow Metal Reverses Its Losses In The Morning Session
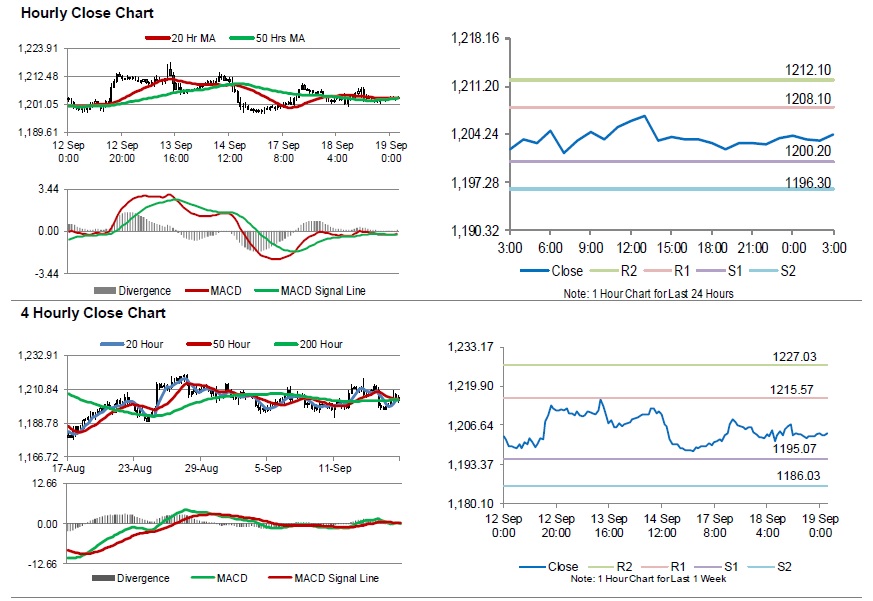
For the 24 hours to 23:00 GMT, Gold declined 0.13% against the USD and closed at USD1202.80 per ounce.
In the Asian session, at GMT0300, the pair is trading at 1204.10, with gold trading 0.11% higher against the USD from yesterday’s close.
The pair is expected to find support at 1200.20, and a fall through could take it to the next support level of 1196.30. The pair is expected to find its first resistance at 1208.10, and a rise through could take it to the next resistance level of 1212.10.
The yellow metal is showing convergence with its 20 Hr and 50 Hr moving averages.
Silver: White Metal Trading On A Negative Footing This Morning
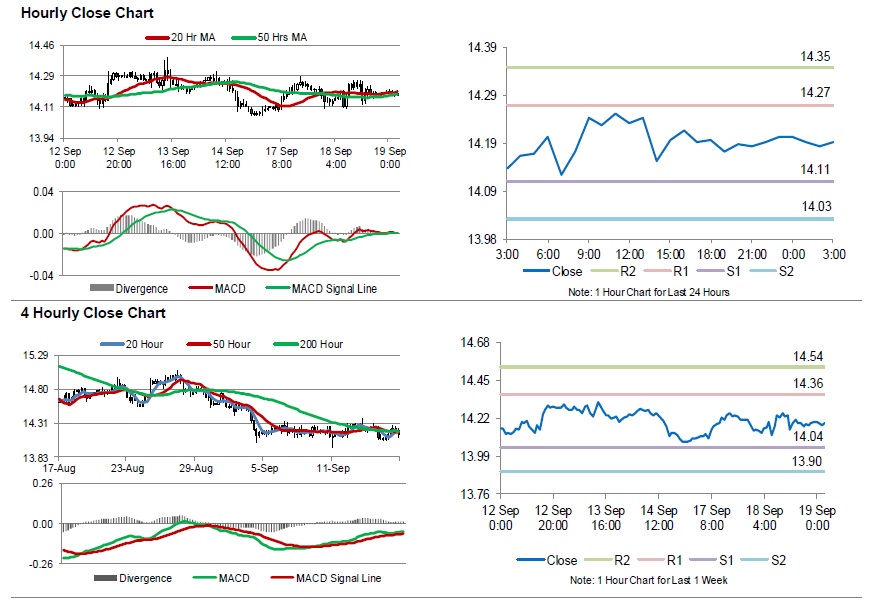
For the 24 hours to 23:00 GMT, Silver rose 0.14% against the USD and closed at USD14.20 per ounce.
In the Asian session, at GMT0300, the pair is trading at 14.19, with silver trading 0.07% lower against the USD from yesterday’s close.
The pair is expected to find support at 14.11, and a fall through could take it to the next support level of 14.03. The pair is expected to find its first resistance at 14.27, and a rise through could take it to the next resistance level of 14.35.
The white metal is showing convergence with its 20 Hr and 50 Hr moving averages.
Crude Oil: Extends Its Gains In The Asian Session
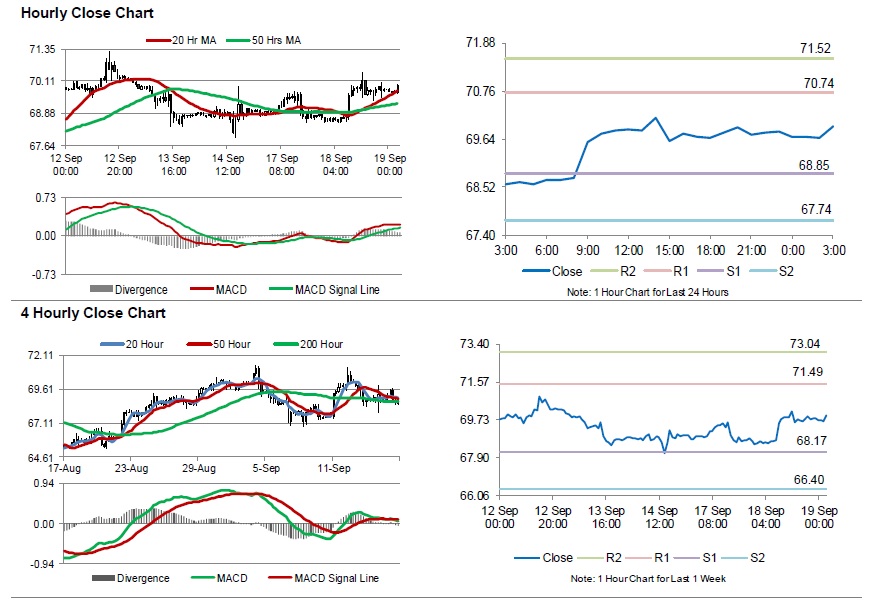
For the 24 hours to 23:00 GMT, Crude Oil rose 1.60% against the USD and closed at USD69.81 per barrel amid rising risk over decline in global supplies.
Separately, the American Petroleum Institute (API) reported that US crude oil inventories rose 1.3 million barrels to 399.5 million barrels in the week ended 14 September.
In the Asian session, at GMT0300, the pair is trading at 69.95, with oil trading 0.20% higher against the USD from yesterday’s close.
The pair is expected to find support at 68.85, and a fall through could take it to the next support level of 67.74. The pair is expected to find its first resistance at 70.74, and a rise through could take it to the next resistance level of 71.52.
Crude oil is showing convergence with its 20 Hr moving average and trading above its 50 Hr moving average.
USD/CAD Daily Outlook
Daily Pivots: (S1) 1.2946; (P) 1.3006; (R1) 1.3039; More...
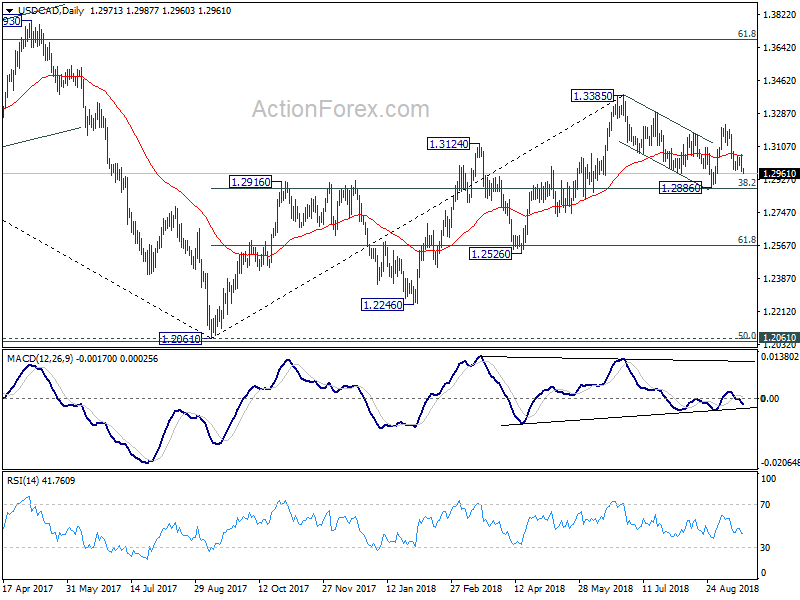
USD/CAD's pull back from 1.3225 resumed by breaking 2.1975. Intraday bias is back on the downside. For now, we're holding on to the view that corrective fall from 1.3385 has completed at 1.2886 already. Hence, downside should be contained above 1.2886 to bring rebound. on the upside, break of 1.3063 minor resistance will turn bias back to the upside for 1.3225 first.
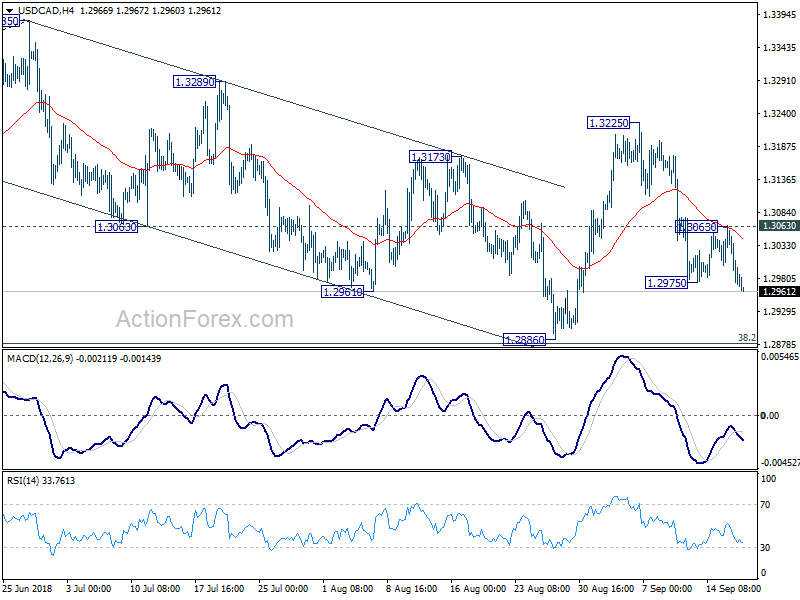
In the bigger picture, strong rebound ahead of 38.2% retracement of 1.2061 to 1.3385 at 1.2879 key fibonacci level retains medium term bullishness. That is, rise from 2017 low at 1.2061 is still in progress. Break of 1.3384 should target 61.8% retracement of 1.4689 (2015 high) to 1.2061 (2017 low) at 1.3685. On the downside, as long as 1.2886 support holds, outlook will now remain bullish.
AUD/USD Daily Outlook
Daily Pivots: (S1) 0.7167; (P) 0.7195; (R1) 0.7248; More...
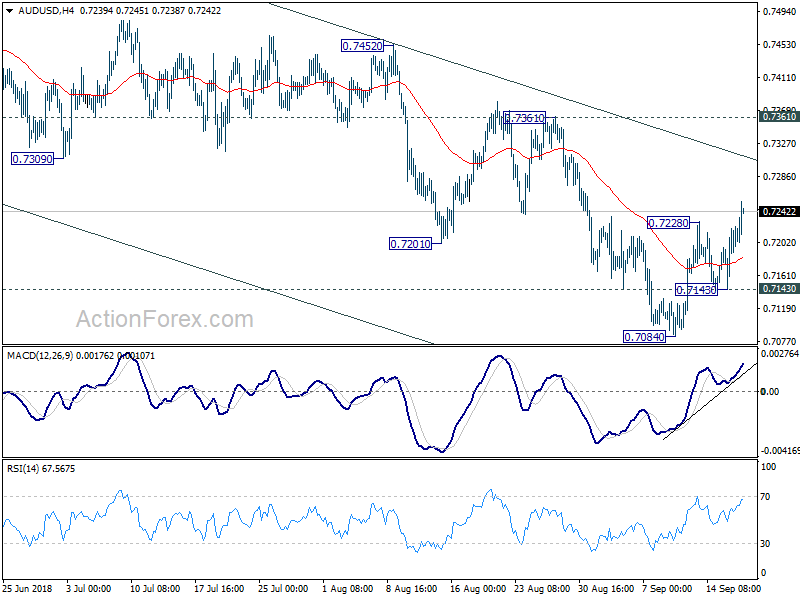
AUD/USD's rebound from 0.7084 resumed by taking out 0.7228. Intraday bias is back on the upside for 55 day EMA (now at 0.7303). But still, such rebound is seen as a correction. Therefore upside should be limited well below 0.7361 resistance to bring down trend resumption. On the downside, break of 0.7143 minor support will bring retest of 0.7084 low first. Break ill resume whole decline from 0.8135. However, sustained break of 0.7361 will carry larger bullish implication.
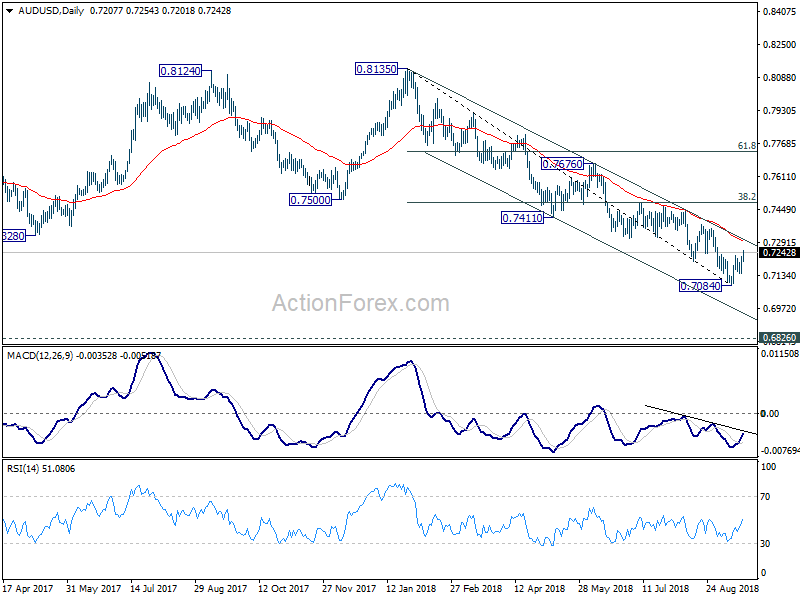
In the bigger picture, rebound from 0.6826 (2016 low) is seen as a corrective move that should be completed at 0.8135. Fall from there would extend to have a test on 0.6826. There is prospect of resuming long term down trend from 1.1079 (2011 high). Current downside momentum as seen in daily and weekly MACD support this bearish case. Firm break of 0.6826 will target 0.6008 key support next (2008 low). On the upside, break of 0.7361 resistance, however, argues that a medium term bottom is possibly in place, and stronger rebound could follow. We'll assess the medium term outlook later if this happens.
EUR/USD Daily Outlook
Daily Pivots: (S1) 1.1638; (P) 1.1681; (R1) 1.1711; More.....
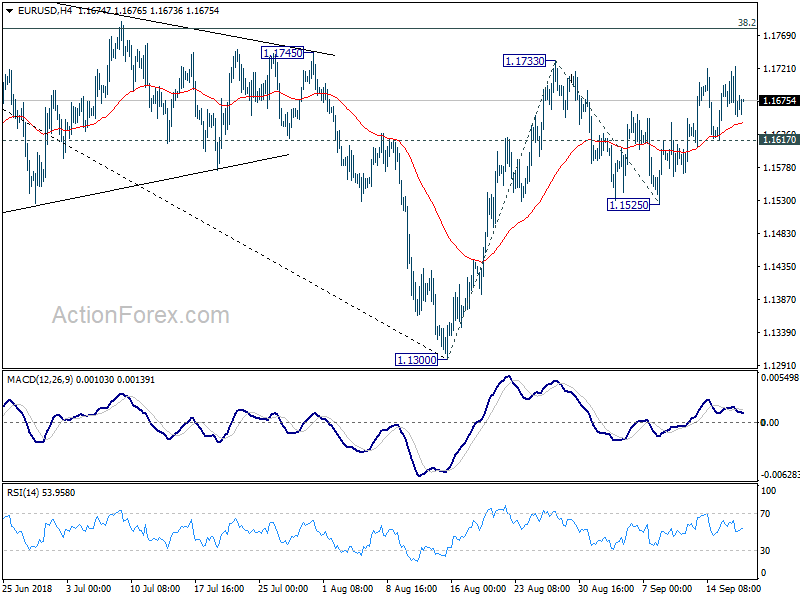
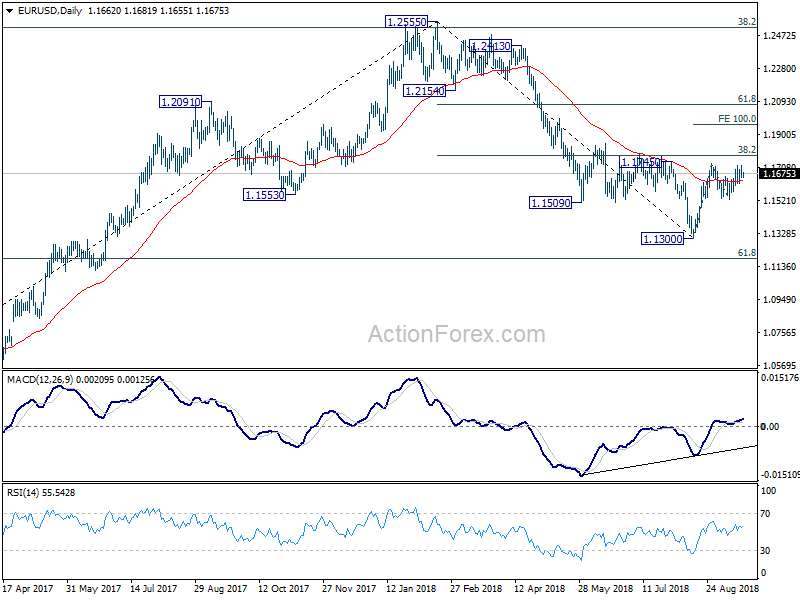
EUR/USD is still stuck in range below 1.1733 at this point and outlook is unchanged. Further rise cannot be ruled out yet. But we'd still expect strong resistance from 38.2% retracement of 1.2555 to 1.1300 at 1.1779 to limit upside, at least on first attempt. Break of 1.1617 minor support will turn bias back to the downside. Further break of 1.1525 support will indicate completion of this corrective rebound from 1.1300. However, firm break of 1.1779 will extend the rise to 100% projection of 1.1300 to 1.1733 from 1.1525 at 1.1958.
In the bigger picture, a medium term bottom should be in place at 1.1300, on bullish convergence condition in daily MACD and some consolidations would be seen. But still, note that EUR/USD was rejected by 38.2% retracement of 1.6039 (2008 high) to 1.0339 (2017 low) at 1.2516. That carries some long term bearish implications. Thus, we'd expect fall from 1.2555 high to resume after consolidation completes. Below 1.1300 should send EUR/USD through 61.8% retracement of 1.0339 to 1.2555 at 1.1186. And, in that case, EUR/USD would head to retest 1.0339 (2017 low).
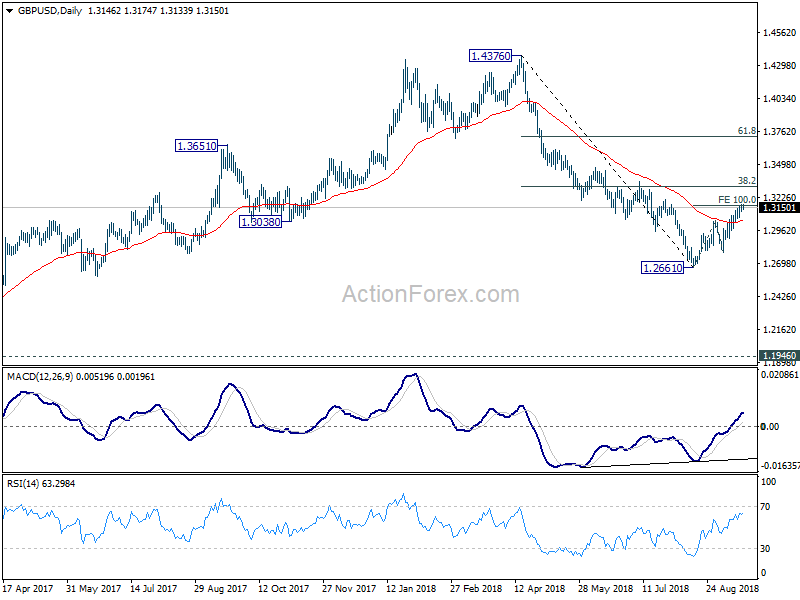
GBP/USD Daily Outlook
Daily Pivots: (S1) 1.3120; (P) 1.3146; (R1) 1.3173; More...
Despite loss of upside momentum as seen in 4 hour MACD, further rise could still be seen in GBP/USD. But we'd expect strong resistance from 1.3316 key fibonacci level to bring near term reversal. On the downside, break of 1.3042 resistance turn support will argue that rebound from 1.2661 might be completed. In such case, intraday bias will be turned back to the downside for 1.2784 support to confirm.
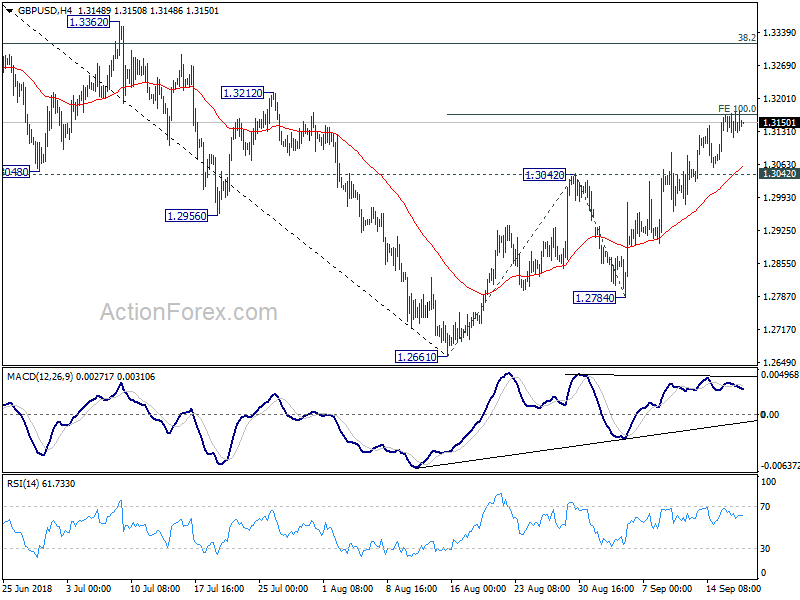
In the bigger picture, whole medium term rebound from 1.1946 (2016 low) should have completed at 1.4376 already, after rejection from 55 month EMA (now at 1.4062). The structure and momentum of the fall from 1.4376 argues that it's resuming long term down trend. And this will be the preferred case as long as 38.2% retracement of 1.4376 to 1.2661 at 1.3316 holds. However, firm break of 1.3316 would bring stronger rebound to 61.8% retracement at 1.3721. And, the eventual depth of the fall from 1.4376, and the chance of hitting 1.1946 low, will depend on the strength of the interim corrective rebound from 1.2661.