Sample Category Title
UK PM May urged EU to evolve its position on Brexit agreement
UK Prime Minister Theresa May wrote in Die Welt newspaper that the agreement on an orderly Brexit is close be concluded. She said, "we are near to achieving the orderly withdrawal that is the essential basis for building a close future partnership."
However, May also urged that "To come to a successful conclusion, just as the UK has evolved its position, the EU will need to do the same. Neither side can demand the unacceptable of the other, such as an external customs border between different parts of the United Kingdom."
EU chief Brexit negotiator Michel Barnier also said yesterday that they "ready to improve" the Irish border backstop proposal. He added that "we are clarifying which goods arriving in Northern Ireland from the rest of the U.K. would need to be checked, where, when and by whom these checks would be performed."
Eco Data 9/19/18
[php_everywhere instance="1"]
UK CPI and Retail Sales to Lose Steam in August
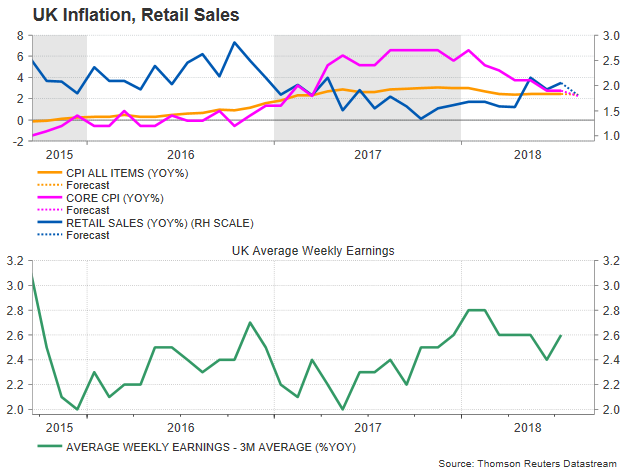
After an upbeat report on wage growth last Tuesday, consumer prices and retail sales out of the UK are the next in line to drive the British pound this week. Surprisingly, average earnings picked up speed in July, outstripping inflation for the fifth consecutive month, a sign that purchasing power could widen in the coming months. Retail sales for the month of August, however, are expected to show that household spending softened instead, even under projections that inflation in the same month has slowed down too.
On Wednesday at 0830 GMT, the Office for National Statistics in the UK is expected to report that the headline CPI rate continued to rise above the Bank of England’s price target of 2.0% in August, though compared to July’s mark of 2.5%, price growth is projected to cool to 2.4% in yearly terms. The core equivalent which excludes food and energy has also lost steam according to forecasts, inching down to 1.8%, from 1.9% in July. Producer prices accompanying the CPI release, another proxy for inflation, are expected to show a similar pattern, with the costs of goods and raw materials purchased by manufacturers easing by 0.8 percentage points to 9.1% y/y, while the costs of products sold by manufacturers is seen at 2.9%, below July’s rate of 3.1%.
On the retail sales front, forecasts are more pessimistic as analysts doubt whether the strong recovery has continued in August. In July, the heatwave in the UK and the World Cup event, fueled consumption, with retail sales surging unexpectedly by 3.5% year-on-year, faster than in June when the gauge marked a growth of 2.9%. In August, though, the weather returned to traditional temperatures and analysts believe that that the gauge declined by 0.2% month-on-month after rising by 0.7% in July, pushing the yearly measure down by 1.2 percentage points to 2.3%. Core retail sales which exclude fuel are also said to decline by 0.2% m/m, registering a slower yearly expansion of 2.5% compared to 3.7% seen before. Recall that readings from the British Retail Consortium, which are a decent gauge of the UK retail performance, identified a weaker trend in retail sales in August as well. Retail sales stats will be available on Thursday at 0830 GMT.
But even if the above data surprise to the upside, backing further monetary tightening in the future, the Bank of England appears to have no intention to elevate interest rates before Britain leaves the European Union on March 29 2019, despite signs of stronger wage and economic growth. The scenario of a no-deal Brexit became more realistic in policymakers’ minds in the past few months, with the BoE chief Mark Carney warning UK ministers behind closed doors last week about the potential negative implications under a disorderly exit from the bloc. Also, sources stated that Carney provided clues on the central bank’s strategy in case the EU and the UK fail to reach an agreement.
Still, hopes for a Brexit solution remain alive, especially after the EU Brexit negotiation, Michel Barnier stated last month that the EU is open to discuss other backstops on the Northern Ireland Border, a key issue in the Brexit talks. Optimism heightened even further this week after reports stated that Barnier is working on plans to limit physical checks at the border, a sign that a deal could be achieved ahead of November’s implicit deadline. Yet, with the UK Cabinet being divided on the Chequer withdrawal plan, the UK Prime Minister will find it hard to get the green light from Parliament even if the EU leaders compromise. Note that on Thursday, May will meet her European counterparts in Salzburg, Austria. Although this is will be an informal gathering, it could still be a stepping stone for October’s regular EU summit.
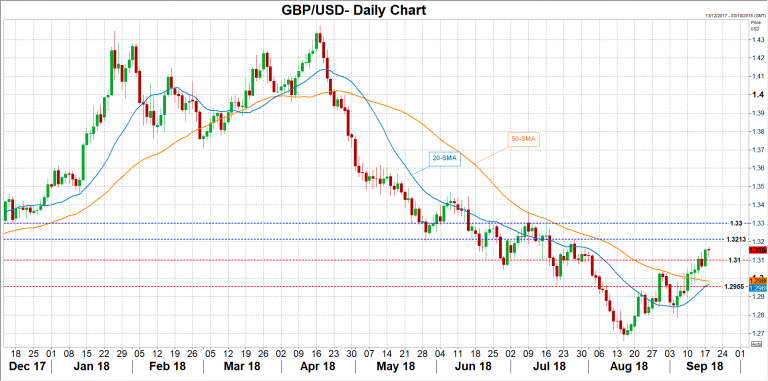
Turning to FX markets, the pound continued to lose against the US dollar in August for the fifth consecutive month, unlocking 1-year lows at 1.2660. In September, though, cable managed to rebound on the back of Brexit optimism, set to fully recover last month’s losses. While a data beat this week might not change the BoE’s “gradual and limited” rate rhetoric, it could positively affect investors outlook on the UK economy and thus push the pound even higher. In this case, traders could look for resistance around 1.3213, the peak on July 26 before eyes turn to the 1.3300 round level. A bigger challenge, however, is expected to come at July’s high of 1.3362 as any decisive close above that point would confirm the start of an uptrend.
Alternatively, if the actual numbers fell short of expectations, then immediate support could be found at 1.3100. Below that mark, bears could retest August peak of 1.3043, while steeper declines could also meet a wall around 1.2955 which acted as a support in July.
Rising and Falling Wedge Patterns
When talking about reversal patterns in Forex trading, few are more familiar or widely-known than rising and falling wedges. But why so? Well, wedge patterns tend to offer some of the most precision entries as well as some of the most attractive R-multiples in terms of measured-move target areas.
So, let’s define what a wedge pattern is.
What makes a Wedge, a Wedge?
One of the first things to know about rising and falling wedge patterns, is that they’re a great indicator of an upcoming reversal. Much the same as other wedge patterns, they’re formed by a consolidation period representing either distribution or accumulation.
While both rising and falling wedges can form over a period of any length, typically the longer the consolidation period, the more explosive the breakout will be when it eventuates.
The below image illustrates the traits of a rising wedge pattern.
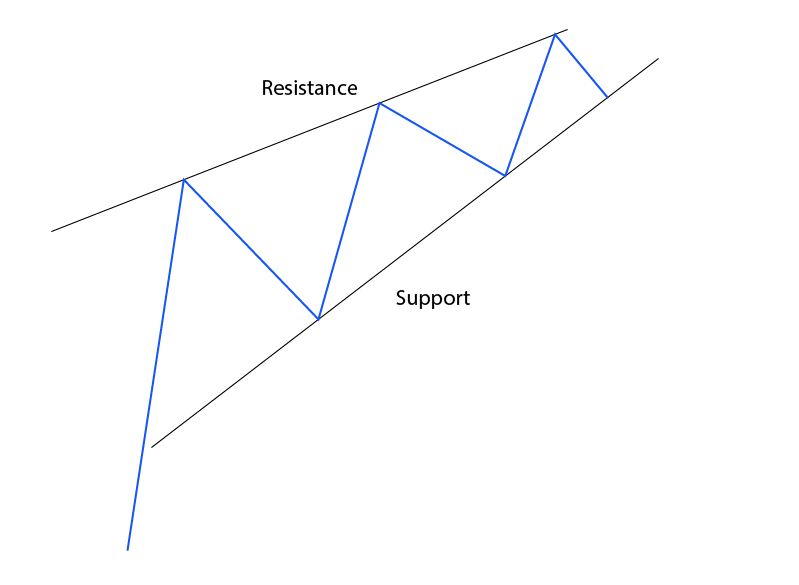
You’ll notice that a rising wedge takes shape when the Forex market is making higher highs and higher lows. You’ll also notice that all these lows and highs are connected by a trendline which is key for wedge patterns. If price doesn’t respect either the upper or lower trendline then the pattern is not a valid setup.
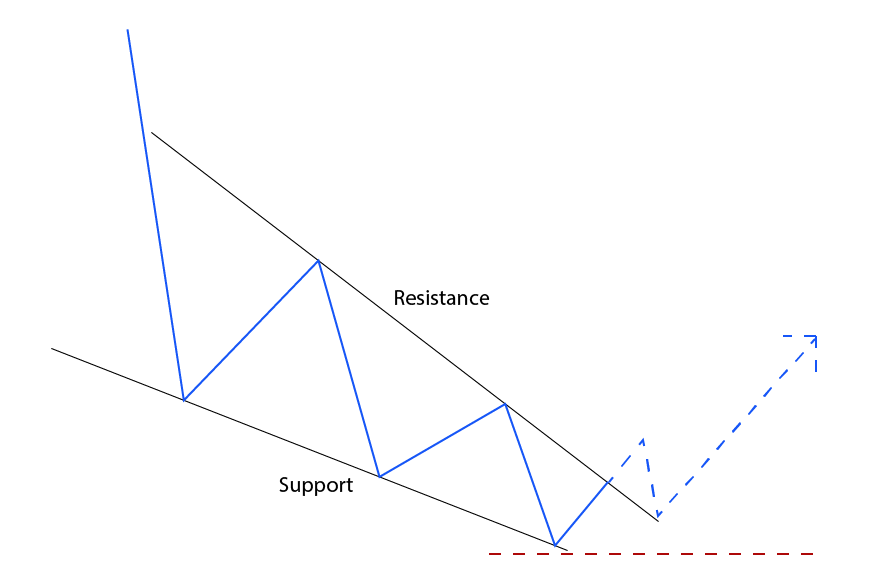
The falling wedge setup is the exact inverse of the rising wedge with price likely to break to the upside.
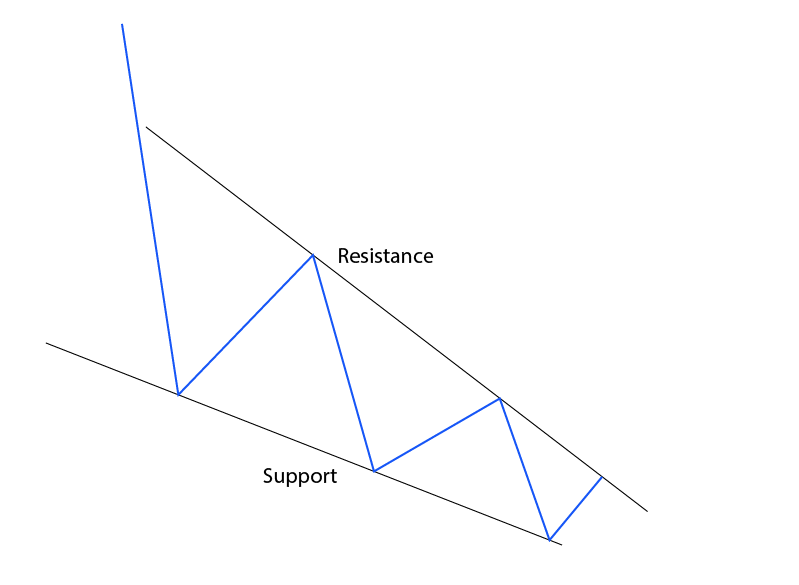
With both rising and falling wedge patterns, it’s vital that both the support and resistance lines of the wedge have at least three touches from price. Without this, the patterns cannot be considered tradable.
So, How do you Trade a Wedge?
In short, to trade a wedge pattern we wait for the market to break through our support or resistance lines, with price typically breaking to the opposite direction as the wedge itself.
When it comes to timeframes, you all know I’m an advocate of trading four hourly charts and higher, and this is no different. Though it is helpful to have a look at various timeframes to see which ones a respecting the trendlines best.
Let’s check out how to trade the rising wedge.
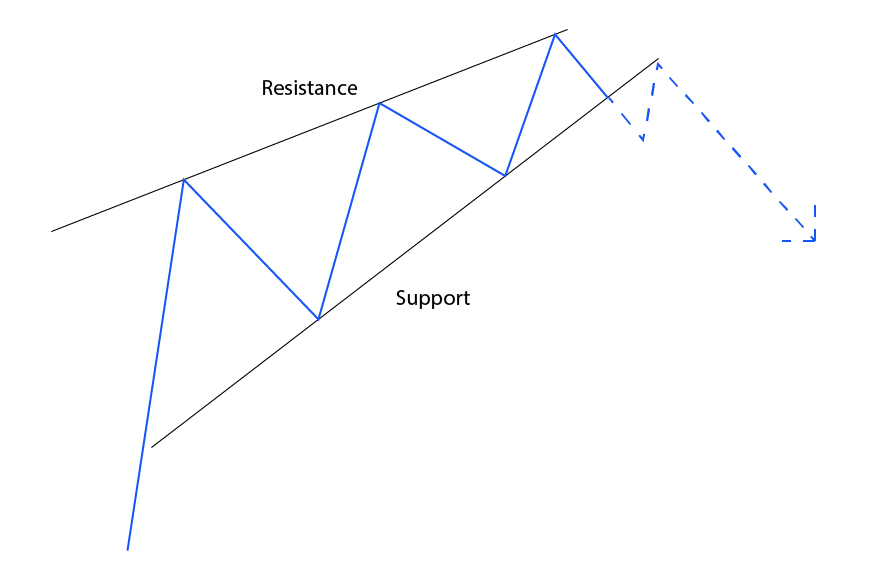
One of the first things you’ll notice is that price retraces to test the breakout line. Only when price retests the wedge support (former) will our short entry be triggered.
Why wait for the retest?
As I’ve discussed in previous articles about breakout trading, such as Breakouts vs Retests, it’s simply because it offers a more favourable R-multiple.
The same goes for the falling wedge.
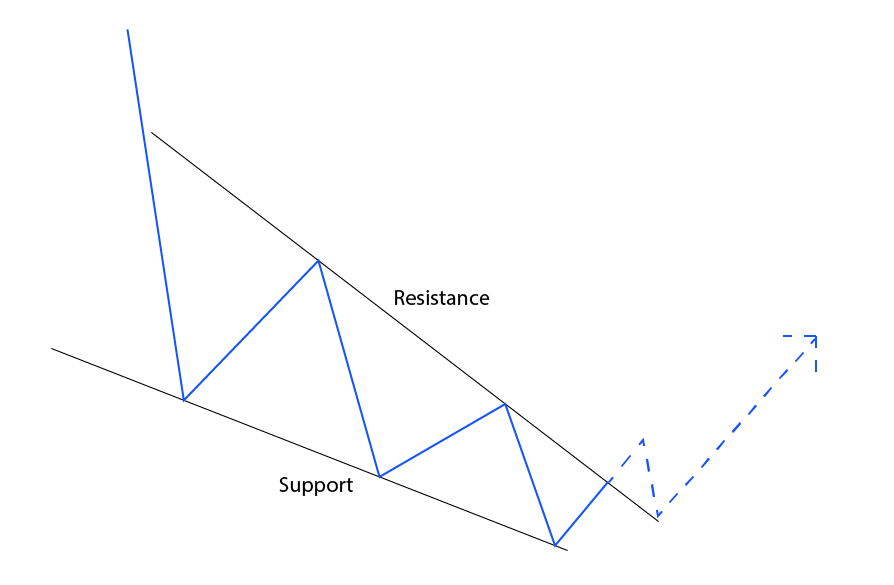
Once again, we always wait for the breakout to be confirmed, and then the retest.
How About Stop Losses?
As I always harp on about, you should have a very distinct idea of where your stop loss will be placed when you trade any position, and wedges are no exception.
One of the most common areas to place your stop loss when trading wedge patterns is just above or below the retracement immediately prior to the breakout. This is the point at which the market has proven your setup invalid.
The below image illustrates a common area where traders tend to place their stops.
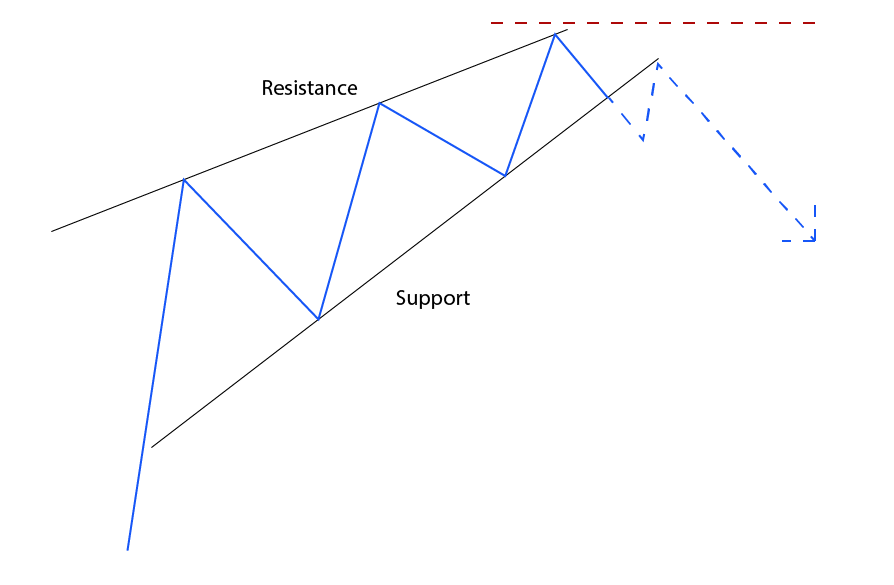
Notice how stop losses are placed above the most recent high. If price hits the stop loss in this trade, the market has made a new high which invalidates our pattern and of course means that we no longer want to hold a position in this trade.
Not surprisingly, the falling wedge is the same.
What Profit Areas Should we Target?
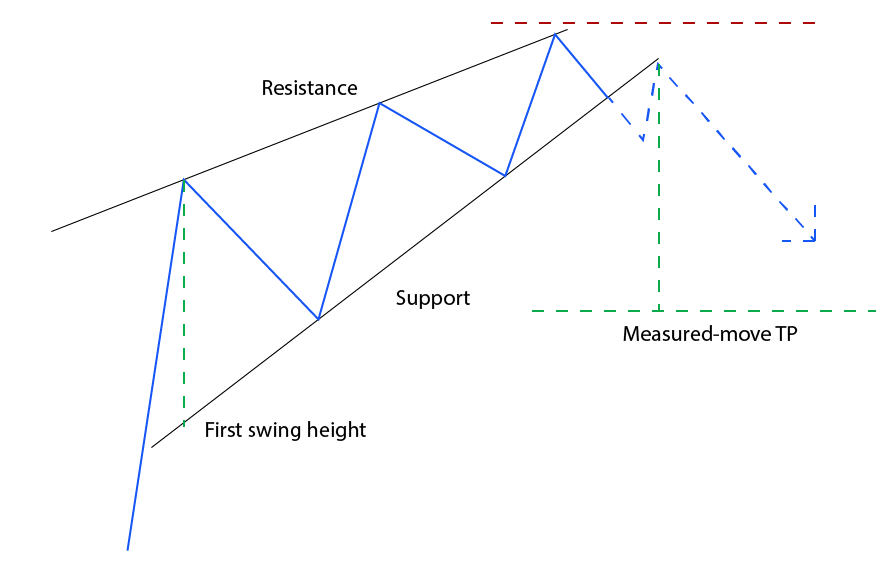
There are a couple of ways to set your profit areas when trading a wedge breakout. The first is by using a measured-move target. Simply put, this means taking the height of the first swing and using that as your target.
We’ll using a rising wedge as our example to illustrate the measured-move method.
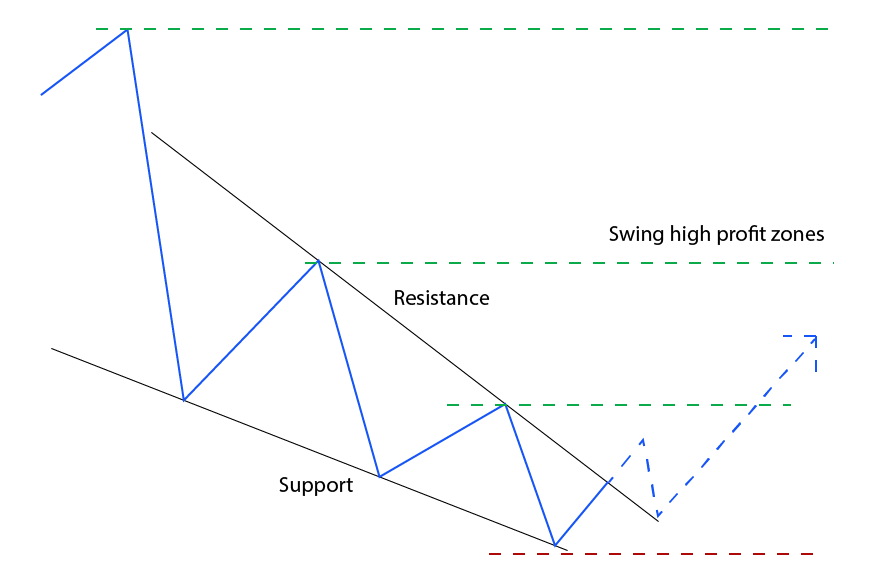
Alternatively, traders could use the previous swing lows/highs as areas of support or resistance when determining profit target areas as per our falling wedge illustration below.
Wrapping up Wedges
As I’ve shown, rising and falling wedge patterns can present very lucrative trading opportunities.
As discussed there are a couple of caveats that qualify a valid wedge setup. There must be three touches on either side of the pattern, and the pattern is only confirmed once price has broken out of the wedge formation.
Wedges offer an important addition to any trader’s arsenal and hopefully this article has demonstrated the value of both rising and falling wedge patterns.
Mid-US update: Yen selloff extends as US treasury yields surge
Yen's selloff extends in US session as risk appetite dominate the US markets while treasury yields also surge. Sterling follows as the second weakest. On the other hand, Australian Dollar continues to lead New Zealand and Canadian Dollar higher. The news of US tariffs and China's retaliation are generally shrugged off by investors.
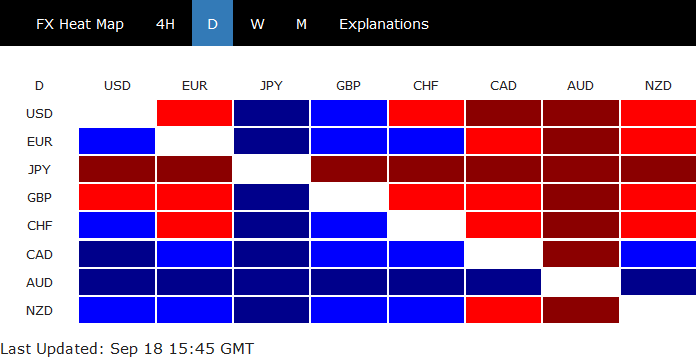
At the time of writing, DOW is trading up 0.52%, S&P 500 up 0.60% and NASDAQ up 1.02%. In Europe, German DAX gained 0.40%, CAC up 0.21% but FTSE closed slightly down by -0.08%. Despite Dollar's sluggishness, Gold continues to trade in tight range and struggles to hold above 1200 handle.
We'd attribute the selloff in Yen to strength in US treasury yields. In particular, rally is stronger in the long end. At the time of writing, 30-year yield is up 0.040, 10-year yield is up 0.032 and 5-year yield is up 0.022. This is certainly a development Fed officials would love to see.
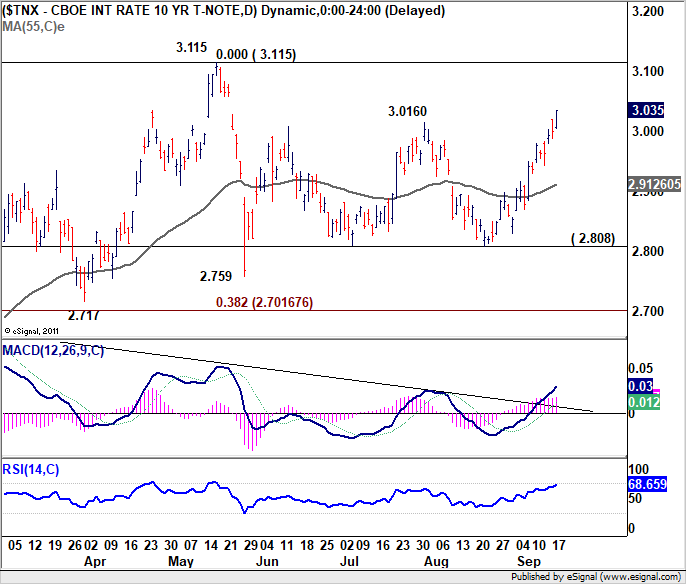
10-year yield (TNX) took out 3.016 resistance this week and momentum persists. Now, further rise is likely towards 3.115 key resistance. We're not too convinced that this key level could be taken out. So, we'd start to look for topping signal as TNX approaches 3.115. Accompanying it, we would likely see USD/JPY having a take on 113.17 resistance.
UK PM May: European Parliament Weber welcomes Chequers proposals
A spokesman of UK Prime Minister Theresa May said that Manfred Weber, Leader of the European People's Party in the European Parliament, welcomed May's Brexit plan.
He said, "on Brexit, Weber recognized that the Chequers proposals were a step forward and stressed the priority the European Parliament placed on resolving questions relating to the border between Ireland and Northern Ireland, as well as on maintaining the integrity of the Single Market."
And, "they also discussed the Future Framework and agreed that both the UK Parliament and European Parliament should be able to vote on a precise plan for the UK-EU relationship."
EU releases proposals on WTO reforms, defend multilateral trade system
European Commission released their comprehensive approach for the modernisation of the World Trade Organisation today.
In presenting the ideas, Commissioner for Trade Cecilia Malmström said: "The multilateral trading system has for the past decades provided a stable, predictable and effective framework for companies across the world, helping many economies to grow rapidly. Also today, the WTO is indispensable in ensuring open, fair and rules-based trade. But despite its success, the World Trade Organisation has not been able to adapt sufficiently to the rapidly changing global economy. The world has changed, the WTO has not. It's high time to act to make the system able to address challenges of the today's global economy and work for everyone again. And the EU must take a lead role in that."
The ideas in the proposal are related to three key ares:
- updating the rule book on international trade to capture today's global economy
- strengthening the monitoring role of the WTO
- overcoming the imminent deadlock on the WTO dispute settlement system.
EU also noted that the US and Japan are engaged in the framework of trilateral discussions. A dedicated workgroup was set up during the latest EU-China summit. And EU pledged to discuss the ideas with other WTO partners in the coming weeks.
Here is the press release. And a 17-page document detailing the proposals.
Earlier today, the European Union Chamber of Commerce in China released an annual position paper. The 33-page paper detailed 14 common concerns faced by European companies in China, and listed out a accumulative total of 828 recommendations.
This is how adults work!
BoJ Likely to Retain a Cautious Tone amid Muted Inflation and Trade Risks
The Bank of Japan (BoJ) will announce its policy decision during Wednesday’s Asian session, with investors anticipating no change to the Bank’s loose policy framework following some adjustments at the previous gathering. Instead, market focus may fall primarily on how officials perceive the escalation in global trade tensions, and to what extent these might affect Japan. A cautious-sounding tone in the policy statement may prove somewhat negative for the yen.
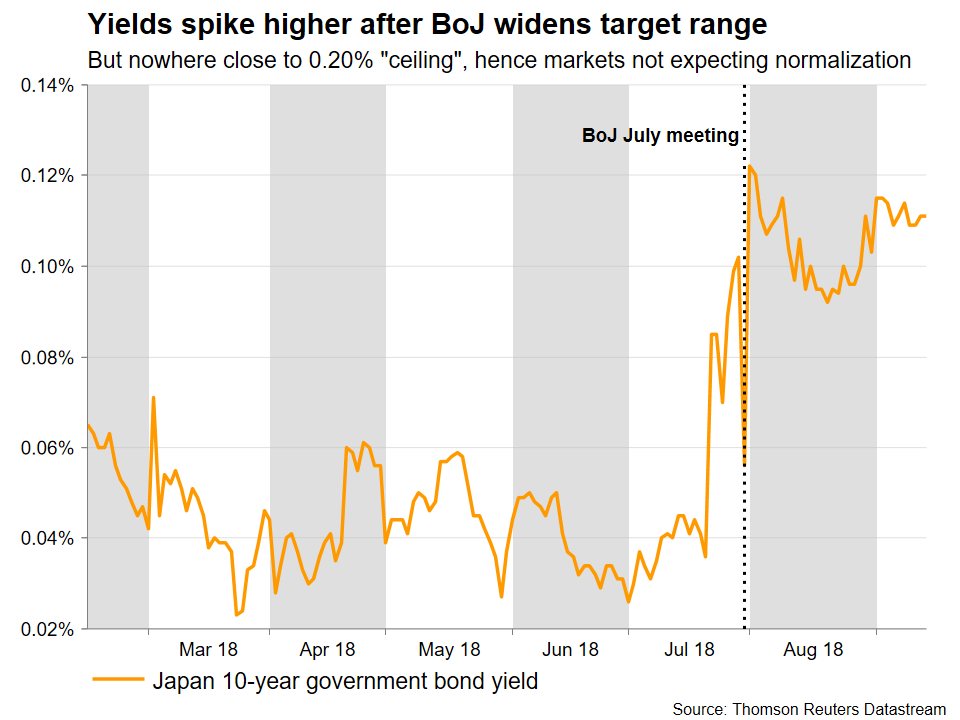
Stealth tapering, or making the “QQE with yield-curve control” framework more sustainable? This has been the debate that has raged in markets since the BoJ tweaked its policy at the latest meeting in July. To explain – under its current framework, the BoJ has pledged to keep the yields on longer-dated Japanese government bonds (JGB) fixed “around 0%” in an attempt to stimulate borrowing and investment in Japan. Prior to July’s gathering, every time that yields on 10-year JGBs attempted to cross above 0.10%, the BoJ intervened in the market, buying as many bonds as needed to push yields back down.
Then in July, policymakers announced they’ll allow yields to fluctuate in a wider range, twice as large as before, implicitly raising the “ceiling” for 10-year yields to 0.20%. While the Bank framed these changes as making its easing program more sustainable, some argue these effectively amount to “stealth tightening”, as the BoJ now needs to buy fewer bonds to maintain its yield target. However, a majority of investors seemingly don’t share this view. If this was indeed perceived as a step towards normalization, one would expect to see associated market reactions – namely, Japanese yields spiking higher and the yen strengthening on expectations for higher interest rates down the road. Neither has transpired, with the yen only attracting safe-haven bids and 10-year yields remaining far away from the 0.20% “ceiling”, suggesting markets still view any BoJ normalization as being a long way off.
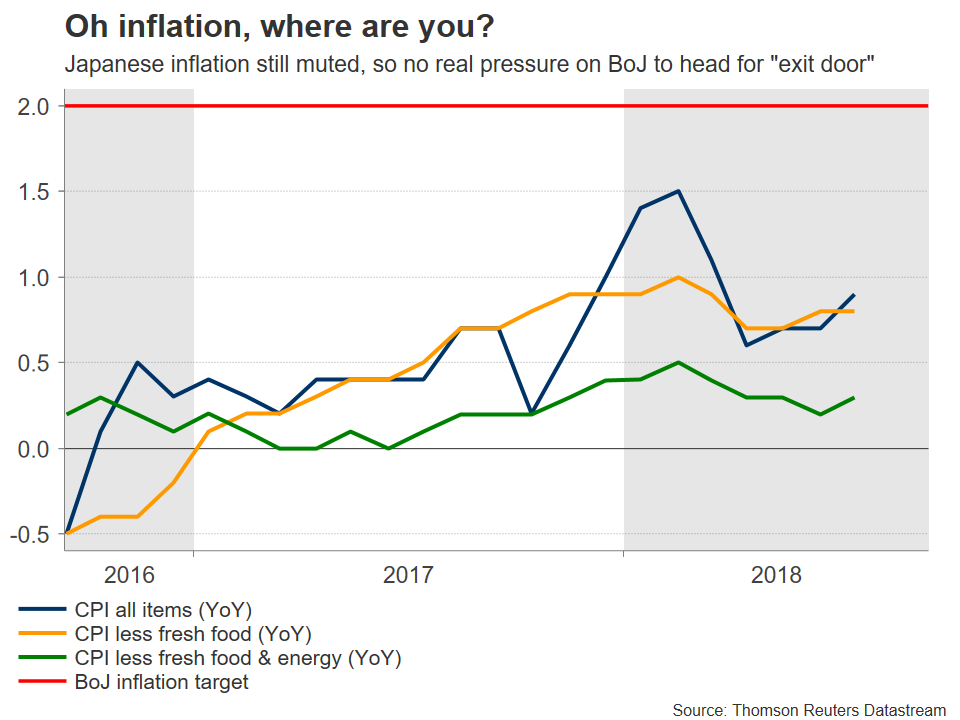
This is understandable judging by Japanese economic data, which continue to tread water. While some recent releases including GDP growth for Q2 surprised to the upside and the labor market remains robust, these have failed to manifest into stronger inflationary pressures. The annual headline and core CPI rates clocked in at 0.9% and 0.8% respectively in July, remaining far below the BoJ’s 2.0% target and exerting little pressure on officials to realistically consider normalization.
Hence, with recent developments not significant enough to warrant any change in policy or forward guidance, especially after the recent tweaks, markets are likely to focus mainly on the tone of the accompanying statement to gauge how the BoJ may proceed moving forward. In particular, investors may be interested to see how policymakers view the risks emanating from America’s trade row with China, whether such uncertainties are anticipated to impact Japan’s growth prospects, and if so to what extent. Added to this, recent media reports suggest that Japan may be the next target on Trump’s trade radar.
Overall, combining the still-tepid inflation outlook with trade risks casting a shadow over the export-driven economy, BoJ policymakers probably have more incentive to maintain a fairly cautious stance. Governor Kuroda could highlight the commitment to keep rates “very low”, implicitly confirming the current policy framework will remain in place for a prolonged period. On the margin, such a signal may prove negative for the yen. With the BoJ keeping Japanese yields fixed around 0% while other central banks like the Fed are raising rates, interest rate differentials between Japan and the rest of the world are gradually widening, rendering the yen less attractive relative to currencies like the dollar.
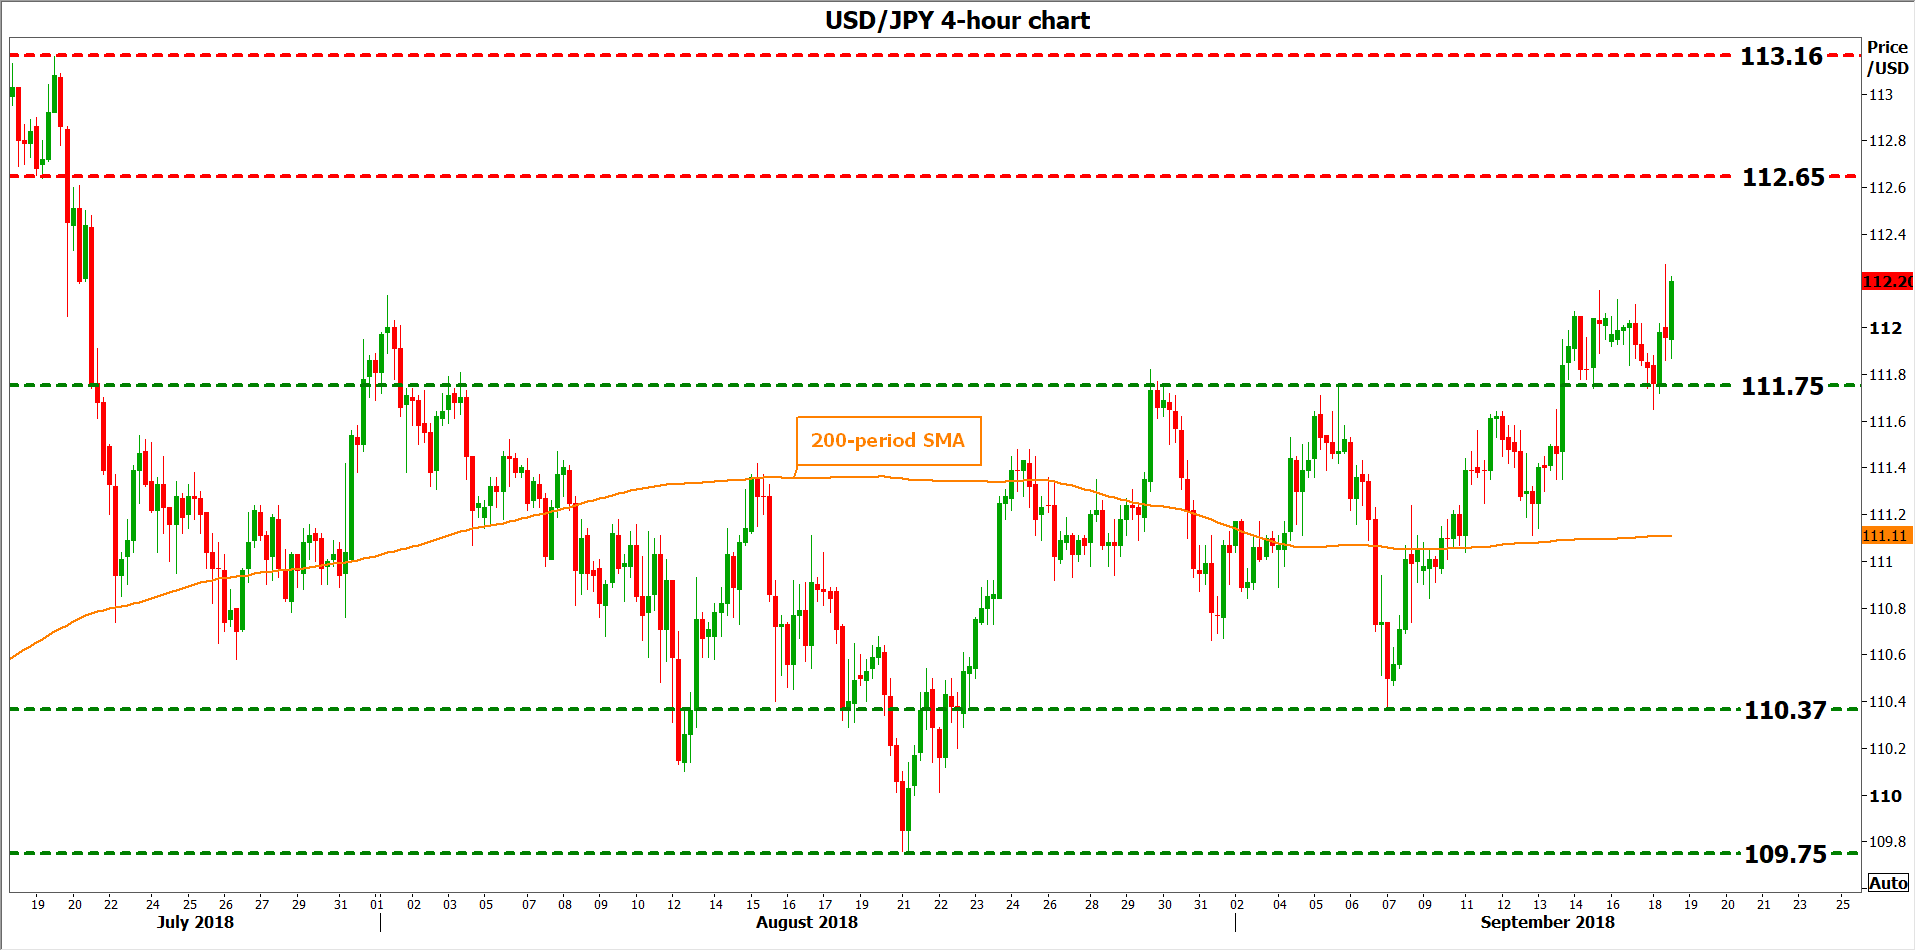
In case of a cautious-sounding bias, dollar/yen could edge higher and challenge the 112.65 zone, marked by the inside swing low on July 19. If the bulls manage to pierce above it, then further advances may encounter resistance near the nine-month high of 113.16. On the contrary, if the BoJ appears upbeat overall, downplaying trade risks, then the pair could decline. Immediate support may come around 111.75, a zone that capped two rallies recently. A downside break may see scope for a test of the 200-period moving average on the 4-hour chart, at 111.11, before the September 7 low of 110.37 comes into view.
Looking past the BoJ, Japanese politics could also be in the spotlight this week as on Thursday, Prime Minister Abe’s ruling LDP party will hold a leadership race. He is widely expected to retain his position, and if so, that may also prove (slightly) negative for the yen, considering that Abe is seen as a major proponent of loose monetary policy. Recall that “aggressive monetary policy” is one of the three arrows in Abenomics, the PM’s flagship strategy for fighting deflation.
Finally, on Friday the nation will see the release of updated inflation figures for August. While the yen doesn’t typically respond much to economic data, considering that these are crucial for the BoJ, they could attract some attention as a leading gauge of whether policy normalization is on the cards anytime soon, or not.
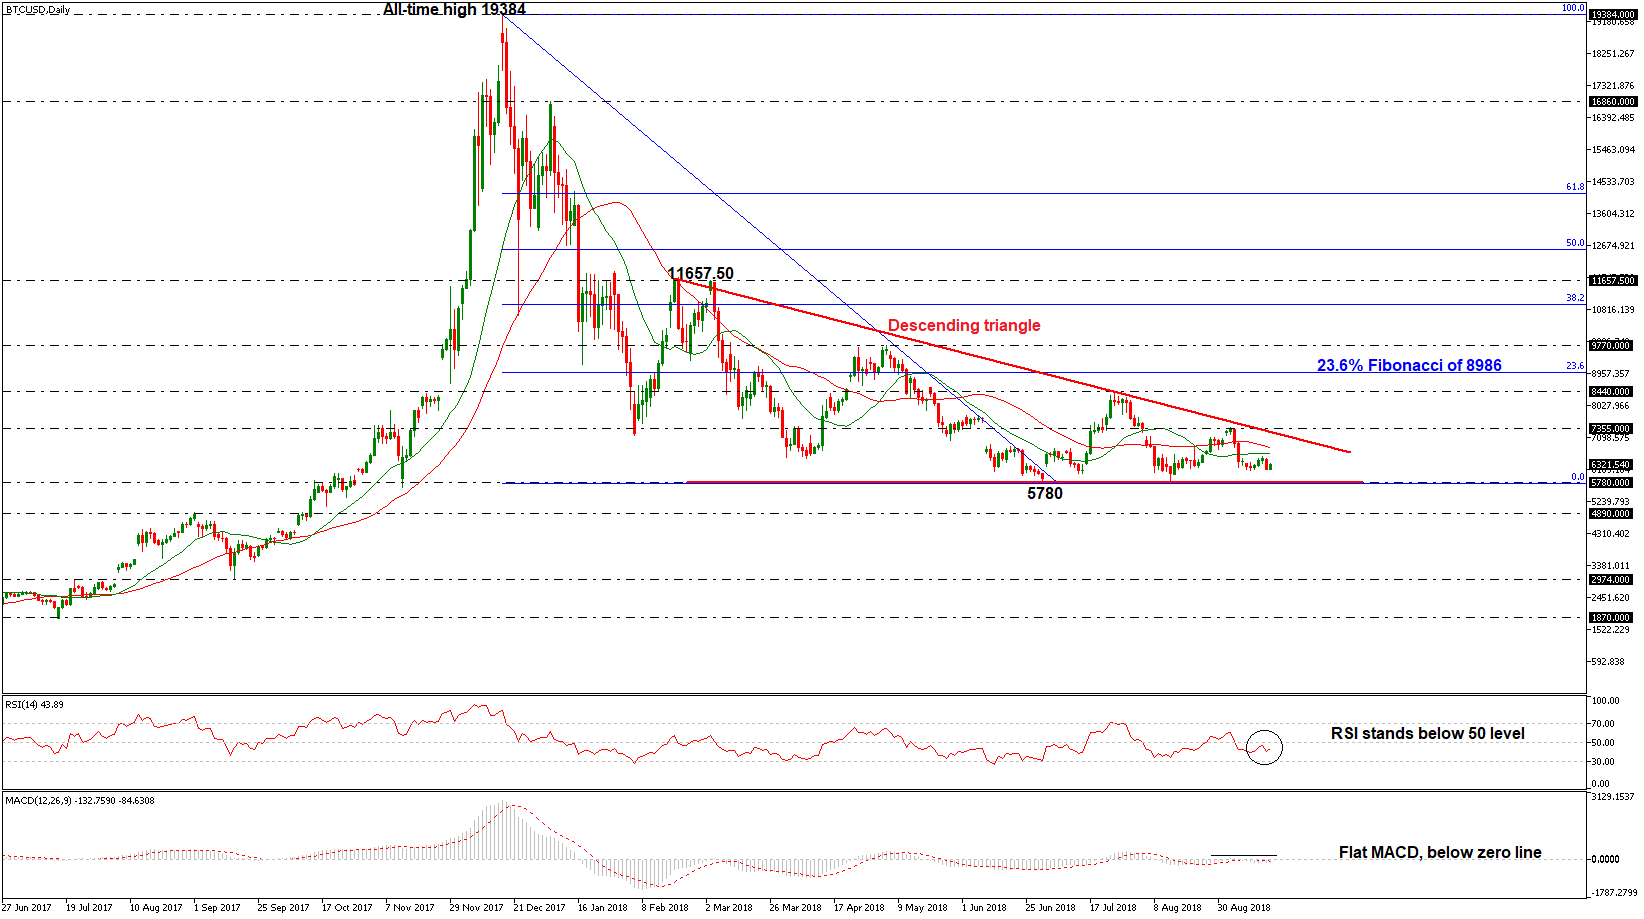
BTCUSD Holds in Descending Triangle in Medium-Term
BTCUSD has been trading within a descending triangle pattern over the last seven months, with a strong support obstacle being the 5780 barrier. Moreover, the price started an aggressive bearish structure after the pullback from the all-time high of 19384 reached in December 2017 That said, technical oscillators paint a somewhat neutral picture currently.
In the short-term, the RSI indicator is sloping slightly to the upside near the neutral threshold of 50, while the MACD oscillator is flattening around its trigger and zero lines, indicating that the pattern may stay in place for the next few sessions.
Should the pair stretch south and dip below the significant support of 5780, the next level for investors to have in mind is the 4890 hurdle, taken from the high of September 2017. A step lower could enhance bearish sentiment, sending the price probably towards 2974, identified by the low of September 2017.
On the flip side, the 20- and 40-simple moving averages (SMAs) are acting as resistances at 6634 and 6808 respectively at the time of writing. If the bulls take the reins, BTCUSD could rise until the 7355 resistance level, which overlaps with the descending trend line. Steeper increases could also touch the 8440 barrier, before being able to challenge the 23.6% Fibonacci retracement level of the downleg from 19384 to 5780, around 8986.
In the medium-term picture, the price remains in a bearish mode as it holds in a descending reversal pattern and below the moving averages. This pattern suggests that the next move could be to the downside rather than to the upside.
Yen Is Back to Two-Month Lows
The yen is weakening considerably against the dollar by mid September,
while the Japanese government is trying to calm the market down. The Minister of Finance Taro Aso said today the BoJ monetary policy is going to stay the same so as to reach the 2% inflation target, but this will require some time. The basic policy features are set by the central bank, Aso said, while any early talks on the QE shutdown may only provoke too much volatility.
This way, Aso smoothed down a bit what the Japanese Prime Minister Shinzo Abe said on Friday, highlighting the fact that the strategy of the QE shutdown is already being worked on. Such talks are not groundless, as the Bank of Japan spends a lot of money on QE in order to avoid deflation, and while it does its job, many politicians want a better effect, and that's why they criticize the BoJ.
In the middle of this week, the Japanese central bank is going to have another scheduled meeting on monetary policy, where some decisions are to be taken. The interest rate has been negative (0.10%) for a long time, and this is another stimulus measure. After the meeting tomorrow, the traditional press conference will be held, which is of a particular interest.
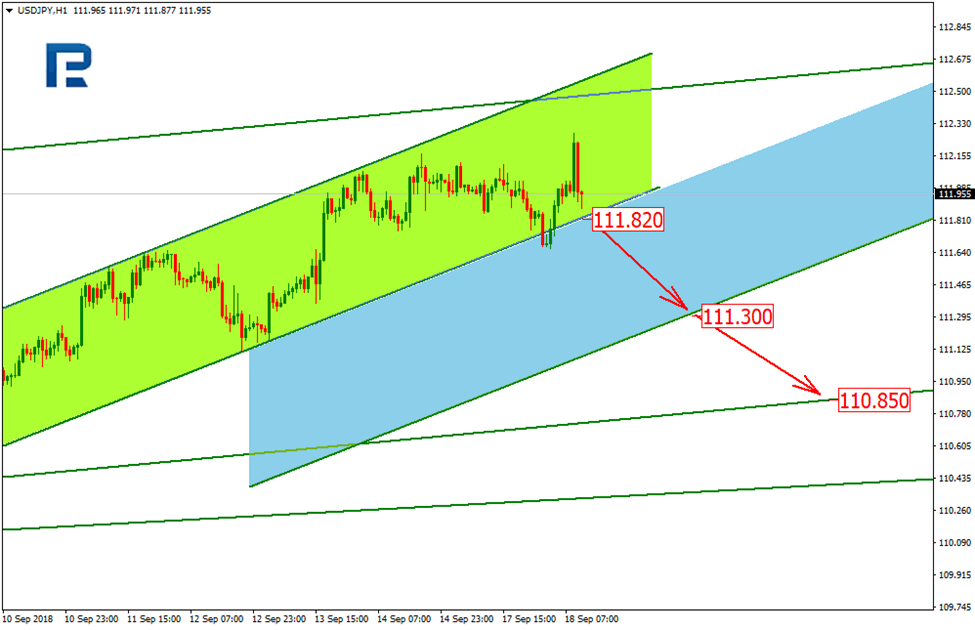
An uptrend is still dominating when it comes to USDJPY. After a bounce off the midterm channel support the price formed a new short term ascending trend. Meanwhile, on H1, the price is going down towards the support, which may be broken out soon. In case 111.82 gets broken out, another support, the one of the projection channel, may be hit, at 111.30, with the next downtrend target being the midterm support at 110.85.