Sample Category Title
New Tariffs Fuel US-Chinese Trade Tensions
Market movers today
The development in US-Chinese trade tension remains in focus after US President Trump announced another USD200bn worth of tariffs last night.
In Scandi, Swedish August LFS is due to be released. So far, Swedish labour market developments have been very impressive, albeit it is a lagging indicator.
The Bank of Japan meets today and is scheduled to announce its monetary policy on Wednesday morning European time. We expect the BoJ to keep its policy unchanged and for Governor Haruhiko Kuroda to reiterate a relatively dovish stance, signalling that the BoJ intends to keep interest rates at current levels for a longer period of time. We expect the BoJ to keep its current policy intact until the end of 2019 at least.
Selected market news
Last night, the Trump administration announced a new 10% tariff on USD200bn worth of Chinese products. A 10% tariff is less than previously feared, but at the same time, President Trump threatened to increase the tariff to 25% in 2019 unless a deal is reached to ease trade tensions. The total value of imported goods from China covered by Trump's tariffs is now USD250bn or roughly 50% of total US imports from China. China has promised to retaliate to any US measures against China one-to-one and with the new tariffs from the US side, it is difficult not to see the trade war escalate further - also in light of the US mid-term elections. In our view, a deal seems unlikely before well into 2019. The risk is that it drags on. At least, China seems to be preparing itself for a long-lasting trade war by (among other things) easing economic policy. See US-China Trade Update - China unlikely to give in to Trump's demands despite new tariffs , 17 September.
Global equity markets trade mixed this morning: Hong Kong and Chinese markets trade lower while Japanese indices are up more than 1.5% as Japanese investors return from holiday. The strong rally in Japanese markets probably reflects that a 10% tariff is less than initially feared.
The Riksbank Minutes released yesterday basically confirmed the signal to hike in either December or February. We read them as slightly hawkish, where the doves are now taking a more neutral stance. The question is how the Riksbank will assess the lower-than-expected inflation and GDP data. We stick to our base case with a hike in December though.
Minutes from the 4 September monetary policy meeting in the Reserve Bank of Australia confirmed that the next move in interest rates is likely to be a hike. However, while the RBA expects GDP growth likely to remain 'above potential', it also warned that 'significant tensions' around trade policy are a 'material risk' to the global outlook. We expect the RBA to hike the cash rate by 25bp within the next 12 months.
USD/JPY Bull Flag Chart Pattern Awaits Bullish Breakout
The USD/JPY is building a bull flag chart pattern (purple lines). The break of the flag could indicate a bullish push up towards the 78.6% Fibonacci retracement near 112.50.
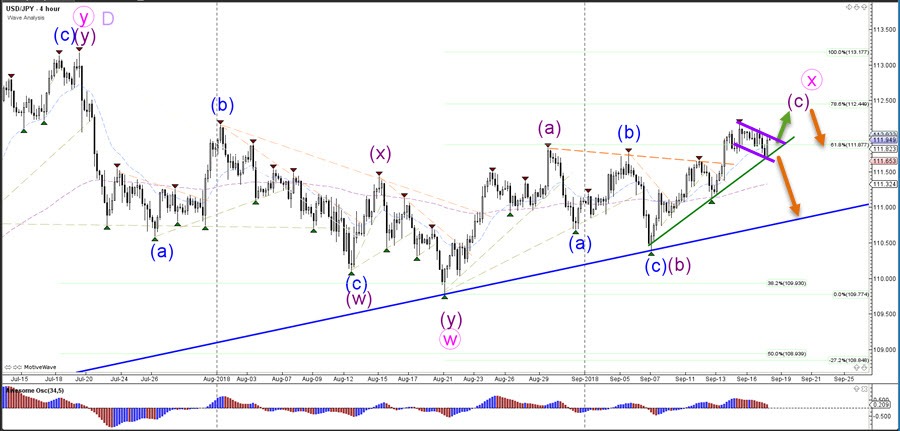
The USD/JPY will either bounce or break the 78.6%Fibonacci retracement levelof wave X (pink).A break makes the wave X less likely whereas a bounce would confirm it
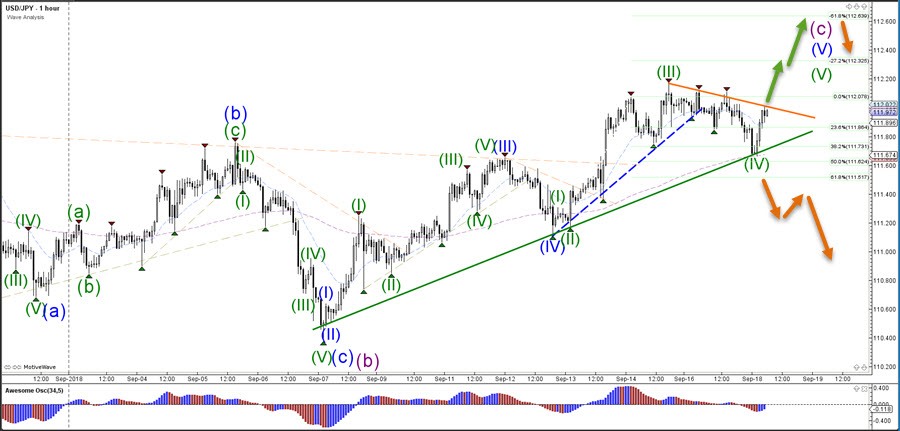
The USD/JPY needs to break above the resistance trend line (orange) before a continuation towards the Fibonacci target becomes more likely. The bull flag pattern remains intact as long as price stays above the support trend line (green) and Fibonacci retracement levels.
EUR/USD Testing 78.6% Fibonacci Resistance Zone At 1.17
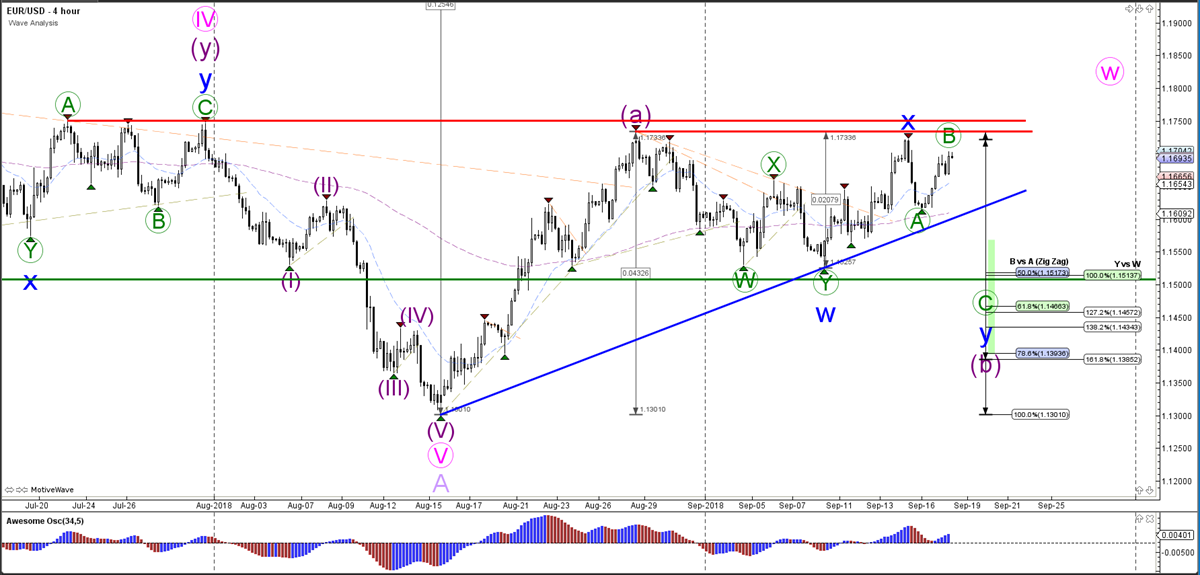
The EUR/USD is again testing the resistance zone (red lines), which is a key decision spot for a bullish breakout or a bearish bounce. A break above the top of wave X (blue) invalidates the currently expected bearish ABC zigzag pattern (green), whereas a break below the support trend line (blue) confirms it. A bullish break could aim for 1.18 and 1.20, whereas a bearish breakout aims for the Fibonacci levels on the chart.
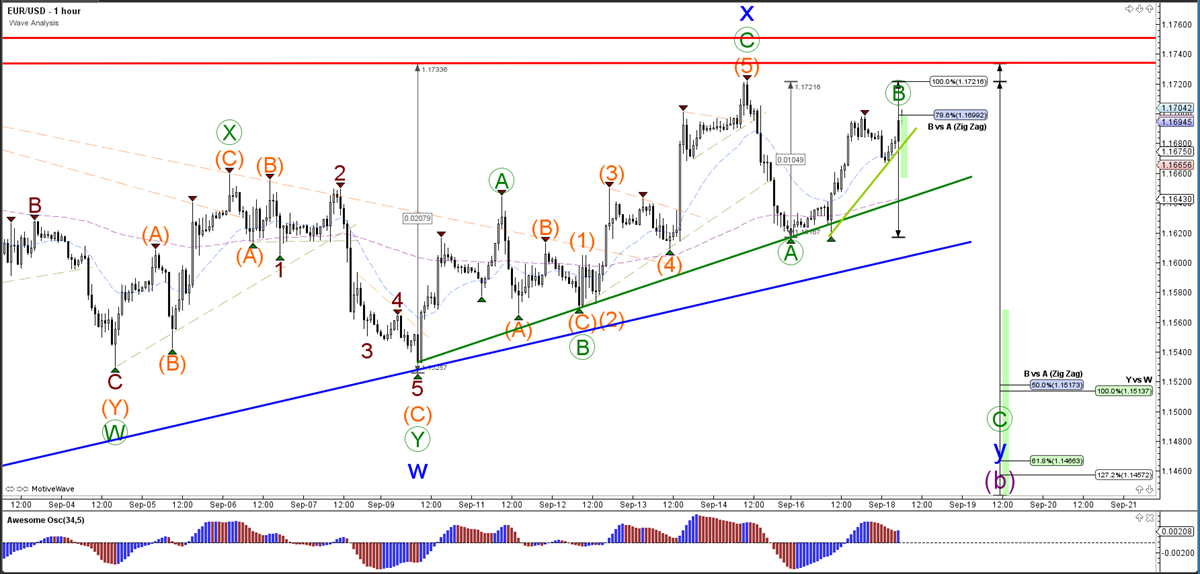
The EUR/USD could be developing a wave B (green) of a larger ABC zigzag in wave Y (blue). The price is now right at the 78.6% Fibonacci level, which is a bounce or break spot.
Euro-Zone’s Inflation Advanced As Estimated In August
For the 24 hours to 23:00 GMT, the EUR rose 0.40% against the USD and closed at 1.1673.
On the data front, the Euro-zone's final consumer price index (CPI) climbed 2.0% on a yearly basis in August, in line with market expectations and confirming the preliminary print. In the previous month, the CPI had recorded a rise of 2.1%.
The US dollar fell against its major peers yesterday, amid renewed US-China trade war fears and a rise in the US treasury yields. The US President, Donald Trump stimulated the US-China trade dispute by announcing plans to impose tariffs on an additional $200 billion worth of Chinese goods.
In the US, data revealed that the NY Empire State manufacturing index dropped to a level of 19.0 in September, overshooting market consensus for a fall to a level of 23.0. The index had registered a level of 25.6 in the preceding month.
In the Asian session, at GMT0300, the pair is trading at 1.1688, with the EUR trading 0.13% higher against the USD from yesterday's close.
The pair is expected to find support at 1.1638, and a fall through could take it to the next support level of 1.1588. The pair is expected to find its first resistance at 1.1718, and a rise through could take it to the next resistance level of 1.1748.
Amid lack of macroeconomic releases in the Euro-zone today, investors sentiment will be determined by the US NAHB housing market index for September, slated to release later in the day.
The currency pair is showing convergence with its 20 Hr moving average and trading above its 50 Hr moving average.

Sterling Trading Flat In The Asian Session
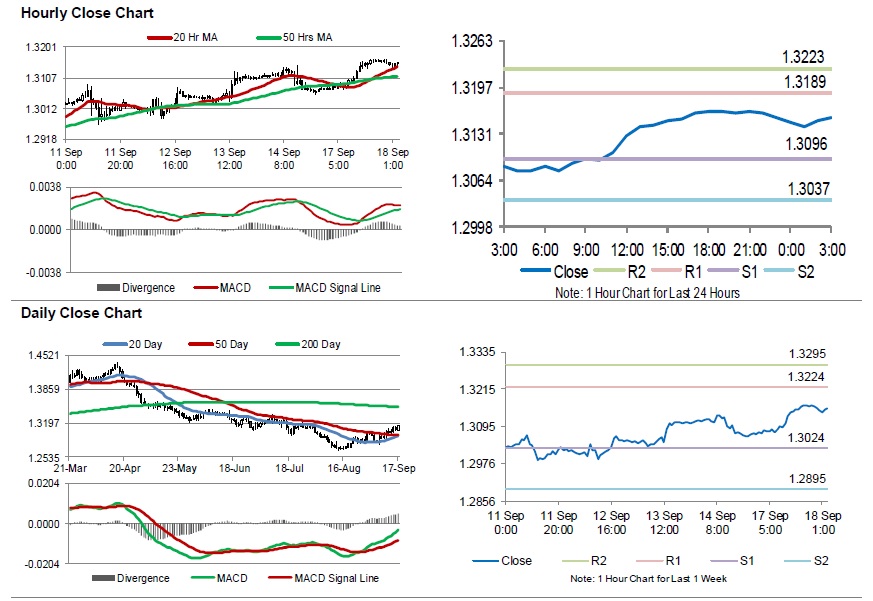
For the 24 hours to 23:00 GMT, the GBP rose 0.62% against the USD and closed at 1.3154.
In the Asian session, at GMT0300, the pair is trading at 1.3154, with the GBP trading flat against the USD from yesterday’s close.
The pair is expected to find support at 1.3096, and a fall through could take it to the next support level of 1.3037. The pair is expected to find its first resistance at 1.3189, and a rise through could take it to the next resistance level of 1.3223.
The currency pair is showing convergence with its 20 Hr moving average and trading above its 50 Hr moving average.
Japanese Yen Trading Lower, Ahead Of Crucial Economic Data
For the 24 hours to 23:00 GMT, the USD declined 0.28% against the JPY and closed at 111.69.
In the Asian session, at GMT0300, the pair is trading at 111.99, with the USD trading 0.27% higher against the JPY from yesterday’s close.
The pair is expected to find support at 111.74, and a fall through could take it to the next support level of 111.48. The pair is expected to find its first resistance at 112.18, and a rise through could take it to the next resistance level of 112.36.
Looking forward, investors would await the Bank of Japan’s (BoJ) interest rate decision along with Japan’s trade balance data for August, both set to release overnight.
The currency pair is showing convergence with its 20 Hr and 50 Hr moving averages.

Swiss Franc Ttrading A Tad Higher In The Asian Session
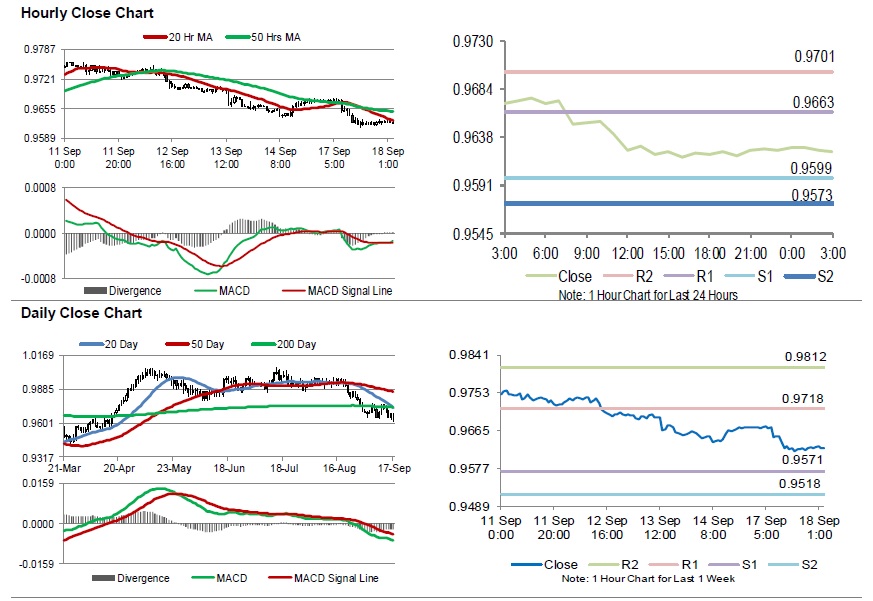
For the 24 hours to 23:00 GMT, the USD declined 0.50% against the CHF and closed at 0.9625.
In economic news, Switzerland’s total sight deposits advanced to a level of CHF577.1 billion in the week ended 14 September, from CHF576.5 billion in the previous week.
In the Asian session, at GMT0300, the pair is trading at 0.9624, with the USD trading slightly lower against the CHF from yesterday’s close.
The pair is expected to find support at 0.9599, and a fall through could take it to the next support level of 0.9573. The pair is expected to find its first resistance at 0.9663, and a rise through could take it to the next resistance level of 0.9701.
The currency pair is showing convergence with its 20 Hr moving average and trading below its 50 Hr moving average.
Canada’s Existing Home Sales Climbed For The Fourth Consecutive Month In August
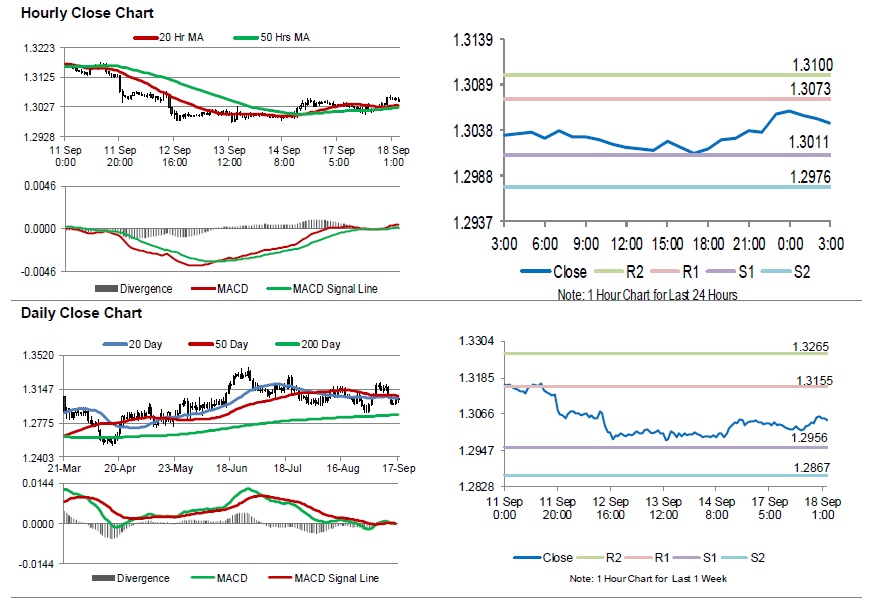
For the 24 hours to 23:00 GMT, the USD rose 0.13% against the CAD and closed at 1.3057.
Macroeconomic data indicated that Canada's existing home sales advanced 0.9% on a monthly basis in August, rising for the fourth consecutive month and compared to a gain of 1.9% in the prior month.
In the Asian session, at GMT0300, the pair is trading at 1.3046, with the USD trading 0.08% lower against the CAD from yesterday's close.
The pair is expected to find support at 1.3011, and a fall through could take it to the next support level of 1.2976. The pair is expected to find its first resistance at 1.3073, and a rise through could take it to the next resistance level of 1.3100.
Going ahead, traders would closely monitor Canada's manufacturing sales for July, scheduled to release later in the day.
The currency pair is trading above its 20 Hr and 50 Hr moving averages
Trade Dispute Posed ‘Material Risk’ To The Economy: RBA Meeting Minutes
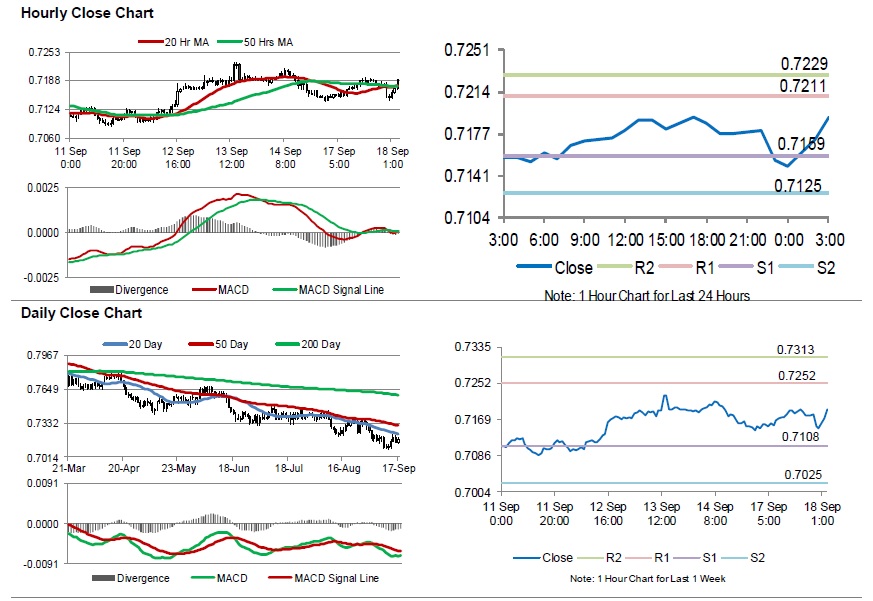
For the 24 hours to 23:00 GMT, the AUD rose 0.07% against the USD and closed at 0.7154.
LME Copper prices declined 1.5% or $86.5/MT to $5860.0/MT. Aluminium prices declined 1.5% or $30.5/MT to $1985.0/MT.
In the Asian session, at GMT0300, the pair is trading at 0.7192, with the AUD trading 0.53% higher against the USD from yesterday's close, following the release of Australia's house price data and RBA meeting minutes.
The minutes of the Reserve Bank of Australia's (RBA) September monetary policy meeting showed that the policymakers sounded optimistic on strong labour market and resilient domestic consumption. However, the officials expressed concerns over the impact of escalating US-China trade tensions and cautioned that it could pose a 'material risk' to the economy. Further, the members maintained their cautiously optimistic forecasts and stated that the next interest rate move was likely to be up.
On the data front, Australia's house price index eased 0.6% on an annual basis in 2Q 2018, less than market expectations for a decline of 0.7% and compared to an advance of 2.0% in the previous quarter.
The pair is expected to find support at 0.7159, and a fall through could take it to the next support level of 0.7125. The pair is expected to find its first resistance at 0.7211, and a rise through could take it to the next resistance level of 0.7229.
Trading trend in the Aussie is expected to be determined by Australia's Westpac leading index for August, set to release overnight.
The currency pair is showing convergence with its 20 Hr and 50 Hr moving averages.
Gold: Yellow Metal Reverses Its Gains In The Morning Session
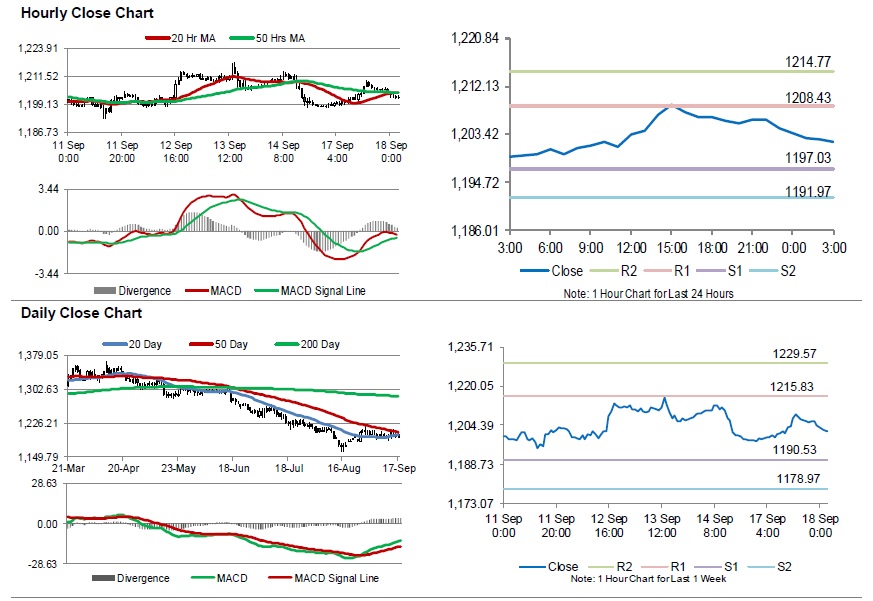
For the 24 hours to 23:00 GMT, Gold rose 0.61% against the USD and closed at USD1206.10 per ounce, amid weakness in the US dollar.
In the Asian session, at GMT0300, the pair is trading at 1202.10, with gold trading 0.33% lower against the USD from yesterday’s close.
The pair is expected to find support at 1197.03, and a fall through could take it to the next support level of 1191.97. The pair is expected to find its first resistance at 1208.43, and a rise through could take it to the next resistance level of 1214.77.
The yellow metal is trading below its 20 Hr and 50 Hr moving averages.