Sample Category Title
Mid-US update: Dollar weak as Trump delivers nothing on tariffs yet, but a hollow tweet
Dollar and Yen remain the weakest one for today at the time of writing. Markets are anticipating some sort of announcement from the US on tariffs on Chinese goods. But, other than a hollow tweet from Trump, nothing happened so far. European majors are the strongest one, led by Sterling, while New Zealand slipped in the second place. A lot of headlines flow through regarding Brexit but they're generally positive ones. After all, the picture could change a lot if the tariff announcement finally comes.
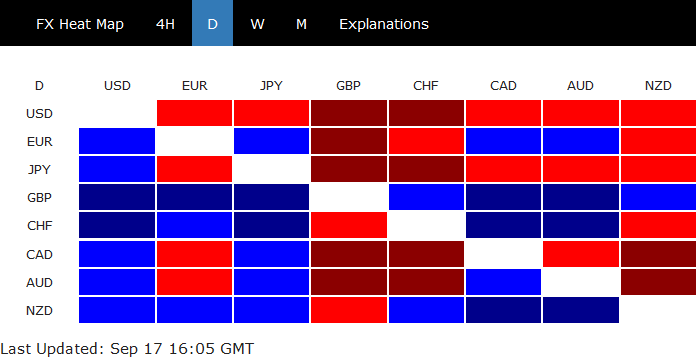
Technically, USD/CHF, GBP/USD and GBP/JPY have already resumed recent move. That is, USD/CHF is extending the fall from 1.0067. GBP/USD and GBP/JPY are extending recent rise from 1.2661 and 139.88 respectively. Euro is left behind with EUR/USD and EUR/JPY stuck in range.
In other markets, US indices are trading mildly softer. NASDAQ is down -0.79% at the time of writing. But S&P 500 is down -0.27% and DOW is down -0.09% only. European indices closed slightly lower with FTSE down -0.03%, CAC down -0.07%. DAX was the biggest loser but it closed down merely -0.23%. Gold is back above 1200 but is kept well below 1214.30 near term resistance. Nonetheless, as it rebounds off 1187.58 support, near term outlook is kept bullish.
China Unlikely to Give In to Trump’s Demands Despite New Tariffs
- Trump is expected to implement the second round of tariffs on an additional USD200bn of imported goods from China either later today or tomorrow.
- Trump's purpose seems to be to put China under pressure, forcing them to give in to his demands. That is unlikely to happen in our view, as the Chinese government does not want to negotiate with a gun to its head.
- Difficult not to see the trade war in the light of the US mid-term elections and a deal seems unlikely before well into 2019. The risk is that it drags on.
- While the trade war is negative for growth, it is not going to derail the global expansion, in our view. The risk is that we have underestimated the impact on business confidence over time.
Trump set to announce second round of tariffs soon
US President Trump is expected to implement the second round of tariffs on Chinese imports either later today or tomorrow. That would bring the total value of imported goods from China covered by Trump's tariffs up to USD250bn or roughly 50% of total US imports from China. In contrast to what was previously feared, Trump is rumoured to be about to impose only a 10% tariff rate and not 25%, perhaps due to the negative feedback during the hearing process. While this is positive, we are still dealing with an escalation of the trade war.
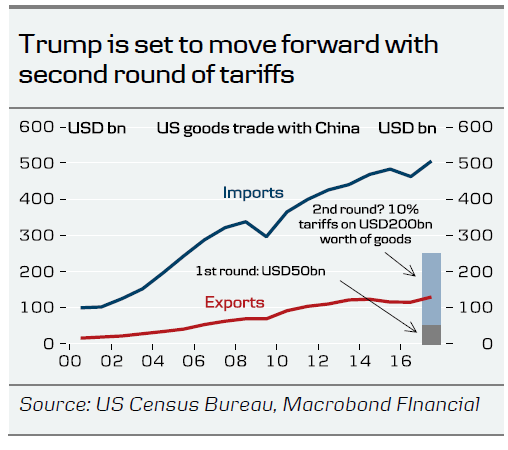
Trump's purpose seems to be to put China under pressure, forcing them to give in to his demands. The thinking is that the trade war is hurting China's economy and stock market much more than the US's, which would force them to ease its negotiation stance. The Chinese government has said it will continue to retaliate one-to-one to any US measures taken them. China has previously released a list of USD60bn worth of goods they are considering imposing tariffs on. The problem for China is that they import less from the US than they export so they also need to find other ways to retaliate. One way is to make life more complicated for US companies producing (like Apple) in China by restricting sales of materials and equipment to them, see Bloomberg, 17 September. The downside is that it probably hurts e.g. Chinese employment. This is another example of the argument that there are no winners in trade wars.
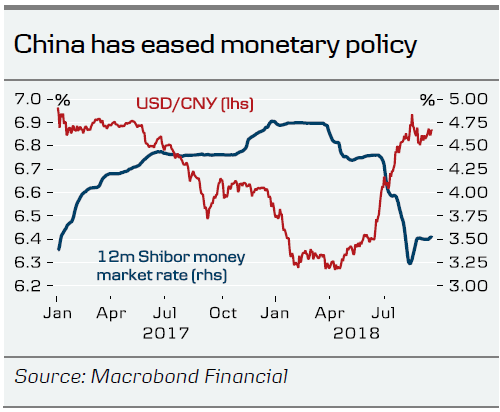
Last week, it was made known that the Trump administration (or at least US Treasury Secretary Mnuchin) has invited the Chinese government to Washington for trade talks. The talks are scheduled to take place in Washington 27-28 September. In our view, it is difficult for the Chinese government to accept the invitation, as it will not negotiate with a gun to its head, although we have not had an official view yet. As we wrote in our China Postcard: Trade war to drag out but still lots of potential, 12 September, the Chinese government is now thinking the trade war is going to drag out and is not going to scale back its Made in China 2025 plan. This is also one reason why the Chinese government has eased economic policy (CNY has weakened and Chinese rates have declined).
Trump may become more hawkish on China after mid-term elections
Last time it took around five weeks from Trump's decision to implement tariffs until they came into effect. That means the tariff will most likely come into effect before the US mid-term elections on Tuesday 6 November. It is also difficult not to see the trade war in the light of the election and what happens next and it may also depends on what the outcome of the US mid-term is. If the Democrats win one of the chambers (our base case), Trump becomes a 'lame duck' domestically, meaning he needs to focus on foreign and trade policy, where the US President has more power to act without Congressional approval. The risk is that a 'lame duck' Trump will be even more hawkish against China. If the Republicans win both chambers, Trump's focus may shift to domestic policy, as the Republicans would get another chance to make tax cuts or repeal Obamacare. For more details on the US mid-terms see US Midterm elections: Mostly a political event with limited implications for markets and the economy, 3 September.
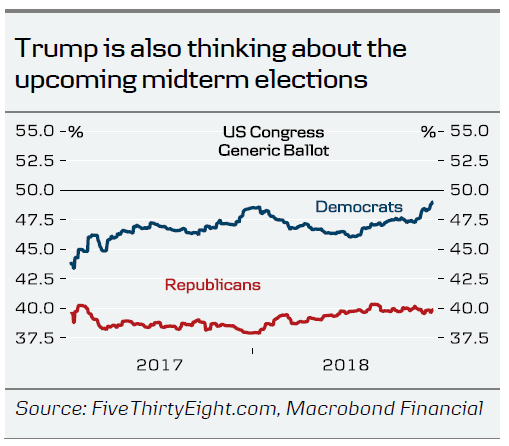
Trade war does not seem to be derailing the global expansion
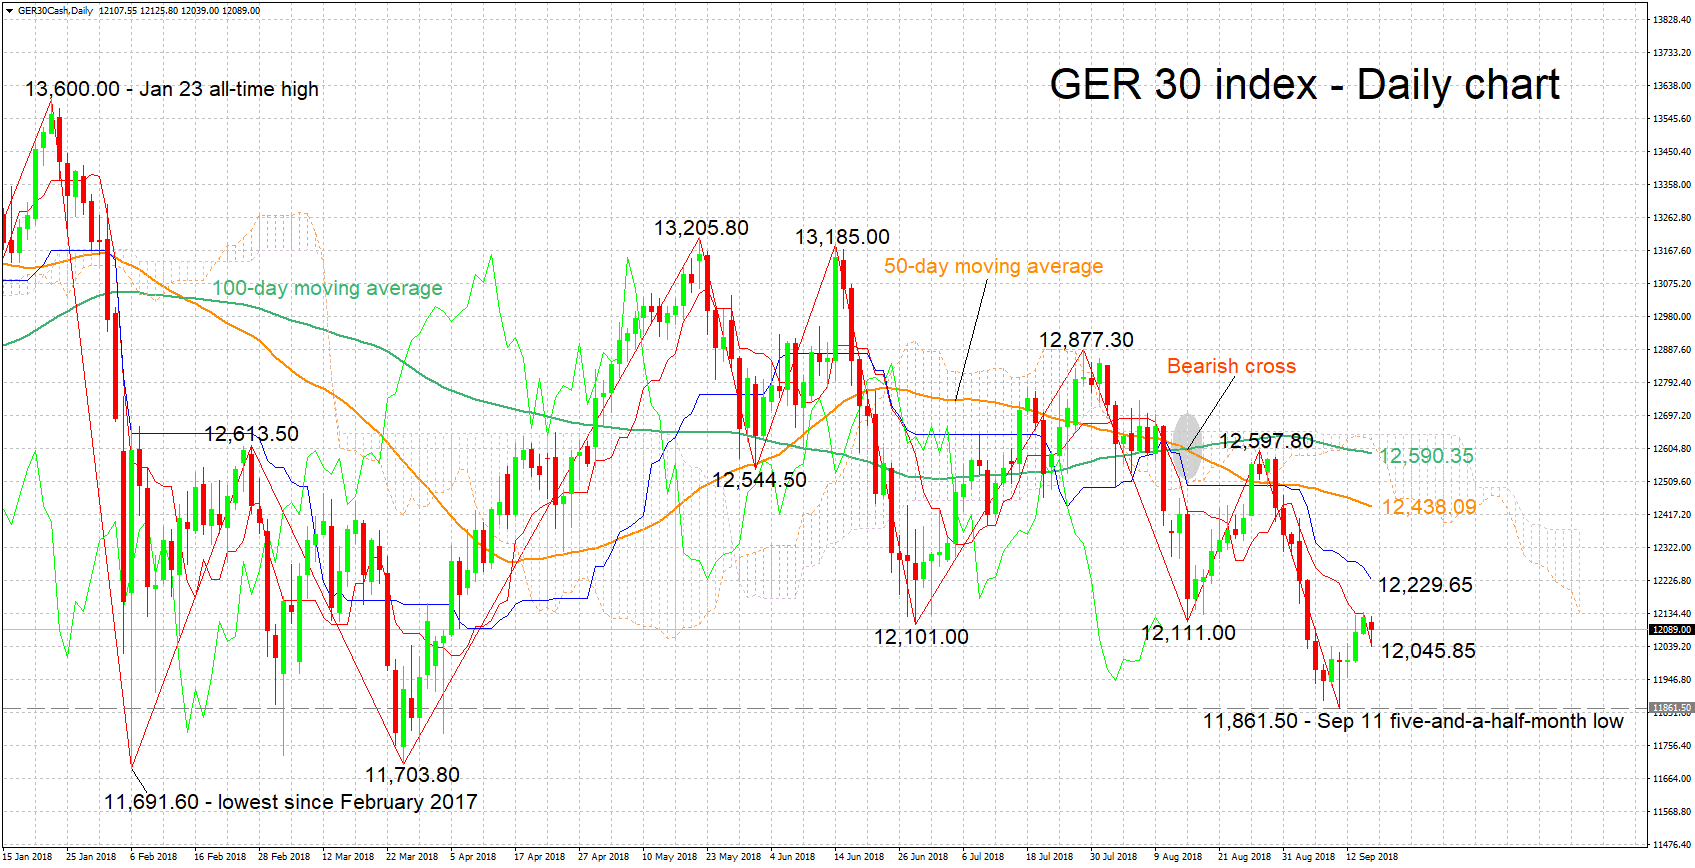
Our base case is that the Trump will eventually strike a deal with China but we think it is likely to get worse before it gets better and that a deal will not be within reach until well into 2019. The risk is that it drags out for longer.
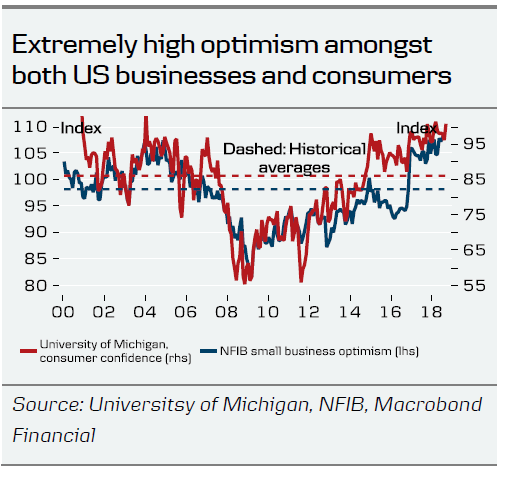
What are the economic implications? While the trade war is negative for growth, it is not going to derail the global expansion, in our view. In our view, the main transmission channel is through business confidence and investments. So far we have not seen a significant decline in US confidence in anticipation of Trump's second round of tariffs. China has eased both monetary and fiscal policy in order to offset the negative impact of trade uncertainties on the economy so we expect a soft landing in China. The risk is that we are underestimating the impact on business confidence and hence investments.
Germany 30 Index Looking Bearish in the Short- and Medium-Term
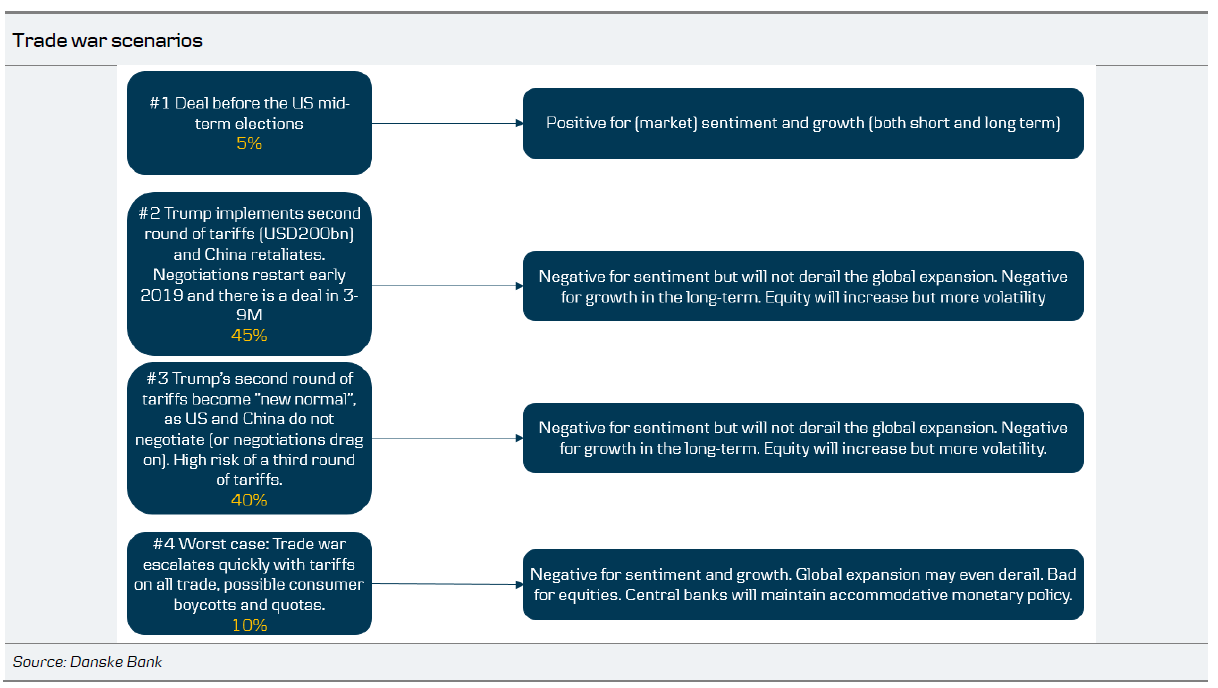
The Germany 30 index lost considerable ground after touching 12,597.80 in late August, this being its highest since August 10. Specifically, it is currently trading roughly 500 points below that peak.
The Tenkan- and Kijun-sen lines are negatively aligned, projecting a bearish short-term picture for the index.
Immediate support to losses may come around the current level of the Tenkan-sen at 12,045.85. The zone around this includes the 12,000 handle that may be of psychological importance. Further below, the region around the five-and-a-half-month low of 11,861.50 hit last week could provide additional support. Lower still, 11,691.60, a nadir last posted in early 2018, and prior to that visited in February 2017, would increasingly come in focus.
On the upside, resistance could occur around the Kijun-sen at 12,229.65, with the attention next turning to the 50-day (simple) moving average at 12,438.09 in case of steeper advances.
In terms of the medium-term outlook, it is looking negative, with trading activity taking place below the 50- and 100-day (simple) MA lines, as well as below the Ichimoku cloud.
Overall, both the short- and medium-term outlooks are looking bearish at the moment.
Trading USD/CAD Currency Pair
The Canadian dollar is a national currency of Canada. It is a free convertible currency and the sixth most traded currency on the Forex market.
The Canadian currency is also known as the commodity currency. That means that it correlates with commodity prices. So, it is necessary to be aware of key commodity prices while determining the direction of the movement.
Canadian Dollar on Forex
The rate of the Canadian dollar is pegged to raw materials. The behavior of all trading instruments paired with the Canadian dollar depends on the prices of oil, gas, ferrous and non-ferrous metals and other resources. Dynamics of prices for oil products influence the most. Furthermore, the Canadian currency is also affected by the state of the US economy.
Traders sometimes call the Canadian dollar the “loonie” because of an image of the loon on the $1 coin.
Trading the USD/CAD currency pair
The USD/CAD currency pair refers to the currency majors and makes the top 10 of the most popular currency pairs in the Forex market. USD/CAD is one of the most technical and liquid currency pairs, i.e. classical figures, patterns and indicators work well on it.
The USD/CAD quote shows how many Canadian dollars are needed to buy the US dollar. Therefore, USD is the base currency, and CAD is the quoted one.
USD/CAD is active during the American trading session, the largest trading volume falls on this session. This is due to the fact that time in the United States and in Canada is practically the same.
The Canadian dollar is relatively stable. Due to the high share of exports in the country's economy, the Canadian dollar remains liquid. The US and other countries keep their foreign exchange reserves in that currency. The Canadian dollar is traded with the US dollar, euro, yen, British pound and Swiss franc.
5% of orders opened on Forex accounts for CAD. This currency pair is influenced by the following factors:
- Macroeconomic indicators of the US and Canada (inflation, unemployment rate, GDP volume, index of business activity).
- The dynamics of oil prices. Canada takes the second place in the world for oil reserves, so oil prices are of great importance for this quote. If the oil prices rise, CAD will also grow, which means that the USD/CAD quotes will decrease.
Canada is the world's largest oil exporter. Therefore, sharp changes in the oil exchange rate inevitably affect the USD/CAD. So, it is necessary to follow the news on the oil market.
The USD/CAD currency pair has medium volatility, the average weekly range of price changes is 150-200 points. Traders use this pair for day trading and swing trading strategies.
This currency pair is popular among traders who prefer news trading. If you are a beginner on Forex, you can read the daily analysis of the currency majors, which is published on JustForex website.
Yield Outlook: Italy Moving to the Background and Fed Hikes to Continue
The focal point in the European bond markets over the summer has been Italy. This has resulted in downward pressure on, in particular, German yields and in August the 10Y bund yield was as low as 0.30%. Simultaneously, the yield on the 10Y Italian government bond reached 3.25%.
However, over the past couple of weeks, the market has scaled back on its 'Italian fears'. The new government has realised that it would be expensive (higher interest rate costs) to run a significant budget deficit. The latest comment from Finance Minister Giovanni Tria clearly indicates that the Italian budget will not breach the important 3% EU limit and that the budget deficit could be 'just' 2%. We expect the market focus on Italy to be less ahead, as we assume the budget deficit will stay below the 3% limit.
The next focal point for Italy is 27 September, when the Economic and Financial Update is due for release. It contains updated growth, debt and deficit projections. Also pivotal is the 15 October deadline for the submission of the budgetary plan to the EU Commission.
This does not mean Italy's budget troubles are over but merely that Italy is moving down the agenda and that we are moving back to a more normal market in respect of drivers for the fixed income market.
Still no strong drivers for higher EUR rates for the rest of 2018
The outlook for core inflation is still modest for the eurozone and we see little risk of a rate hike before December 2019, when we pencil in a first ECB rate hike of 20bp. Indeed, it seems to us that the European business cycle weakened slightly in the spring and over the summer. Overall, we continue to expect 10Y German yields to range-trade in a narrow 0.3-0.5% range for the rest of 2018.
Modest upward pressure in 2019
We continue to see modest upward pressure on yields and rates in Europe in 2019. The first ECB rate hike is moving closer and the ECB QE programme is widely expected to have ended. The latter has created some concerns that we could see a jump in yields like we saw in the US in 2013, when the Federal Reserve scaled back on bond purchases (tapering).
In 2013, 10Y US yields rose more than 1% over a few months. However, given that the end to ECB QE has been well communicated and that reinvestment of bonds maturing is set to continue in 2019, it is not our main case that the end to QE will have a major impact on EUR rates.
Fed on autopilot until neutral is reached
An important factor for longer dated European rates and yields is long US yields and where they are heading in 2019. Over the past couple of months, we have seen a series of strong US numbers and, importantly, the labour market has continued to tighten. In particular, we note that US wage growth finally seems to be picking up. Closely followed average earnings came in at 2.9% y/y in August. This was the highest level since 2019.
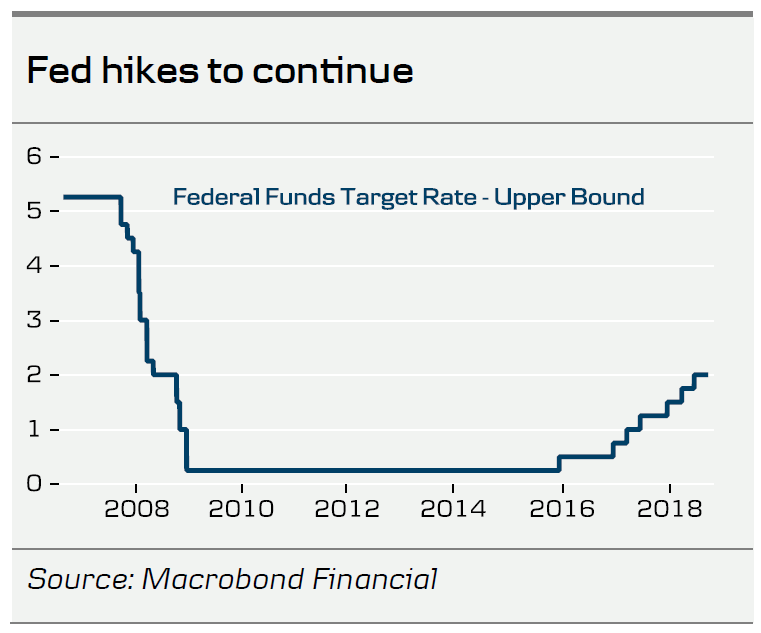
In particular, the labour market numbers mean the Fed is on autopilot right now and it is quite certain that it will hike both at the meeting later this month and again in December, which would take the Fed funds rate to 2.50% year-end.
At the press conference following the June meeting, Jerome Powell elaborated on why the Fed removed a lot of its forward guidance from the statement. He hinted that the Fed wants more flexibility, as the Fed funds rate is approaching the neutral rate (the rate where monetary policy is neither expansionary nor contractionary), which most FOMC members estimate is in the 2.75-3.00% range. We believe it will be more 'stop and go' for the Fed when it has reached neutral, which we believe is likely to happen in March 2019.
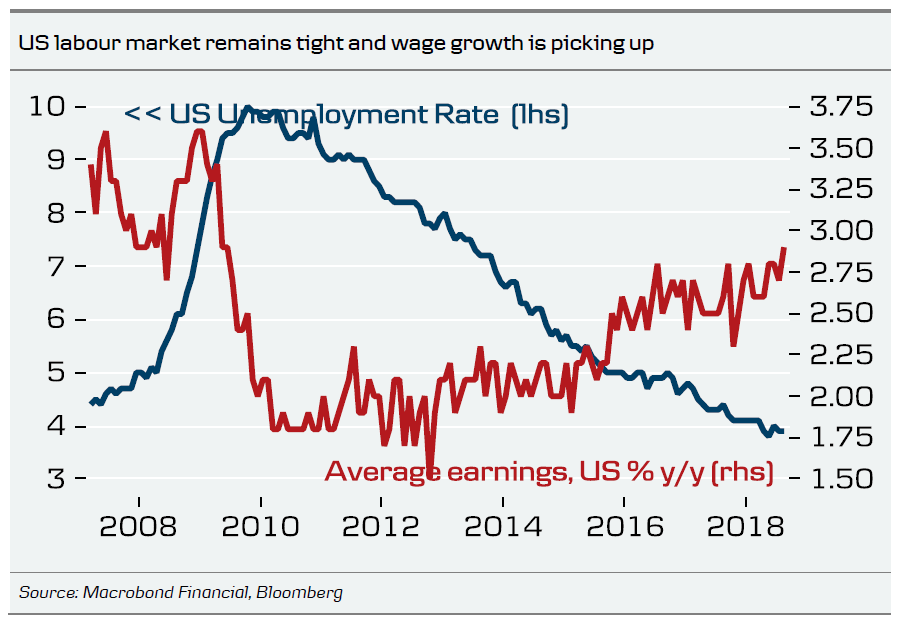
While the US economy is strong with high optimism, strong GDP growth, a low unemployment rate and stronger wage growth, there are also warning signs out there, not least the flattening of the US yield curve, and we think the Fed will adjust accordingly if markets start to send a strong recession signal. It is also easier for the Fed to do this, as every meeting next year is 'live', with Fed Chair Powell starting to host a press conference after each Fed meeting. Our base case remains that the Fed will be able to continue hiking in 2019.
Flatter US curve – will it invert?
Over the past couple of years, we have witnessed a pronounced flattening of the US curve, where 2s10s has moved from 125bp at the beginning of 2017 to around 22bp currently. It is well known in both academia and financial markets that an inversion of the yield curve over the past 50 years has been able to predict a recession in one to two years. Hence, the inversion itself can affect how the market is pricing its Fed funds expectations and in the end affect actual monetary policy as we argue above. If the curve were to invert, the Fed would probably be more reluctant to hike rates.
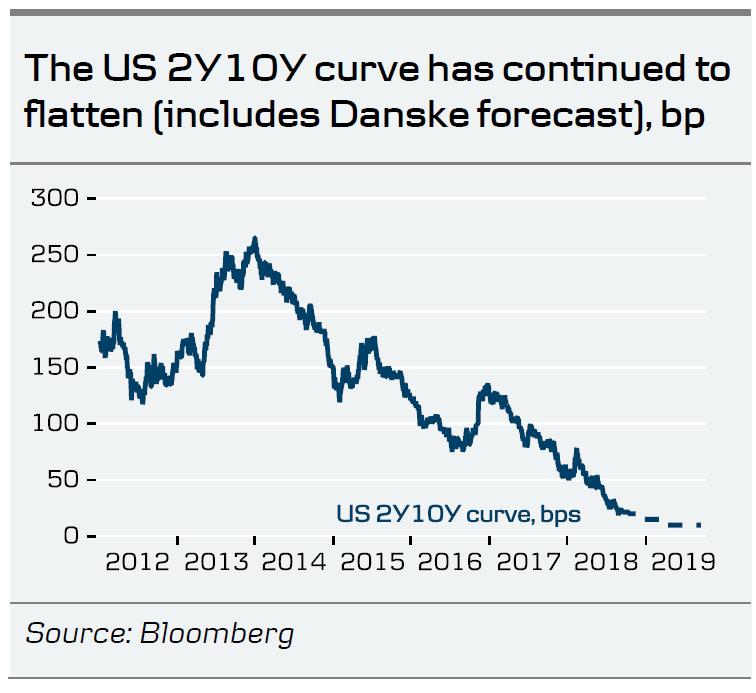
We do not forecast an inversion of the 2Y10Y curve in treasuries on a 12M horizon but, in our view, it will be very close. First, we expect the market to price a very flat to inverted money-market curve, keeping 2Y yields in check after all. In our opinion, the market is unlikely to price the Fed hikes we forecast beyond our 12M forecast horizon.
Furthermore, we continue to hold the view that 10Y treasury yields will move above the 3% level in 2019, as the labour market remains tight and the funding need continues to rise due to the expansive US fiscal policy.
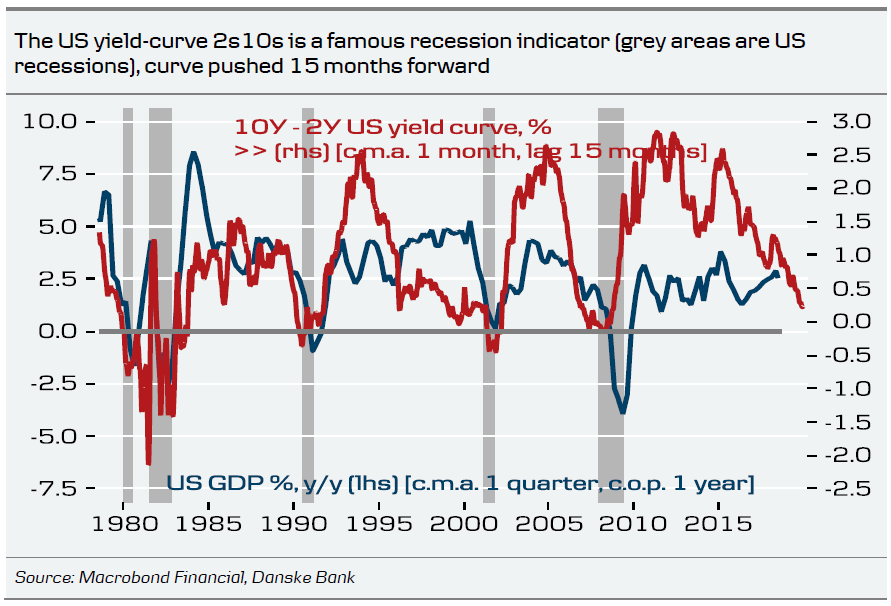
However, we expect the 2Y10Y curve to be very flat and believe we should expect a lively discussion about whether this is a signal a new US recession is getting closer. We expect 10Y US Treasury yields to reach 3.25% on a 12M horizon. We expect the curve 2Y10Y to flatten to just 10bp in 2019 and believe temporary inversions throughout 2019 are likely.
The 2Y10Y curve is not the only financial variable that has predictive power in respect of US recessions. Another model is to look solely at the money-market curve. If it inverts and the market starts to price in rate cuts in one to two years, it is a reliable indicator. Others have suggested using the 3M money-market rate instead of the 2Y bond yield. If this is the case, the yield is still some way from inverting.
The point is that both the Fed and the market will look at different indicators to judge whether a recession is underway, not just the 2Y10Y spread.
Wider spread between USD and EUR rates
We continue to see a further widening of the two-year spread between USD and EUR rates. We expect the Fed to hike twice more this year and to continue hiking next year. Importantly, we still expect the Fed to raise the Fed funds rate above the longer run dot of 2.83% (the Fed's estimate of the natural rate of interest when the economy is normalised) in coming years. We see a peak at 3.25% in 2020.
Conclusion: higher yields mainly an autumn 2019 story
We keep our 12M forecast for German 10Y yields unchanged at 0.8% and we continue to expect a steeper 2Y10Y German yield curve in 2019. The ECB still maintains a relatively tight grip on the short end of the curve, especially with the first ECB rate hike expected late in 2019.
We plan to publish the next issue of Yield Outlook in mid-October.
GBPUSD: Bullish Signal on Break above Daily Cloud; Next Key Barriers at 1.3162/72 Come Under
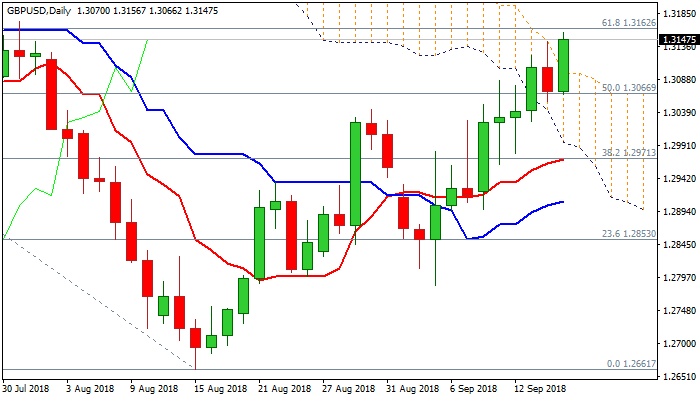
Cable accelerated higher on Monday and eventually broke above top of thickening daily cloud, to hit new high at 1.3156 on Monday (the highest since 31 July). Weaker dollar and reports on progress in discussion over Irish border, one of key Brexit obstacles, inflated pound to resume its broader uptrend. Fresh advance pressure next pivotal barriers at 1.3162/72 (Fibo 61.8% of 1.3472/1.2661 descend / falling 100SMA), close above which would generate next strong bullish signal, in addition to initial signal on close above daily cloud. Renewed strong bullish sentiment after Friday’s pause and strengthening bullish momentum, support scenario for extension towards 1.3213 (26 July high). Broken daily cloud top marks solid support (1.3097) which should keep the downside protected and maintain bullish stance.
Res: 1.3162; 1.3172; 1.3213; 1.3280
Sup: 1.3097; 1.3066; 1.3026; 1.3010
Sunset Market Commentary
Markets
Global core bonds continued where they left of at the end of last week, losing more ground. Trading volumes were rather low. The eco calendar was empty apart from a disappointing Empire Manufacturing business survey. Most investors remained sidelined awaiting a possible announcement of the US regarding additional tariffs on $200bn of Chinese goods. The threat pulled commodity prices lower, but core bonds thus failed to profit. European stock markets also didn’t really suffer losses like their Asian/Chinese equivalents overnight. German Bunds slightly underperformed vs US Treasuries. The continuation of the BTP rally is probably at play. Italian media reported that the FM pledged to hold the 2019 budget deficit at 1.6% of GDP while Lega would be pushing for tax incentives for Italian households to buy BTP’s and hold them until maturity. 10-yr yield spreads vs Germany narrowed slightly with Portugal (-4 bps), Greece (-7 bps) and Italy (-12 bps) outperforming. German yields increase by 0.4 bps (30-yr) to 2 bps (5-yr). The US yield curve bear steepens with yields 0.4 bps (2-yr) to 1.7 bps (30-yr) higher. The US 10-yr yield and 30-yr yields are testing first important resistance levels, respectively around 3% and around 3.15%.
USD trading showed a diffuse picture today. At the start of European dealings, EUR/USD set intraday lows in the 1.1620/30 area. It looked that the dollar would continue profiting from renewed investors uncertainty on the US-China trade war as rumours suggested that President Trump could impose additional tariffs on Chinese imports soon. However, the downside in EUR/USD was well protected. It wasn’t clear whether that was due to euro buying rather than USD softness. Both US and German yields kept an upward bias. Interest rate differentials are little changed. ECB’s Draghi last week confirming that the ECB is moving closer to reaching the inflation target helps putting a floor for the euro. European equities also didn’t perform that bad given the price action in Asia this morning. A further easing of tensions on Italy might also support the euro. The jury is still out and things can change again once there is clarity on the next steps of the US government on trade. The dollar is trading soft, but at the same time, the euro shows signs of resilience, too. EUR/USD is trading in the 1.1680/90 area. USD/JPY is little changed in the 112 area.
There were again plenty of Brexit headlines today. Investors still try to find out whether a Brexit deal has become more likely after recent ‘softer’ comments from EU officials (Barnier speaking of ‘de-dramatising’ the negotiations on the Irish boarder). For now, it remains unclear whether any Brexit deal will get enough support within PM May’s conservative party. This weekend’s comments from Boris Johnson at least suggest that any Brexit deal will face a tough battle when brought to the UK Parliament. With no concrete signs of any further progress in the Brexit process, last week’s cautious sterling rebound petered out. EUR/GBP still hovers in well-known territory in the 0.89 area. Cable regained the 1.31 big figure, but this was mainly due to US softness rather than sterling strength.
News Headlines
Italy’s Deputy PM Salvini and his party, Lega Nord, are working on a proposal to cut taxes for Italian savers who purchase sovereign bonds and keep the bonds until maturity. The proposal would be part of the 2019 budget, for which the deficit, according to Finance Minister Tria, will be no more than 1.6%.
The New York Fed Empire Index fell to 19.0 in September, from 25.6 in August, while only a decrease to 23.0 was expected. The index dropped to its lowest level since April. The focus on the future however, is more positive. The 6 month expectation for the index is estimated to read 30.3.
The IMF warned today that all options for the UK leaving the EU involve a substantial amount of costs, with a no deal scenario topping all other scenario’s. The organization estimated that the repercussions will be larger for the UK than the EU, backing the importance for UK PM May to strike a deal with the European Union.
Canada: Existing Home Sales Rose for 4rd Straight Month in August
Existing home sales rose 0.9% month-on-month in August - the 4th straight monthly gain. The increase builds on July's upwardly revised 3.0% gain (was 1.9%). Sales were higher in about half of all local markets in August, with solid gains in Toronto (+2.2%), Montreal (+2.8%) and Edmonton (+5.4%). On the flipside, sales were lower in Halifax (-8.2%), London (-1.2%) and Winnipeg (-1.0%).
In an encouraging bit of news, activity picked up in several markets in B.C. For instance, sales were up 2.9% in Vancouver – the first gain this year. Gains were posted in Fraser Valley (+0.6%), Okanagan-Mainline (+1.7%), and Victoria (+2.7%).
New listings were unchanged in August, as gains in the GVA (+4.0%) and Montreal (+3.8%) were offset by declines in the GTA (-1.6%) and Winnipeg (-7.7%).
With new listings unchanged and sales rising, the sales-to-new listings ratio edged up to 56.6 in August – consistent with a balanced market, although up from a low of 51.2 in May and coming closer to seller's market territory. Provincially, the ratio was highest in New Brunswick (63.4), followed by Quebec (62.3) and PEI (61.7). Conversely, the ratio was lowest in Saskatchewan (38.8), Alberta (46.2) and Newfoundland and Labrador (34.2) – indicating loose conditions in these markets. In Ontario, the ratio increased to 61.5, its highest level since January. The ratio also increased to 52.5 in B.C.
The average home price rose for the fifth straight month in August (+1.0%). It was also 1.0% higher on a year-over-year basis – an improvement compared to the 0.6% year-over-year gain recorded in July.
The quality-adjusted MLS home price index was up 2.5% from a year-ago, marking an acceleration from July's 2.2% gain. Quality-adjusted prices were higher in most markets. Once again, the Prairies were the exception, with markets in Saskatchewan and Alberta dealing with oversupplied conditions. Price growth remained strong in Ottawa (+7.2% y/y) and Montreal (+5.9%), lifted by tight market conditions. Prices were higher in the GTA (+1.4% y/y) – marking the first such gain since February. In the GVA, price growth decelerated to its softest pace since 2014 (+4.1% y/y). In Fraser Valley, prices were up 11% - still strong, but marking the slowest growth since 2015.
Key Implications
It's clear that housing markets are moving past the B-20 induced weakness earlier in the year. Questions now centre on the path of the recovery going forward. Our view is that sales and prices will continue to grow, but that rising borrowing costs will restrain the pace of expansion. This is particularly true for more expensive markets in Ontario and B.C. where affordability pressures are acute.
Encouragingly, there were signs in August in B.C.'s market is bottoming out after a period of weakness. It's been several months since the implementation of provincial policy measures in B.C., leaving markets with plenty of time to adjust. While one month of data hardly makes a trend, August's performance could be a sign that the worst is over for the province.
From the standpoint of overall economic growth, rising resale activity should ensure that residential investment adds to third quarter GDP after subtracting, on average, in the prior two quarters.
EURUSD Outlook: Euro Generates Bullish Signal on Bounce above Falling 100SMA
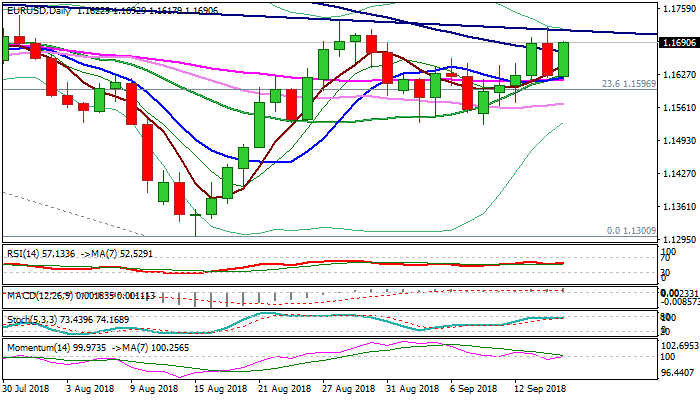
The Euro regained traction and entered Monday's US session in firm tone and retraced the largest part of Friday's fall, bringing bulls back to play. The dollar fell in expectations of news about US – China trade conflict, as US President Trump is expected to announce new tariffs on imports from China as early as today. Expectations are for 10% tariffs, which is less than administration's initial plan for 25% tariff on $200 billion worth imported goods from China. The EURUSD pair returned back above falling 100SMA (1.1672) and looking for fresh bullish signal on daily close above, to open way for test of 28 Aug high at 1.1733 and extension towards pivotal barrier at 1.1780 (Fibo 38.2% of 1.2555/1.1300 descend. Inverse Head and Shoulders pattern is forming on daily chart, with the neckline (1.1716) being under pressure. Sustained break higher would complete the pattern and to bullish signals from strengthening momentum and daily MA's in bullish setup.
Res: 1.1716; 1.1721; 1.1733; 1.1780
Sup: 1.1672; 1.1646; 1.1615; 1.1568
GBP/JPY Mid-Day Outlook
Daily Pivots: (S1) 146.13; (P) 146.58; (R1) 146.90; More...
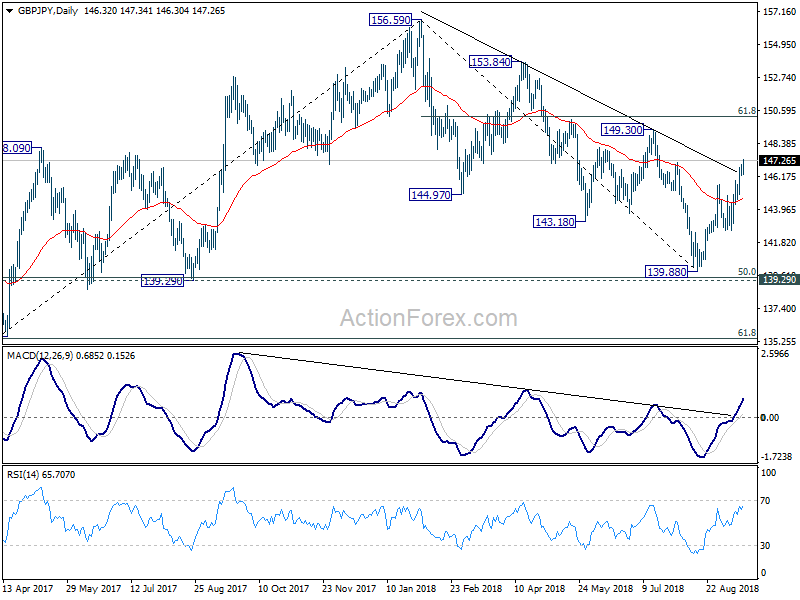
GBP/JPY's rise resumes after brief consolidation and reaches as high as 147.34 so far. Intraday bias is back on the upside. As noted before, whole decline from 156.59 could have completed at 139.88, just ahead of 139.29/47 key support zone. Decisive break of 149.50 resistance will confirm our bullish view. On the downside, below 146.24 minor support will turn intraday bias neutral and bring retreat. But further rally will remain in favor as long as 142.58 support holds.
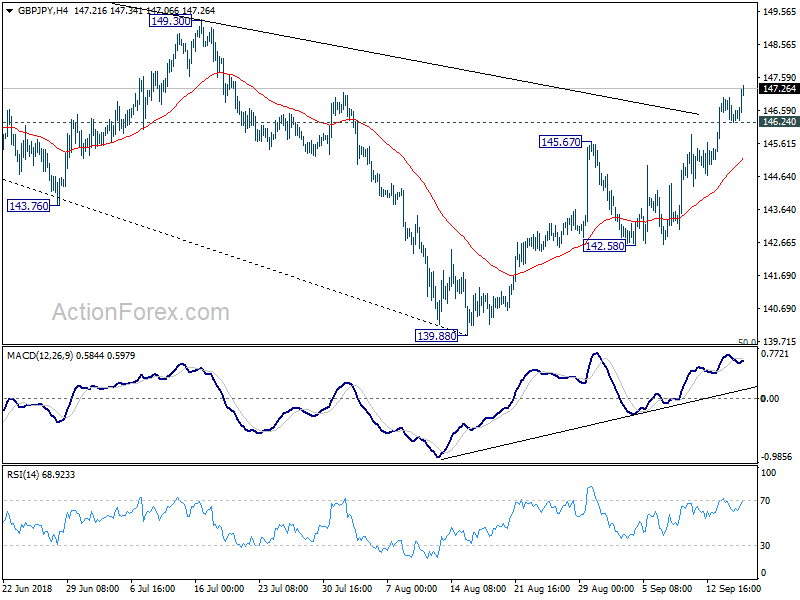
In the bigger picture, as long as 139.29 cluster support (50% retracement of 122.36 to 156.59 at 139.47) holds, the decline from 156.69 is seen as corrective move. That is, rise from 122.36 (2016 low), is still expected to extend higher through 156.69. However, sustained break of 139.29/47 should confirm medium term reversal and turn outlook bearish.