

Sample Category Title
USD/JPY Potential Retest Of The Lower Channel Trend Line
The USD/JPY currency pair is trapped within the equidistant bullish channel. As the risk-off continues across Asian Equities today, the question has become whether the last few days of the last week was a dead cat bounce in European Equities or not, whilst the US equities remained strong. This mixed sentiment may weigh USD into range. Geopolitics is still a focus for markets and we might see plenty of catalysts this week that might re-ignite various concerns. Additionally, recent reports have indicated that the Bank of Japan (BOJ) may re-adjust their policy settings at their next meeting might weigh somehow on the JPY. If the BOJ mentions its monetary policy tightening - it might help in the USD/JPY currency pair going lower.
Technically, 111.90-112.00 is the mid-line between the Admiral Daily Pivot and Admiral Resistance so the rejection is possible. The target is the POC zone around 111.50 where the pair might bounce. However, a drop below the POC suggests a further drop in the USD/JPY towards the S3 line around 111.35. If we see a bounce from the POC zone, the next targets could be 112.00 and 112.30.
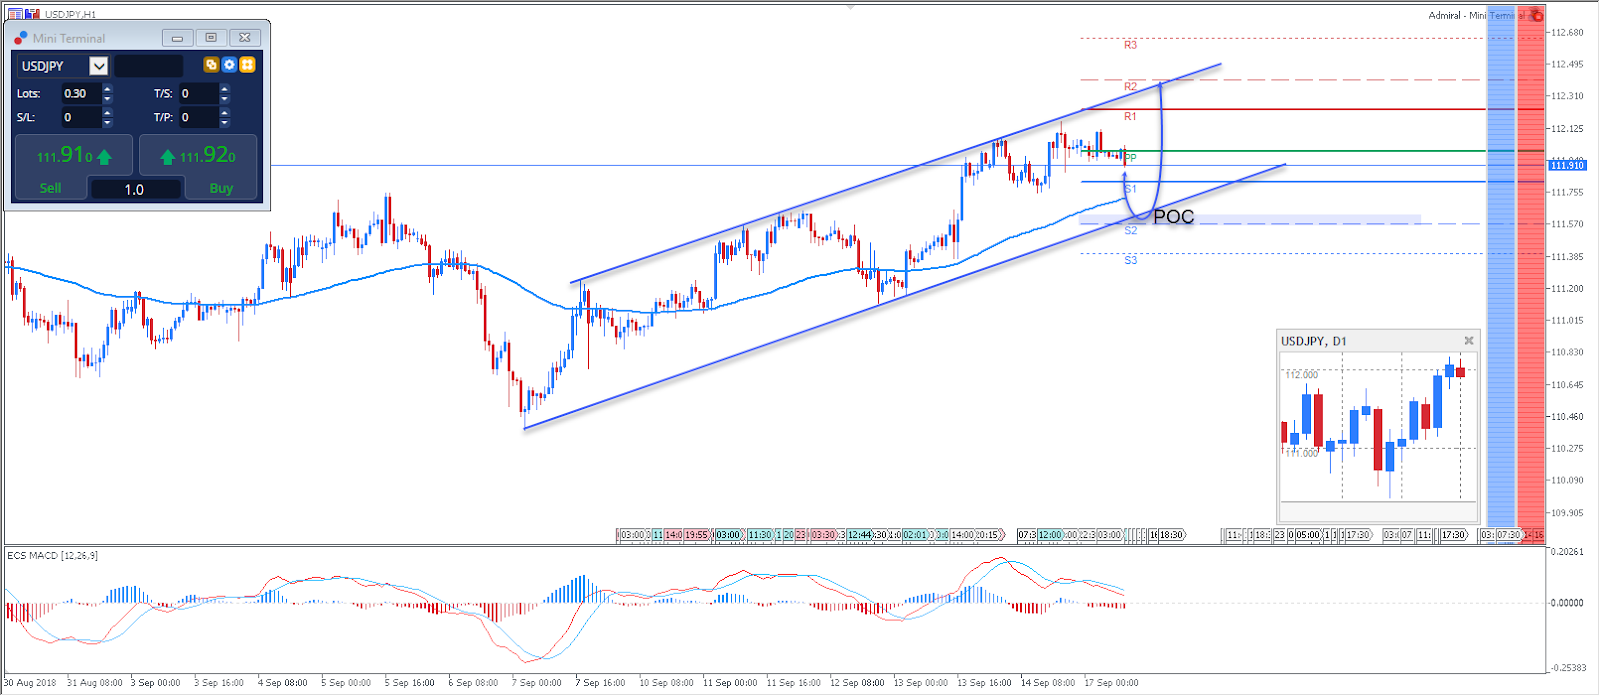
Short Pivot Lines - Daily Support and Resistance
Long Pivot Lines - Weekly Support and Resistance
POC - POC - Point Of Confluence (The zone where we expect the price to react - aka the entry zone)
IMF: Disruptive Brexit could lead to a significantly worse outcome
In an IMF report on UK, the organization expect growth to remain "moderate in the near term", averaging around 1.5% in 2018 and 2019. However, it wanted that " A more disruptive departure from the EU could lead to a significantly worse outcome, especially if it were to occur without an implementation period. ". On the other hand, "an agreement featuring fewer impediments to trade than currently expected could buoy business and consumer confidence, leading to faster growth.".
IMF Managing Director Christine Lagarde also said, "compared with today's smooth single market, all the likely Brexit scenarios will have costs for the economy and to a lesser extent as well for the EU." And she warned that "The larger the impediments to trade in the new relationship, the costlier it will be. This should be fairly obvious, but it seems that sometimes it is not."
In addition to Brexit, UK also faces a range of other economic challenges. These include "persistently lackluster productivity growth, large public debt, and the wide current account deficit." Nonetheless, UK's "sound macroeconomic framework, regulatory environment, and deep capital and flexible labor markets will be advantages in implementing reforms to address them."
UK Chancellor of Exchequer Philip Hammond urged the government to listen to the "clear warnings" of the IMF of no-deal Brexit. Though, he also noted that no-deal outcome is unlikely even though it's not impossible.
ECB Coeure wants more clarity on pace of rate hike when conditions warrant
ECB Executive Board member Benoit Coeure urged the central to give more details in the forward guidance, regarding the pace of rate hike when it starts. He said, "should economic conditions warrant, there might be a case for the Governing Council to go beyond the timing to lift-off (rates) in further clarifying the pace at which it expects to remove policy accommodation."
And, "a further clarification of our reaction function might help market participants and the broader public to better anticipate the likely future path of short-term interest rates."
Currently, ECB's plan is to half the monthly asset purchase to EUR 15B starting October, and stop it after December. Interest rates would stay at present levels through the summer of 2019.
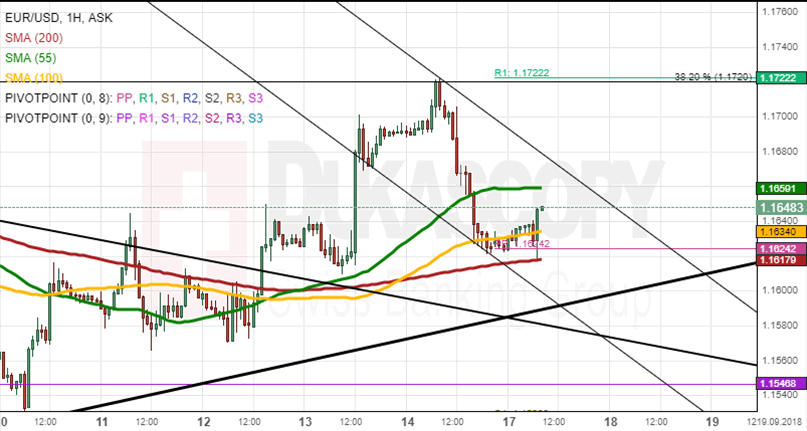
EURUSD Analysis: Surges To Weekly R1 At 1.1722
The European Single Currency depreciated 0.33% against the US Dollar since Friday's session. On Monday morning, the currency exchange rate was located between the SMAs, near the weekly pivot point at the 1.1624 level.
In regards to the near future, most likely, the rate should go upwards due to the support of the weekly PP at the 1.1624 mark together with the support of the 200-hour and the 100-hour simple moving averages at 1.1620 level.
However, the rate might be stopped from the surge at the 1.1660 mark where 55-hour simple moving average may resist the rate to move downwards to the weekly pivot point at the 1.1624 mark.
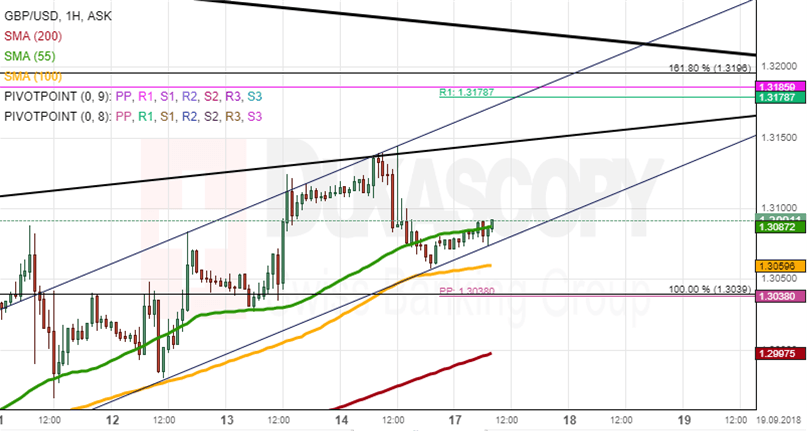
GBPUSD Analysis: Is Located Above The August High At 1.3100
The British pound depreciated 0.10 % against the US Dollar. On Monday morning hours, the currency exchange pair was supported by the 100-hour simple moving average, located above the August high at the 1.3100 level.
In regards to the near future, the 55-hour and the 100-hour simple moving averages will move along with the rate giving support for the currency to surge upwards to the upper boundary of the medium ascending line at the 1.3150 mark.
Besides, the rate should not ignore technical indicators during today's trading session due to an absence of Brexit fundamentals.
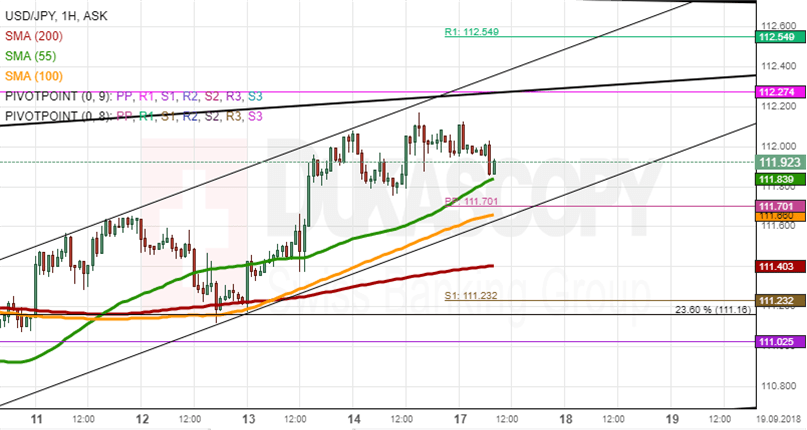
USDJPY Analysis: Is Above Weekly PP At 111.70
The US Dollar depreciated 0.02% against the Japanese Yen since Friday's session. On Monday morning, the currency pair was located at the 112.00 level between the monthly R1 at the 112.27 mark and the weekly PP at the 111.70 mark.
In regards to the near future, the rate will surge upwards to the upper boundary of the medium ascending line at the 112.20 level and the monthly R1 at the 112.27 mark and most likely, the rate will bounce off the pattern line to move back into the previously drawn trend-line.
Moreover, the 55-hour simple moving average should give additional support for the currency pair during the trading day.
XAUUSD Analysis: Is About To Be Squeezed In
The gold price depreciated 0.40% since Friday's trading session. During Monday morning hours, the yellow was located near the monthly pivot point at the 1,196.00 mark, which is located under the simple moving averages.
In regards to the near future, most likely, the yellow metal should move downwards due to the resistance of the simple moving averages to bounce off the bottom boundary of the ascending trend or pass through it during today's trading session.
However, the monthly pivot point at the 1,195.00 mark may push the rate to hike upwards, ignoring the simple moving averages resistances.

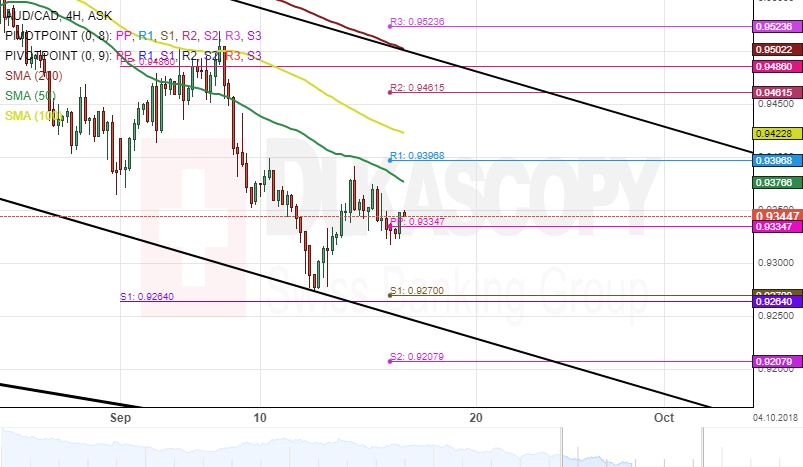
AUD/CAD 4H Chart: Bearish Momentum
A medium-term descending channel has guided the price movement of the AUD/CAD currency pair. The pair tested the lower boundary of the channel pattern on September 12 and had since made a brief retracement to the upside.
Currently, the exchange rate is trading below the 50-hour simple moving average and the weekly pivot point at 0.9334.
Technical indicators suggest that the bearish momentum is likely to continue within this session. The potential target for bearish traders could be near a support cluster formed by the combination of the weekly and the monthly PPs at the 0.9270 mark.
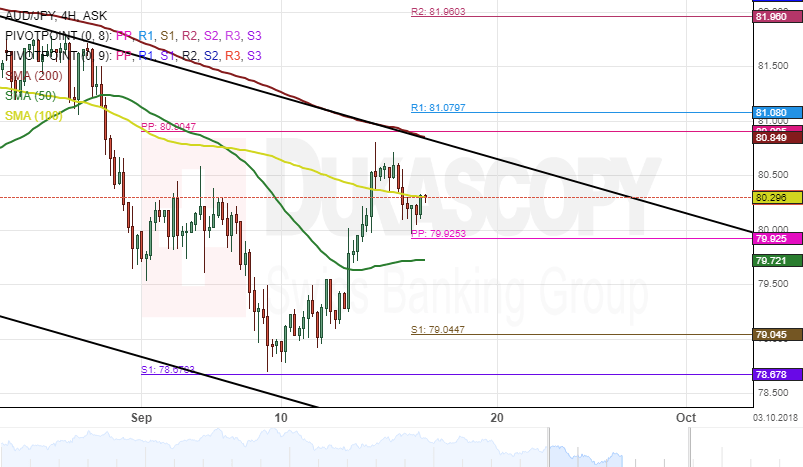
AUD/JPY 4H Chart: Targets At 80.87
The AUD/JPY exchange rate has been trading in a descending channel since mid-July. The medium-term descending channel pattern guided the currency pair toward November 16, 2016 low level at 78.77 a few days ago.
However, after reaching its lowest level since 2016, the pair made a U-turn north. As a result, the rate has breached both the 50– and 100-hour simple moving averages.
Everything being equal, it is likely that the Australian Dollar continues to gain strength against the Japanese Yen during the following trading sessions. The next targets for the pair could be the 200-hour SMA at 80.87.
The Analytical Overview Of The Main Currency Pairs
The EUR/USD currency pair
Technical indicators of the currency pair:
Prev Open: 1.16891
Open: 1.16224
% chg. over the last day: -0.51
Day's range: 1.16179 – 1.16366
52 wk range: 1.0571 – 1.2557
On Friday, the bearish sentiment was observed on the EUR/USD currency pair. The decrease in quotes was almost 100 points. Federal Reserve officials said about the need for further tightening of monetary policy after the meeting in September, which increased demand for the American currency. At the moment, the trading instrument has been growing. The key support and resistance levels are 1.16300 and 1.16600, respectively. We recommend opening positions from these marks.
At 12:00 (GMT+3:00), the consumer price index will be published in the Eurozone.
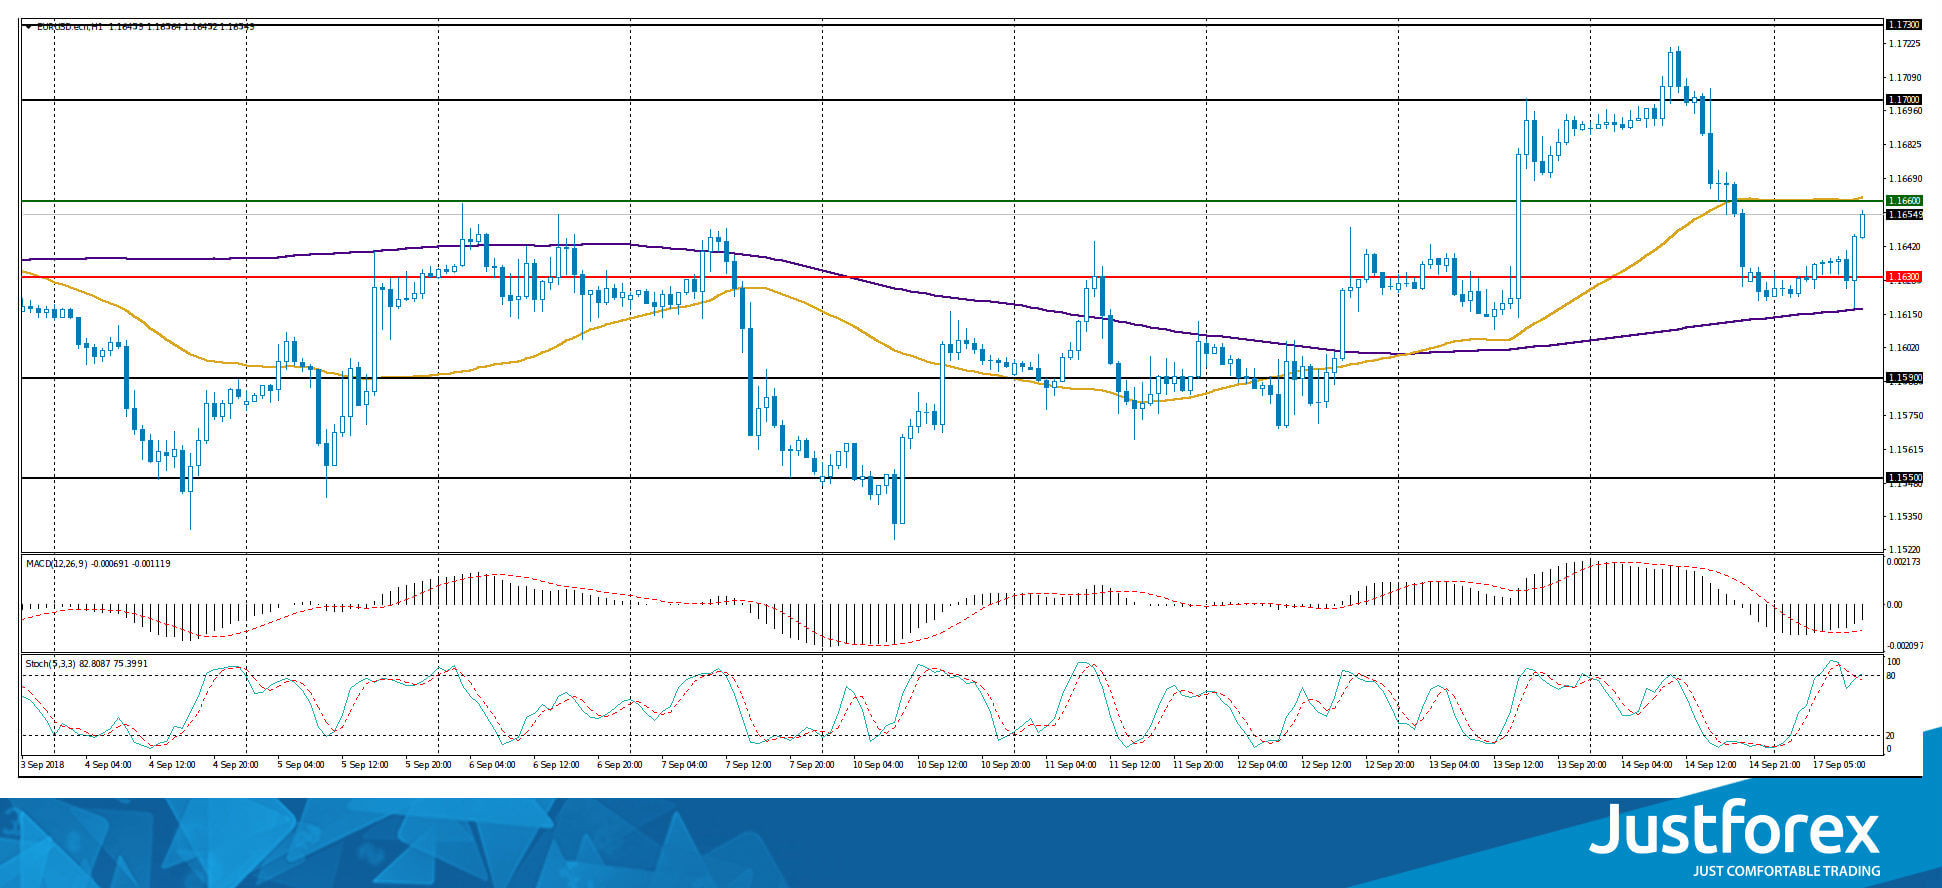
Indicators do not send accurate signals: the price has fixed between 50 MA and 200 MA.
The MACD histogram is in the negative zone, but above the signal line, which gives a weak signal to sell EUR/USD.
Stochastic Oscillator is located near the overbought zone, the %K line has crossed the %D line. There are no signals.
Trading recommendations
Support levels: 1.16300, 1.15900, 1.15500
Resistance levels: 1.16600, 1.17000, 1.17300
If the price fixes below 1.16300, further decline in the EUR/USD quotes is expected. The movement is tending to 1.15900-1.15700.
An alternative may be the growth of the EUR/USD currency pair to the level of 1.17000-1.17300.
The GBP/USD currency pair
Technical indicators of the currency pair:
Prev Open: 1.31061
Open: 1.30660
% chg. over the last day: -0.30
Day's range: 1.30729 – 1.30845
52 wk range: 1.2361 – 1.4345
On Friday, the bearish sentiment was observed on the GBP/USD currency pair. The British pound weakened against contradictory news on Brexit. At the moment, the technical pattern is ambiguous. The key support and resistance levels are: 1.30600 and 1.31000, respectively. Positions should be opened from the key levels. In the near future, a technical correction is not ruled out.
The news feed on the UK economy is calm.
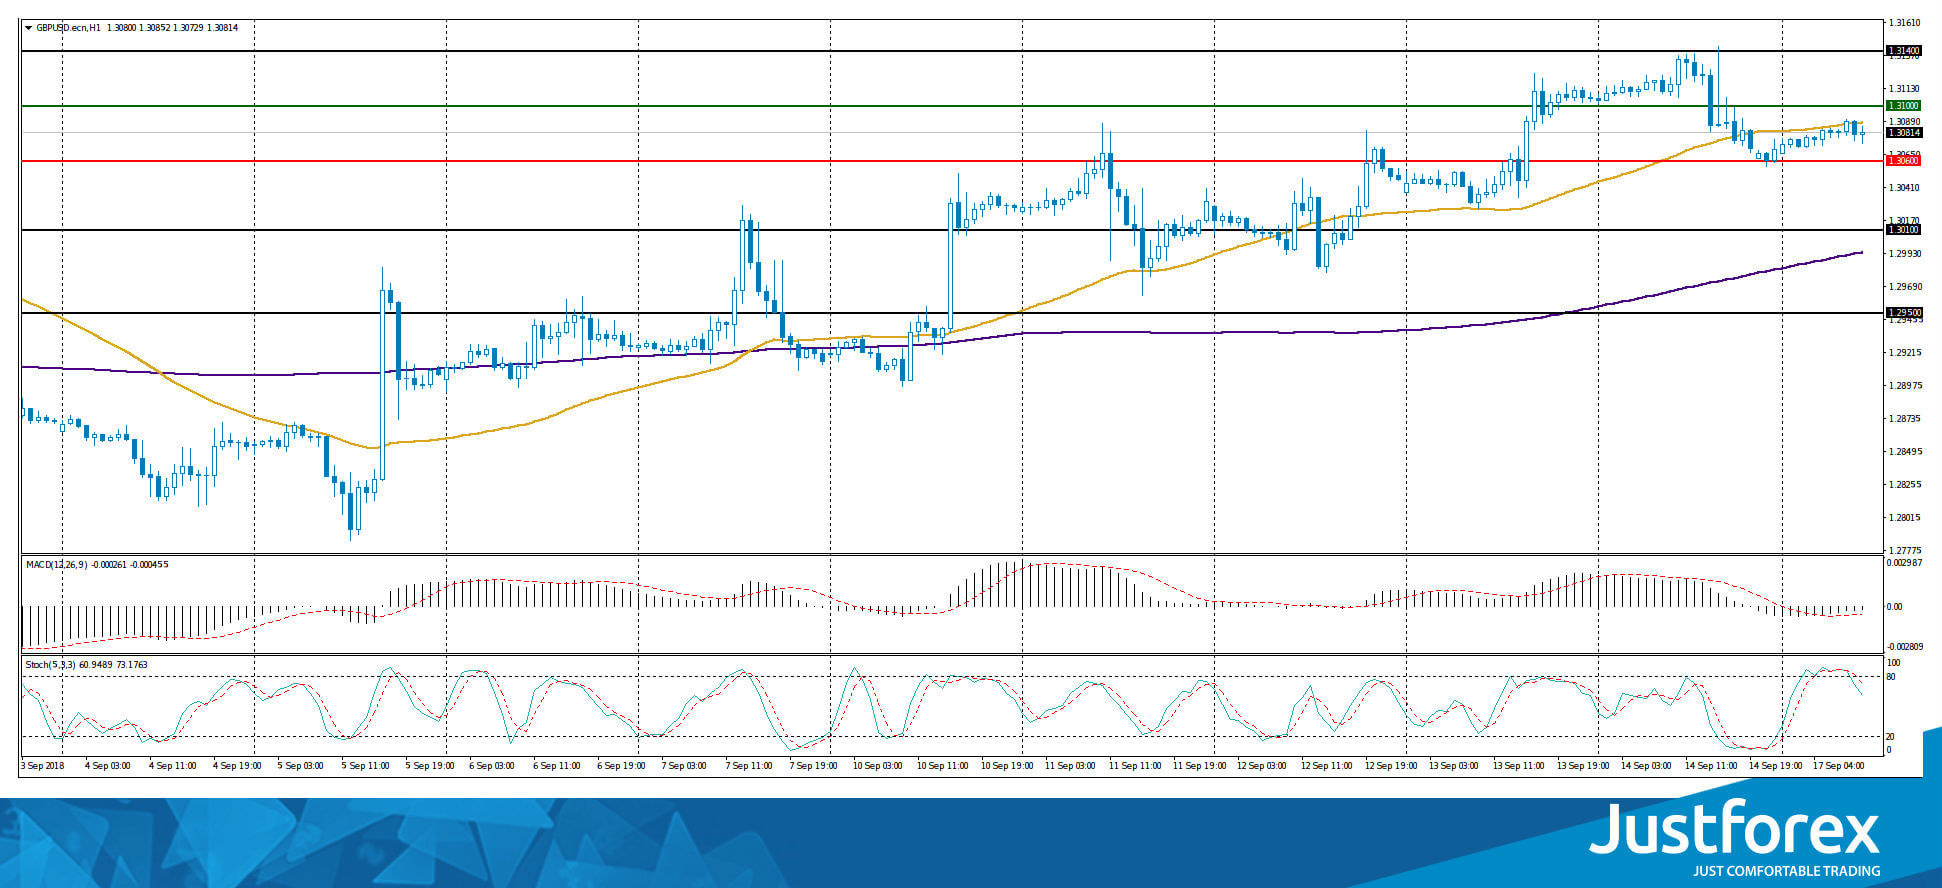
Indicators do not send accurate signals: the price has crossed 50 MA.
The MACD histogram is located near the 0 mark.
Stochastic Oscillator is in the neutral zone, the %K line is below the %D line, which indicates a decrease in quotes.
Trading recommendations
Support levels: 1.30600, 1.30100, 1.29500
Resistance levels: 1.31000, 1.31400
If the price fixes above the round level of 1.31000, the GBP/USD quotes are expected to rise. The movement is tending to 1.31400-1.31600.
An alternative may be the decrease of the GBP/USD currency pair to 1.30200-1.30400.
The USD/CAD currency pair
Technical indicators of the currency pair:
Prev Open: 1.29937
Open: 1.30292
% chg. over the last day: +0.27
Day's range: 1.30297 – 1.30324
52 wk range: 1.2059 – 1.3795
On Friday, the bullish sentiment was observed on the USD/CAD currency pair. At the moment, the technical pattern is ambiguous. The trading instrument is consolidating. Financial market participants expect additional drivers. Local support and resistance levels are: 1.30200 and 1.30500, respectively. We recommend monitoring current information regarding NAFTA negotiations.
The news feed on the economy of Canada is calm.
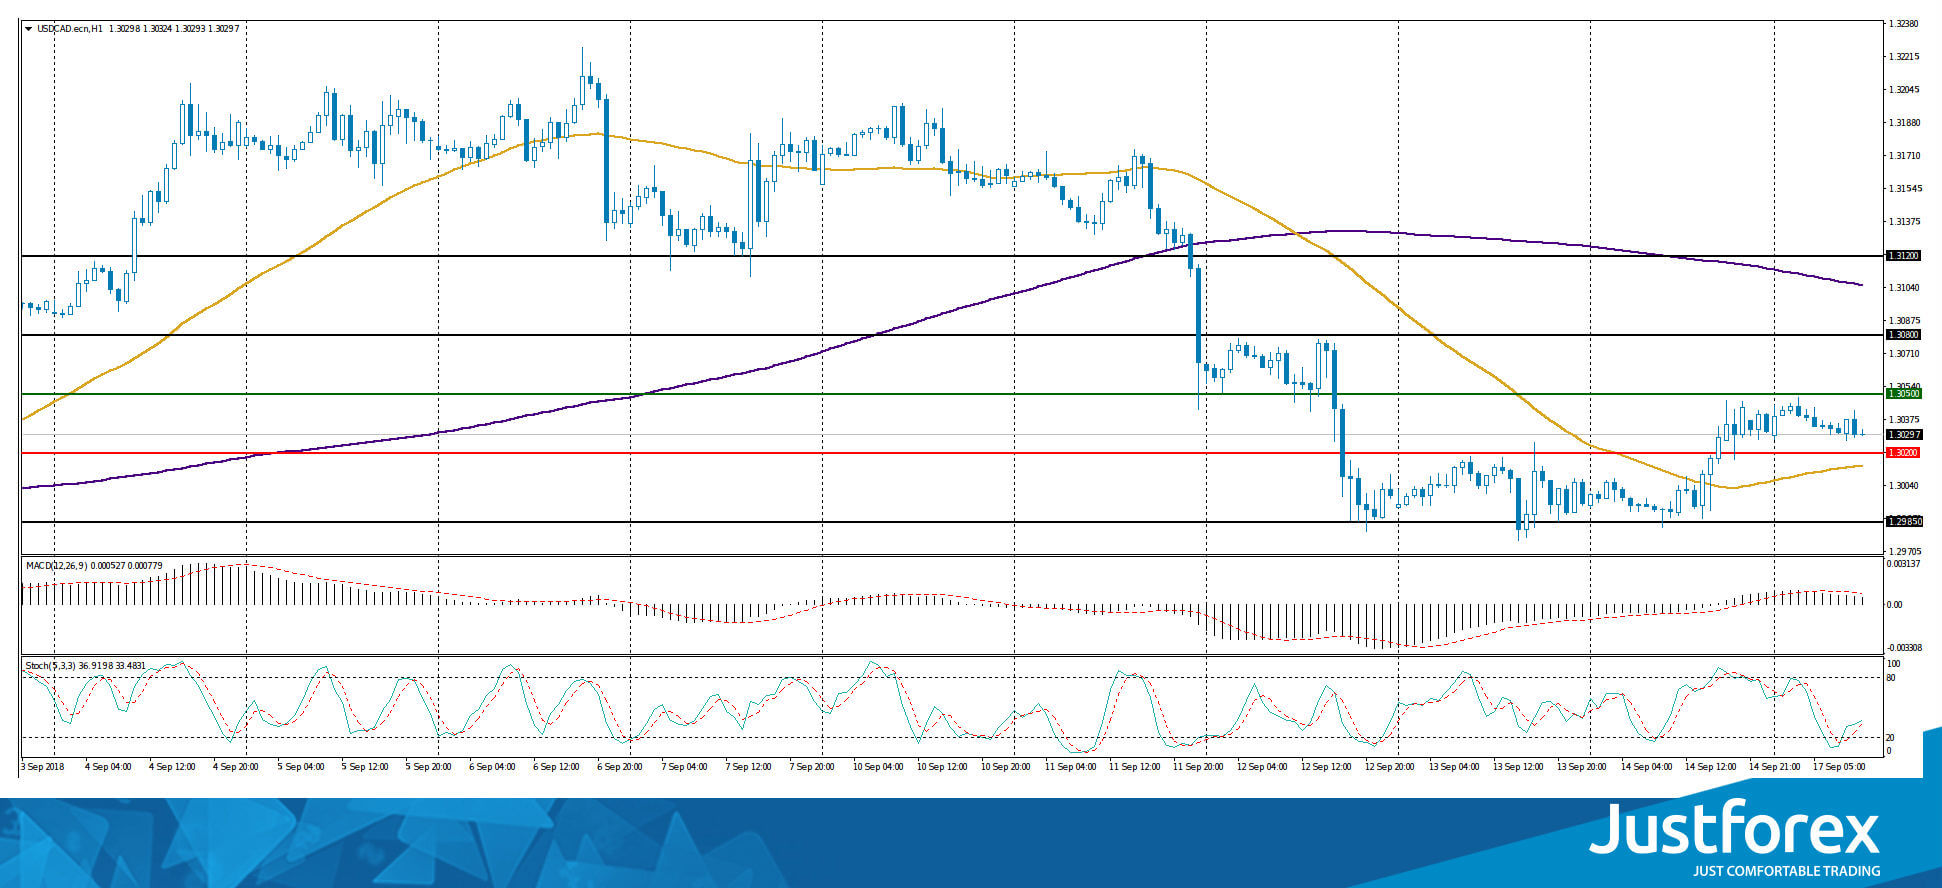
The price has fixed between 50 MA and 200 MA, which are strong dynamic support and resistance levels.
The MACD histogram is in the positive zone, but below the signal line, which gives a weak signal to buy USD/CAD.
Stochastic Oscillator is in the neutral zone, the %K line is above the %D line, which indicates the bullish sentiment.
Trading recommendations
Support levels: 1.30200, 1.29850
Resistance levels: 1.30500, 1.30800, 1.31200
If the price fixes below the already "mirror" support of 1.30200, the USD/CAD quotes are expected to fall. The movement is tending to 1.29850-1.29500.
Alternative option. If the price fixes above 1.30500, it is necessary to look for entry points to the market to open long positions. The target movement level is 1.30800-1.31000.
The USD/JPY currency pair
Technical indicators of the currency pair:
Prev Open: 111.921
Open: 112.005
% chg. over the last day: +0.13
Day's range: 111.855 – 111.914
52 wk range: 104.56 – 114.74
On Friday, there was a variety of trends on the USD/JPY currency pair. At the moment, the trading instrument is moving in flat. Local support and resistance levels are: 111.800 and 112.100, respectively. The positions should be opened from these marks. The trading instrument has the potential for further growth. We recommend paying attention to the US government bonds yield.
The financial markets of Japan are closed due to the holiday.
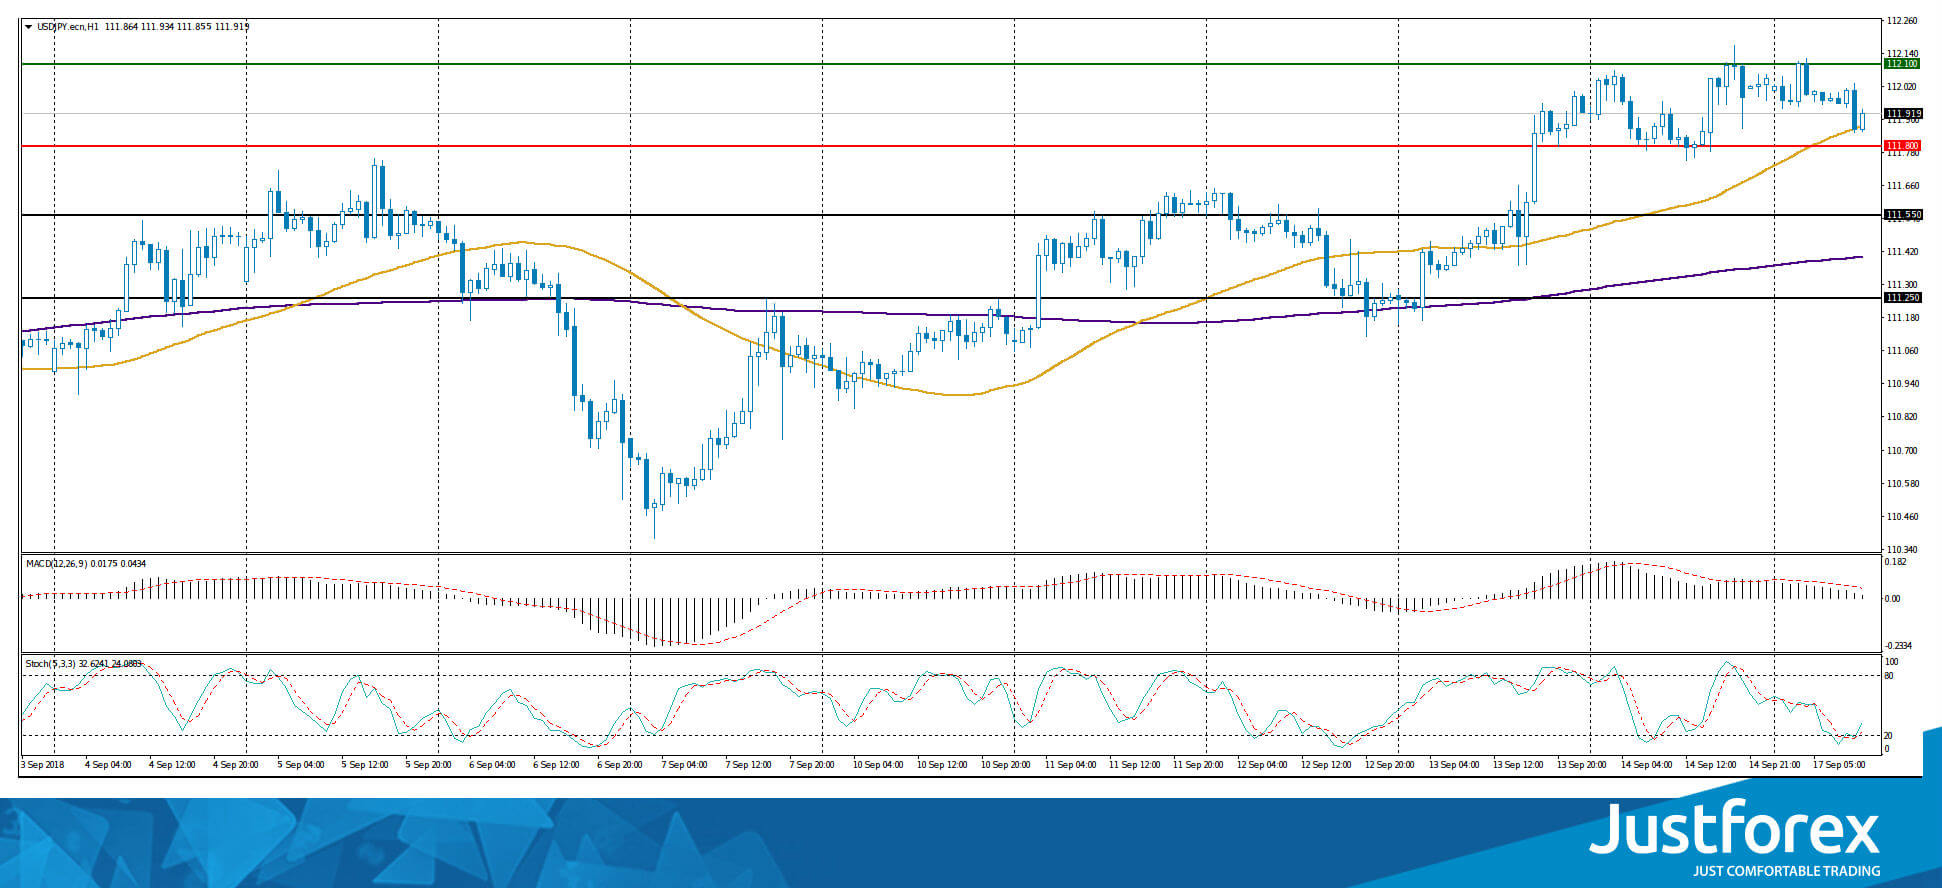
Indicators do not send accurate signals: the price is testing 50 MA.
The MACD histogram is located near the 0 mark. There are no signals at the moment.
Stochastic Oscillator has started to move out the oversold zone, the %K line is above the %D line, which gives a signal to buy USD/JPY.
Trading recommendations
Support levels: 111.800, 111.550, 111.250
Resistance levels: 112.100, 112.500
If the price fixes above the resistance level of 112.100, the USD/JPY quotes growth is expected. The movement is tending to 112.500-112.750.
Alternative option. If the price fixes below the level of 111.800, we recommend looking for entry points to the market to open short positions. The target movement level is 111.550-111.250.