

Sample Category Title
Dollar Awaits Jobs Data As Trade Tensions Mount
The US dollar is lower against most major currencies on Thursday. Trade tensions continue to worry investors as NAFTA negotiations between Canada and the US drag on, although both sides remain optimistic. US-China relations are far form that place with $200 billion in US tariffs ready to go live on Friday. The ADP released earlier came lower than forecasted, private payrolls went up by 163,000 instead of 195,000. The U.S. non farm payrolls (NFP) will have a solid jobs number, but all eyes will be on wage growth. The market anticipates an interest rate hike by the U.S. Federal Reserve in September and a strong inflationary data point would validate that view.
- US expected to add 190,000 jobs
- US wages forecasted to gain 0.2 percent
- Canadian jobs to rise by 5,000
CAD Rises as Central Bank Willing to Hike if NAFTA Deal Crashes
The Canadian dollar rose on Thursday after Bank of Canada (BoC) Deputy Governor Carolyn Wilkins said that a breakdown in the US-Canada trade talks would not keep the central bank from raising interest rates.
The loonie had been under pressure for most of the day as comments out of Washington were not conclusive about the fate of the NAFTA 2.0. The Canadian central bank had kept interest rates unchanged on Wednesday giving little support for the currency. The comments from Deputy Governor Wilkins are a shot in the arm for the Canadian dollar ahead of employment data out of Canada and the United States on Friday.
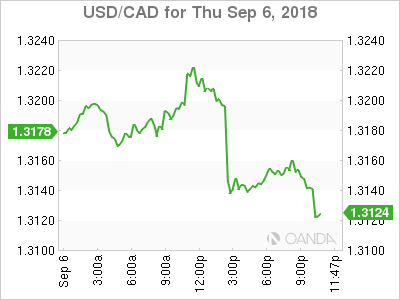
The USD/CAD fell by 0.18 percent and is trading at 1.3153 with the BoC keeping its eye on inflation. Higher interest rates are need to achieve the CB’s target and Wilkins mentioned that sometimes trade protectionism could stoke inflationary pressures if consumer prices go higher.
Big issues remain on the table for the US and Canada and an instant negotiation was always a long shot. The deal struck by the US and Mexico took advantage of a Mexican presidential aftermath that eased negotiations to reach a bilateral deal.
Oil Drops after Trade Tensions trigger Demand Concerns
Oil prices fell on Thursday due to trade tensions escalating and putting downward pressure on global energy demand going forward. Crude fell despite a larger than expected drawdown of US weekly inventories of 4.3 million barrels as a rise in gasoline and distillates seem to point to appetite for crude ahead of the end of driving season.
The lagging crude stock data was less relevant to investors than the current trade disputes that have a negative impact on future demand for energy.
A quick agreement on NAFTA 2.0 remains elusive as Canada and the United States still have to work on big issues, which could delay the expansion of the bilateral agreement between the US and Mexico to include Canada.
The threat of a new round of tariffs on Chinese goods looms over the market. The Trump administration has toughened its stance on Chinese goods, with a $200 billion round of tariffs waiting in the wings. China is expected to retaliate escalating the trade war between the two economies and dragging down global growth forecasts.
Gold Rises on US dollar Softness
Gold rose above the $1,200 price level taking advantage of US dollar weakness. The yellow metal appreciated but faces a quick correction if US jobs data, inflation in particular comes in near or above target. The U.S. Federal Reserve has hiked two times in 2018 and is on course to lift rates twice more.
The CME FedWatch tool has the probability of the Fed funds rate reaching the 200 to 225 basis points at 99 percent. Trade tensions have had a mixed impact on the dollar with the Trump administration opening new fronts in the global trade war on a daily basis.
US fundamental data has been solid with the ISM non-manufacturing data adding to the case for further tightening from the Fed.
Market events to watch this week:
Friday, September 7
8:30am CAD Employment Change
8:30am CAD Unemployment Rate
8:30am USD Average Hourly Earnings m/m
8:30am USD Non-Farm Employment Change
8:30am USD Unemployment Rate
Eco Data 9/7/18
[php_everywhere instance="1"]
Mid-US Update: Canadian Dollar in steep selloff, Yen and Swiss Franc strong
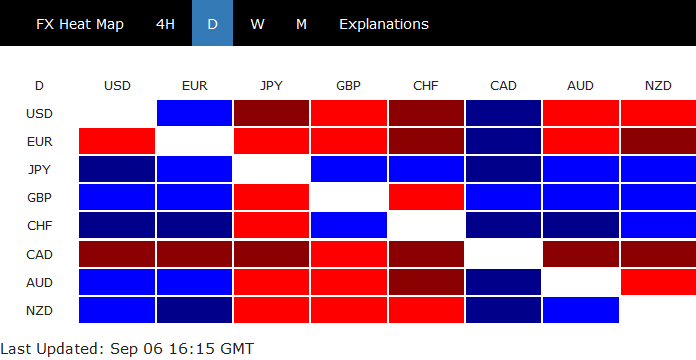
Canadian Dollar suffers heavy selling in first half of US session. There is no apparent trigger for the selloff, yet it's apparent that it's pessimism on trade talk with the US. Euro follows as the second weakest while Dollar is the third. These three are on the weaker side the whole day.
On the other hand, Yen and Swiss Franc are the strongest ones, with help from risk aversion.
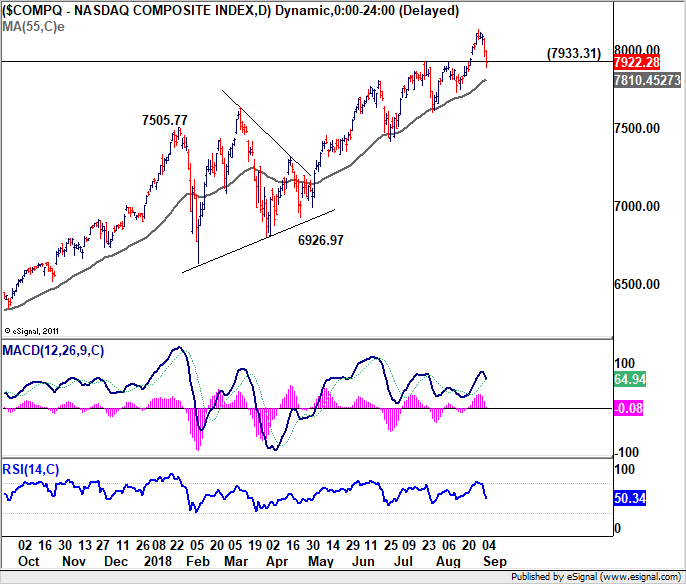
So far, weakness in DOW and S&P 500 is limited. But NASDAQ does suffer heavy selling. With 7933.31 resistance turned support taken out, NASDAQ is now likely heading back to 55 day EMA at 7810.
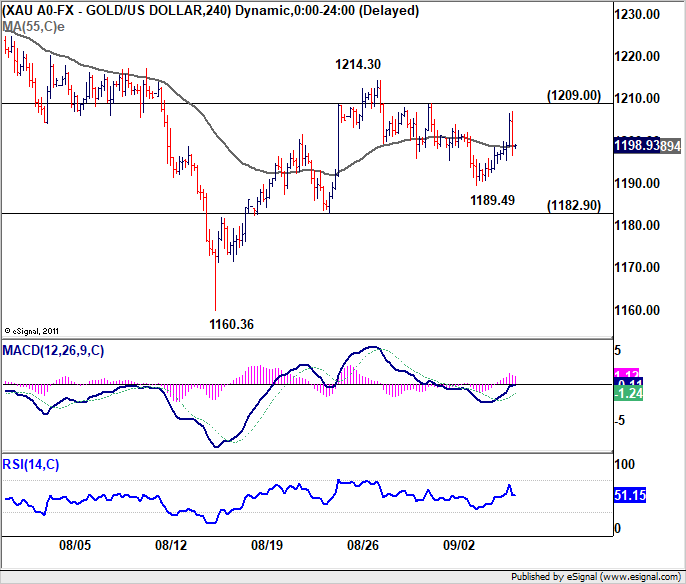
Major European indices also ended all in red today. FTSE was down -0.87%, DAX down -0.71% and CAC down -0.31%. WTI crude oil follows other commodities lower and is back at 67.2. It still cannot get a firm grip of 70 handle. Gold hit as high as 1207 earlier today but it's back below 1200. Gold is not ready to resume the rebound from 1160 yet.
Will the Fed’s Balance Sheet Ever Return to “Normal”? Part II
Executive Summary
In part I of this two-part series, we estimated that the size of the Fed's balance sheet would shrink to about $3.7 trillion or so by late 2019/early 2020 before it again begins to grow organically. Treasury securities and mortgage-backed securities (MBS) comprise the vast majority of the Fed's assets. Because Fed officials have expressed their desire to eventually wind down their holdings of MBS entirely, the Fed will need to hold sizable amounts of U.S. government bonds on the asset side of its balance sheet. We forecast that yields on Treasury securities will rise in coming quarters as the Federal Reserve hikes the fed funds rate further and as Treasury issuance continues to increase. However, sizable holdings of Treasury securities by the Fed means that the level of the yield curve likely will be lower than it would be if the Fed's balance sheet were toshrink back to more historic norms.
The Fed will also need to make some decisions about the composition of its holdings of U.S. government bonds. The weighted-average maturity of the Fed's portfolio of Treasury securities has risen significantly in recent years, and we argue that there would be some advantage to shortening the maturity profile of the portfolio going forward. If the Fed were to pursue this strategy, then there would be some steepening pressure on the curve, everything else equal. That said, the ultimate strategy that the Fed pursues regarding the maturity profile of its portfolio still appears to be a work in progress. Stay tuned.
The Pace of Asset Reductions on the Fed's Balance Sheet
The Fed's balance sheet currently stands at $4.2 trillion, down from roughly $4.5 trillion in Q4-2017 when the central bank began reducing its asset holdings. Starting October 1, 2018, the Fed will allow a maximum of $30 billion a month in Treasury securities and $20 billion a month in MBS to roll off its balance sheet. Projecting the pace of redemptions of U.S. government bonds is fairly straightforward, as the maturity schedule is known in advance.
Determining the pace of MBS redemptions is a bit more complicated, however. The pace of MBS prepayments is influenced by a variety of factors, such as refinancing rates and rates at which mortgages are prematurely repaid as homeowners sell their houses and move. Using the maturity profile of the Fed's Treasury holdings and projections made by the residential MBS research team at Wells Fargo Securities, we arrive at quarterly projections for the asset side of the balance sheet seen in Figure 1.
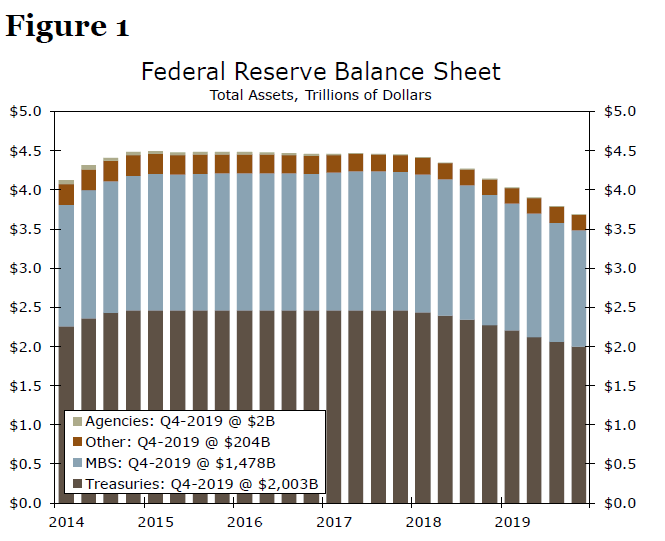
Under our baseline scenario, the size of the Fed's balance sheet bottoms out just below $3.7 trillion in late 2019/early 2020, with approximately $2.0 trillion worth of Treasury securities and about $1.5 trillion in MBS holdings. These holdings would correspond to a decline of about $500 billion in the Fed's portfolio of U.S. government bonds and $300 billion in MBS over a two-year period.
In part I, we discussed the risks to our forecast stemming from the liability side of the Fed's balance sheet. On the asset side, the biggest risk is that MBS redemptions will not evolve as we expect. This can happen for a variety of reasons, with the most likely unknown involving the path of long-term interest rates. When long-term interest rates rise, homeowners have less of an incentive to refinance their home, all else equal, while falling long-term rates encourage refinancing. A sharp upward move in mortgage rates could slow down MBS redemptions, which would drag the unwinding of the balance sheet further into 2020.
Conversely, a decline in mortgage rates would speed up MBS redemptions, which could bring balance sheet shrinkage to a halt a bit earlier than we expect. In our view, the risks to our baseline projection are tilted toward the scenario of rising rates/slower redemptions/slower balance sheet shrinkage. Numerous catalysts could drive long-term interest rates higher. Two particularly potent factors are the surging U.S. budget deficit and the end of quantitative easing in Europe. Unless the U.S. economy were to fall into recession, a marked decline in mortgage rates does not appear to be in the cards anytime soon.
The bottom line is that the size of the Fed's balance sheet will likely remain elevated, at least relative to the pre-crisis period, for some time. A notable implication of this analysis is that sizable holdings of Treasury securities by the Federal Reserve should keep the level of the yield curve lower than otherwise would be the case, although we do forecast that Treasury yields will trend modestly higher in coming quarters. 2
What Are the Implications for the Shape of the Yield Curve?
Once the shrinkage of the balance sheet comes to an end, the assets of the Federal Reserve will begin growing again in-line with the organic growth of its liabilities, such as currency in circulation. However, the market implications of Fed balance sheet policy do not simply go away once the shrinking of the balance sheet comes to an end. In some ways, they become even more interesting. Not only will Fed policymakers need to debate the terminal size of the balance sheet in the coming months, they must also weigh its composition.
Perhaps first and foremost will be how to handle the Fed's still sizable MBS holdings. In September 2014, the Fed outlined its policy normalization principles and plans whereby the Fed cited a desire to "in the longer run…hold primarily Treasury securities, thereby minimizing the effect of Federal Reserve holdings on the allocation of credit across sectors."3 One option for the Fed is to continue allowing its MBS holdings to roll off while replacing them with Treasury securities. The overall effect on the balance sheet would be neutral. While the exact size and scope of such of a plan is up for debate, a program along these lines would allow the Fed to gradually exit the private credit market over time. For our Treasury yield forecast, this would imply some additional demand not currently baked into our forecast.
Where exactly would lower yields show up on the Treasury curve? This leads us to our second point, which is that as the Fed starts buying again, the central bank will need to decide where along the curve to purchase. In the pre-crisis era, the Fed's holdings were predominantly concentrated in the front end and middle parts of the curve. For example, T-bills accounted for 33% of the Fed's overall holdings of Treasury securities in December 2007 (Figure 2). Today, the Fed does not own any T-bills, and the weighted average maturity (WAM) of the Fed's holdings of U.S. government bonds has risen to just under eight years.
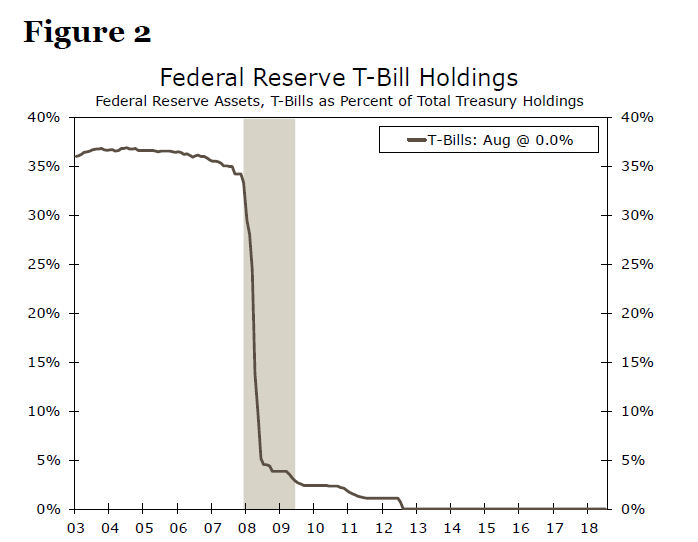
Shortening the WAM of the Fed's holdings of Treasury securities would have a few advantages. First, it would reduce the interest rate risk on the Fed's balance sheet, a topic we covered in a special report from February 2016 that is available upon request. Moreover, buying more T-bills would move the Fed back towards maintaining a portfolio that more closely mirrors the mix of securities in the overall Treasury market.
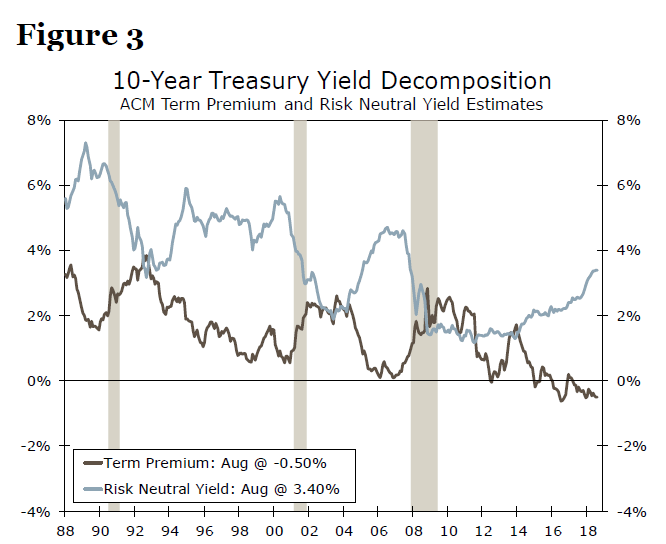
Second, shortening the maturity profile would offset some of the flattening pressure induced by a terminally large Fed balance sheet. Perhaps the most surprising development since the Fed began unwinding its balance sheet has been the stubbornly low term premium. The 10-year U.S. Treasury yield has risen about 55 bps since October 1, 2017, but most benchmark estimates of the term premium have subsequently fallen despite faster economic growth, inflation and Treasury issuance (Figure 3). Conversely, short-term interest rates have risen dramatically amid steady hikes from the FOMC and a deluge of T-bill issuance this year. A steeper yield curve would help to bolster bank profitability, everything else equal, which would improve the resiliency of the banking system to financial shocks.
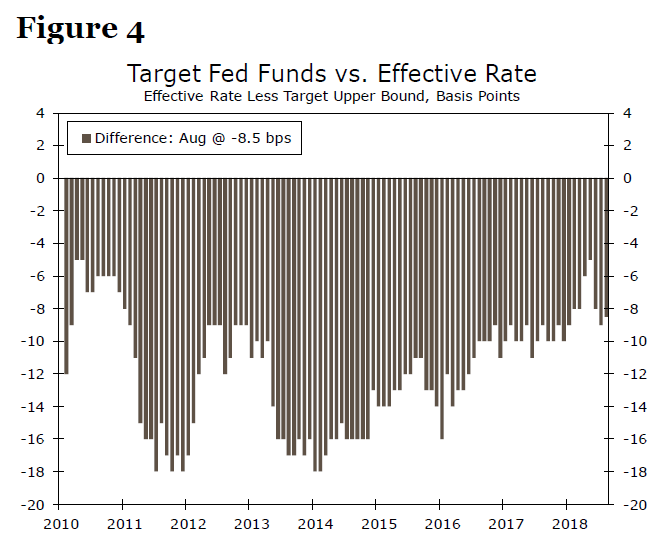
Third, a shorter maturity profile could also improve the functioning of monetary policy. The aforementioned surge in T-bill issuance this year has led to a marked rise in T-bill yields. The rise in T-bill yields relative to the interest rate that the Fed pays on excess reserves has encouraged some banks to switch into T-bills. Consequently, the effective fed funds rate has been moving closer to the top of 25 bps target range (Figure 4). T-bill purchases by the Fed could help to push the effective fed funds rate back toward the center of the band.
It is important to bear in mind that a hefty volume of securities is slated to roll off the Fed's balance sheet by the end of 2019. According to our projections, another $34o billion in Treasury securities and $235 billion or so in MBS will come off between now and the end of 2019. These sizable reductions, coupled with the rise in the federal budget deficit we expect in FY-2019, should exert some upward pressure on the term premium and, consequently, on long-term bond yields over the next year. That said, the sheer amount of Treasury securities that the Fed will continue to hold on its balance sheet should keep the overall level of U.S. government bond yields lower than they otherwise would be.
Conclusion
In Part I of this series, we estimated that the size of the Fed's balance sheet will shrink from roughly $4.2 trillion at present to only $3.7 trillion or so by late 2019/early 2020 before it starts to grow organically again. As noted above, Fed policymakers have indicated their desire to eventually wind down their holdings of MBS completely. Consequently, the Fed will end up holding trillions of dollars of Treasury securities on its balance sheet. We forecast that yields on U.S. government bonds will rise in coming quarters as the Fed hikes the fed funds rate further and as Treasury issuance continues to increase. However, sizable holdings of Treasury securities on the Fed's balance sheet means that the level of the yield curve likely will be lower than it would be otherwise.
The implications of the Fed's portfolio management strategy for yield curve shape are more uncertain. We have outlined a few reasons why we think that the Fed may want to shorten its maturity profile, which would induce some steepening pressure. However, the Fed may determine that there are more compelling reasons to maintain a relatively long-dated portfolio. To the best of our knowledge, Fed officials have not yet determined their portfolio strategy once the balance sheet shrinkage comes to an end, and discussions within the Federal Reserve System undoubtedly are ongoing. As we receive more guidance from the Fed and conditions continue to develop, we will update our forecasts accordingly.
1 We thank Michael Schumacher, Head of Rate Strategy for Wells Fargo Securities, for helpful comments and suggestions.
2 We look for the yield on the 10-year Treasury security to rise to 3.60% by the end of 2019. See our Monthly Economic Outlook, which is posted on our website, for details. A yield of 3.60%, if realized, would be the highest yield on the 10-year Treasury security since early 2011. That said, a yield of 3.60% is still low by historical standards, especially in an environment of $1 trillion federal government budget deficits.
3 FOMC Communications related to Policy Normalization
Canadian Dollar Lower as Trade Comments Spark Volatility on NAFTA Pairs
The Canadian dollar and the Mexican peso have seen prices fluctuate widely after the NAFTA 2.0 agreement will most likely not be struck this week. Although the mood remains optimistic from both sides with Canadian Foreign Minister Freeland saying they are making good progress the timeline is now looking to extend for a month.
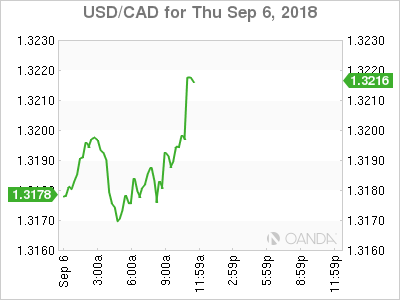
Big issues remain on the table for the US and Canada and an instant negotiation was always a long shot. The deal struck by the US and Mexico took advantage of a Mexican presidential aftermath that eased negotiations to reach a bilateral deal. Mexico and Canada remain committed to a trilateral NAFTA agreement. Comments from President Donald Trump about a short deadline for NAFTA and rebuking China’s trade talks has once again put pressure on the CAD and the MXN.
Mexican officials said today that NAFTA will not be an agreement until Canada signs on. Economy Minister Guajardo has pushed for Canada to rejoin the talks and eventually enter into the same agreement it now has with the US.
The loonie rose as positive comments hit the wires. Trade negotiations between the US and Canada have had their fair share of finger pointing, but so far they have agreed to keep comments to the press to a minimum which has helped keep the deal on the table.
Market reaction has been mixed as while the deal struck between US and Mexico was a positive for global trade, the US has toughen its stance on Chinese goods, with a new round of tariffs waiting in the wings. China is expected to retaliate escalating the trade war between the two economies and dragging down global growth forecasts.
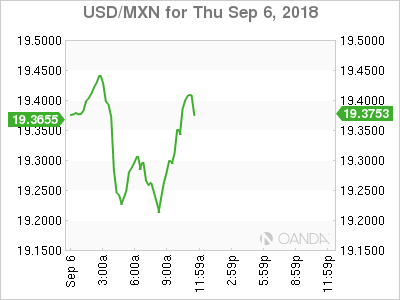
The Mexican peso is extremely sensitive to NAFTA news as the agreement between US-Mexico has shielded the currency from most of the negative effects of the emerging market contagion. A flight to safety has investors buying the big dollar as they liquidate their peso denominated assets.
U.S. Non-Manufacturing Activity Rebounds in August
The Institute for Supply Management's (ISM) non-manufacturing index came in at 58.5 for August, rising by 2.8 points and easily cruising past consensus expectations for a more moderate 56.8.
The details of the report were largely positive, adding credence to the view that the U.S. economy is still at the top of its game. Seven of the ten sub-components were up on the month. Of note were business activity (+4.2 to 60.7), new orders (+3.4 to 60.4) and supplier deliveries (+3.0 to 56.0).
The prices paid index is still firmly in expansion territory (62.8), but the rate of price growth decelerated slightly (-0.6). The employment index was up marginally (+0.6 to 56.7) as tight labor market appears to be a limiting factor for the pace of employment growth.
Trade-related subcomponents were mixed. New export orders regained the ground conceded last month (+2.5 to 60.5), while imports edged down (-0.5 to 52.0).
Survey respondents continued to express optimism about the economic and business outlook, even while some remained apprehensive regarding logistical difficulties, trade wars and a dearth of available labor.
Key Implications
After dipping in July, the ISM non-manufacturing index has again picked up speed and continues on its upward trajectory, akin to the path of its manufacturing equivalent. With 16 out of the 17 industries surveyed reporting stronger business, the US services sector is showing broad-based healthy growth.
Despite the generally upbeat outlook, non-manufacturing firms still face headwinds ranging from labor shortages to uncertainty stemming from tariffs and threats of tariffs. All in all, most respondents were positive, with their companies well-positioned to weather the storm, which is set to continue as the economy grapples with full employment and rising interest rates.
Canadian Dollar Dips Despite Strong Construction Report
The Canadian dollar has ticked lower in the Thursday session. Currently, USD/CAD is trading at 1.3214, up 0.27% on the day. On the release front, Canadian Building Permits jumped 1.1%, crushing the estimate of -0.1%. In the U.S, unemployment claims dropped to 203 thousand, beating the estimate of 214 thousand. However, ADP Nonfarm Payrolls disappointed with a reading of 163 thousand. This was well below the forecast of 195 thousand. In the services sector, ISM Non-Manufacturing PMI climbed to 58.5, above the estimate of 56.8 points. On Friday, the focus will be on employment indicators on both sides of the border. Canada releases Employment Change, while the U.S will release three key employment indicators – nonfarm payrolls, wage growth and the unemployment rate.
There were no surprises as the Bank of Canada stayed on the sidelines and maintained the benchmark rate at 1.50%. The Bank raised rates by a quarter-point in July, and has hiked rates four times since last summer. The Bank stated in its rate announcement that policymakers would be “monitoring closely the course of the NAFTA negotiations and other trade policy developments, and their impact on the inflation outlook”. With the Canadian economy performing well and the Fed likely raising rates later this month, there is pressure on the BoC to again raise rates in 2018. However, concerns over NAFTA and global trade tensions have won the day for now, as the BoC took a pass on a rate hike.
The Canadian dollar continues to struggle, having lost 2.2% since August 30. Concerns over the NAFTA talks are weighing heavily on the Canadian dollar. Canada and the U.S have already exchanged tariffs on each other’s products, and Canadian and U.S negotiators are trying to hammer out a trade deal, after a deadline last Friday was missed. In order to reach a new trade agreement with the U.S, Canada will likely have to make some concessions, such as reducing hefty tariffs which protect the Canadian dairy industry. Prime Minister Justin Trudeau has said that no deal is better than a bad deal, but it’s clear that Canada can ill-afford to remain the odd man out, with some 75% of Canadian exports destined for the U.S.
Canadian Jobs Data Due as Loonie Wrestles with NAFTA Worries
Employment data out of Canada will be made public on Friday at 1230 GMT, with forecasts pointing to a cooling in the labor market during August. If so, that could cast further doubts on expectations for a BoC rate increase at the October gathering and thereby, bring the loonie under renewed selling interest. Beyond Friday’s data, the currency’s overall direction will also depend on whether the NAFTA talks between the US and Canada bear fruit soon, or not.
After the Bank of Canada (BoC) kept interest rates unchanged on Wednesday and signaled it’s monitoring the NAFTA negotiations closely – the first time it did so in a policy statement – market participants pared back their bets on a rate increase being delivered at the next meeting in October. Specifically, market-implied odds derived from Canada’s overnight index swaps now suggest only a 60% probability for a hike in October, from 78% prior to the gathering. Therefore, incoming data over the coming weeks will probably play a large role in shaping expectations around how the BoC will act, and thereby in determining the loonie’s forthcoming direction.
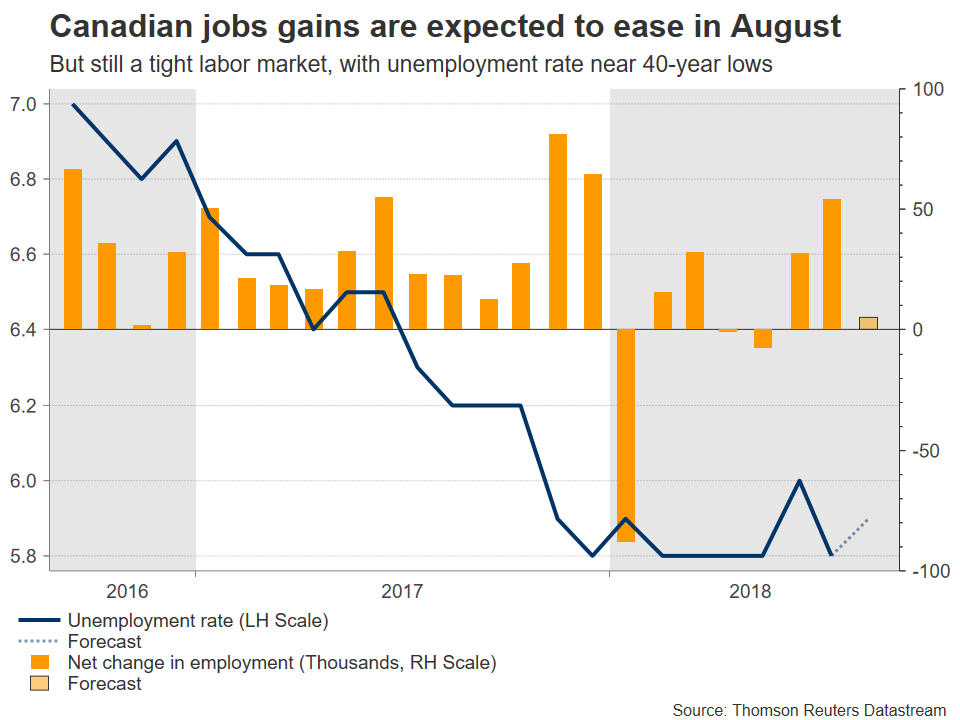
In August, the nation’s unemployment rate is forecast to have risen marginally to 5.9%, from 5.8% previously. The uptick appears to be owed to expectations for flat jobs growth, with the net change in employment projected to clock in at 5.0k – still a positive number, but significantly lower than the 54.1k in July.
Beyond data and monetary policy, the other crucial determinant for the loonie’s fortunes will be how the US-Canada NAFTA negotiations play out. The talks failed to yield results last week, with the main sticking points relating to Canada’s unwillingness to scrap measures supporting its dairy and poultry farmers, and the nation’s insistence to retain a disputes settlement mechanism that was part of the original NAFTA deal.
The negotiations resumed yesterday, and any signs that an agreement is inching closer could diminish some of the NAFTA risk premium on the loonie, potentially triggering a relief bounce. What’s more, such an outcome would likely make the BoC more confident in hiking rates too, as one of the biggest risks surrounding the economy would disappear; of course, the content of any such deal is also important. On the other hand, hints that Canada may prefer to play “hardball” and prolong the talks with an aim to negotiate a more favorable deal, could keep the loonie under pressure as uncertainty lingers.
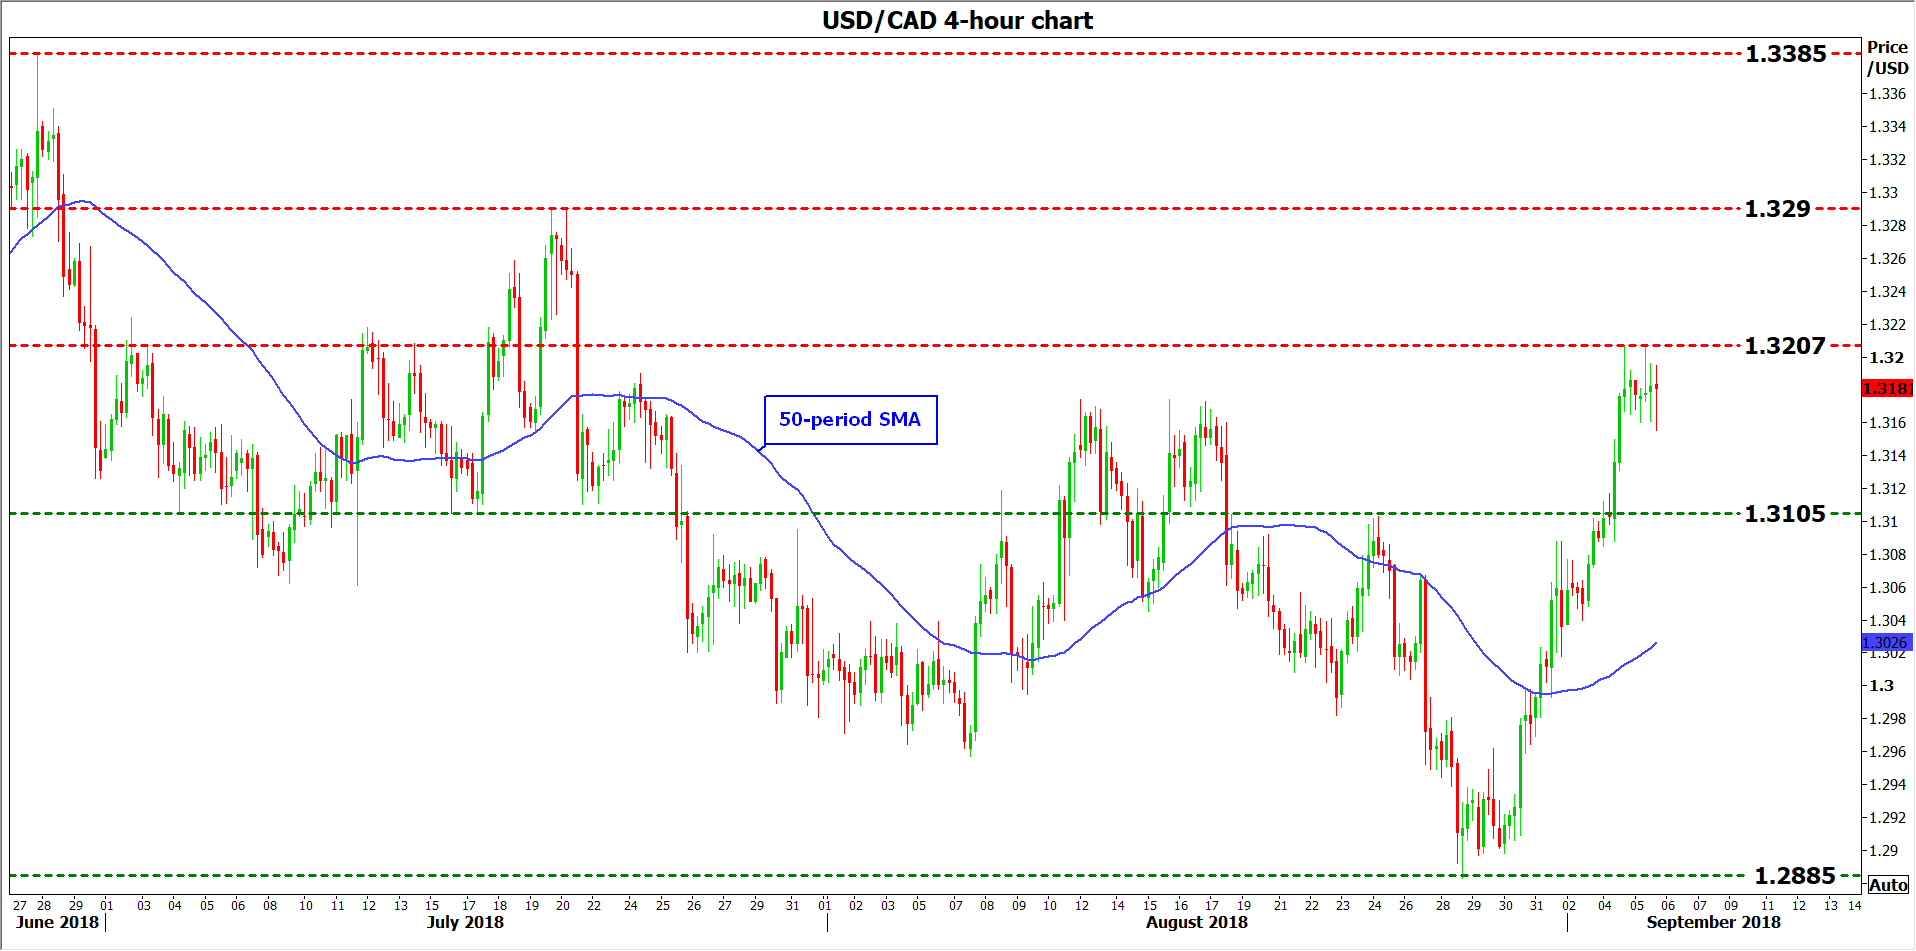
Technically, further advances in dollar/loonie could encounter immediate resistance near 1.3207, the high of September 4. An upside break of that zone could open the way for the July 20 peaks of 1.3290, with even steeper bullish movements eyeing the 14-month high of 1.3385.
On the flipside, a pullback in the pair on the back of encouraging data or a breakthrough in the NAFTA talks, may find initial support around the 1.3105 mark, defined by the top of August 24. If the bears push below it, declines could stall near the 50-period moving average on the 4-hour chart, currently located at 1.3026. Even lower, the three-month low of 1.2855 may attract attention.
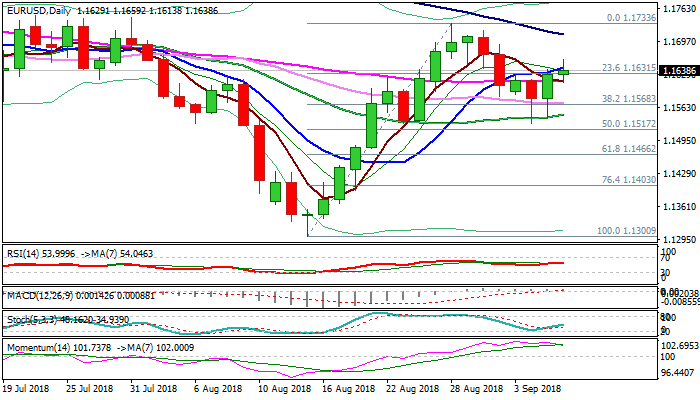
EURUSD Outlook: Euro Holds Slight Bid Tone But Remains Capped Under Thin Daily Cloud
The Euro remains constructive in early US trading but still lacking momentum for retest of Asian high at 1.1659 and attack at daily cloud, which provides strong headwinds despite being very thin. Today's action was so far shaped in long-legged Doji candle, signaling strong indecision, as US jobs data, due on Friday, are eyed for stronger signals. Today's mixed US data provided little action, as jobless claims fell below expectations (203K vs 214K f/c) and ADP report showed private sector created 163K new jobs in Aug vs expectations for 188K. Conflicting daily indicators (MA's are turning into bullish configuration / slow stochastic trends higher, while momentum created bear-cross and heading south), suggest the pair may hold in extended directionless mode, awaiting US jobs data as a catalyst for fresh action. Bullish scenario requires sustained break above daily cloud top (1.1682) and violation of falling 100SMA (1.1711) to signal further advance, while initial negative signal could be expected on break below 55SMA (1.1615) and stronger downside action to be expected on violation of 1.1570/47 (30/20SMA's).
Res: 1.1659; 1.1678; 1.1711; 1.1733
Sup: 1.1615; 1.1600; 1.1570; 1.1547
ISM non-manufacturing rose to 58.5, strong rebound after July cool-off
ISM non-manufacturing composite rose to 58.5 in August, up from 55.7 and beat expectation of 56.9. Business Activity Index rose 4.2 to 50.7. New orders jumped 3.4 to 60.4. Employment index rose 0.6 to 56.7.
ISM noted in the release that "there was a strong rebound for the non-manufacturing sector in August after growth 'cooled off' in July. Logistics, tariffs and employment resources continue to have an impact on many of the respective industries. Overall, the respondents remain positive about business conditions and the economy."