

Sample Category Title
USDJPY Technical Failure Weighs On Price
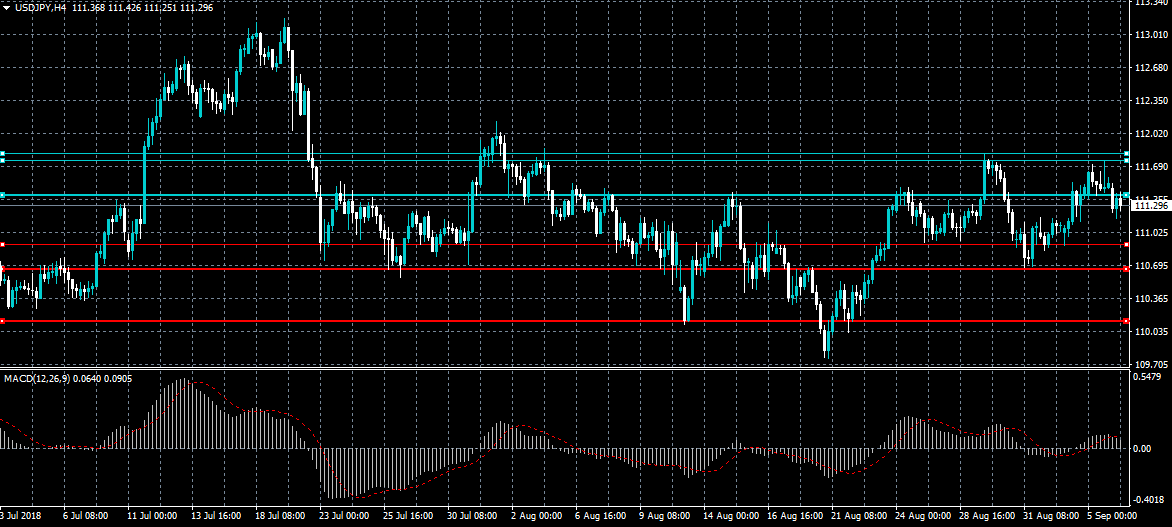
The US dollar is now testing support against the Japanese yen currency, after buyers failed to break above the former weekly trading high, around the 111.80 level. The intraday sentiment towards the USDJPY pair is currently neutral as price hovers are the 111.30 level. Sellers need to break the 110.90 support level to change the short-term sentiment to bearish, while buyers need to break above the 111.80 resistance area.
The USDJPY pair is only bearish while trading below the 110.90 level, key support is found at the 110.68 and 110.10 levels.
If the USDJPY pair breaks above the 111.80 level, buyers will likely test towards the 112.05 and 112.20 resistance levels
EURUSD Looks Past Weak German Data
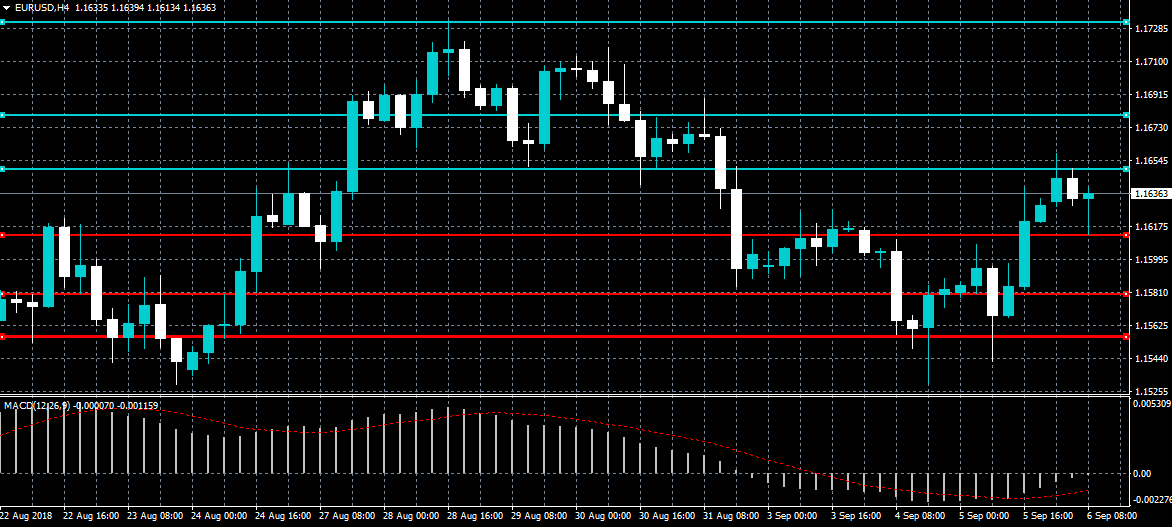
The euro currency continues to trade towards the 1.1650 level against the US dollar, despite much weaker than expected German Factory Orders data this morning. EURUSD buyers are once again attempting to break key resistance, while the MACD indicator across the four-hour time frame is now starting to trend higher. Traders now look to the release of the ADP jobs report from the United States economy.
The EURUSD pair is only bullish while trading above the 1.1650 level, key technical resistance is found at the 1.1681 and 1.1730 levels.
If the EURUSD pair falls below the 1.1610 level, sellers will likely test towards the 1.1580 and 1.1553 support levels.
NZDUSD Eases Above Mid-Level Of Bollinger Band, Looks Strongly Bearish In Medium Term
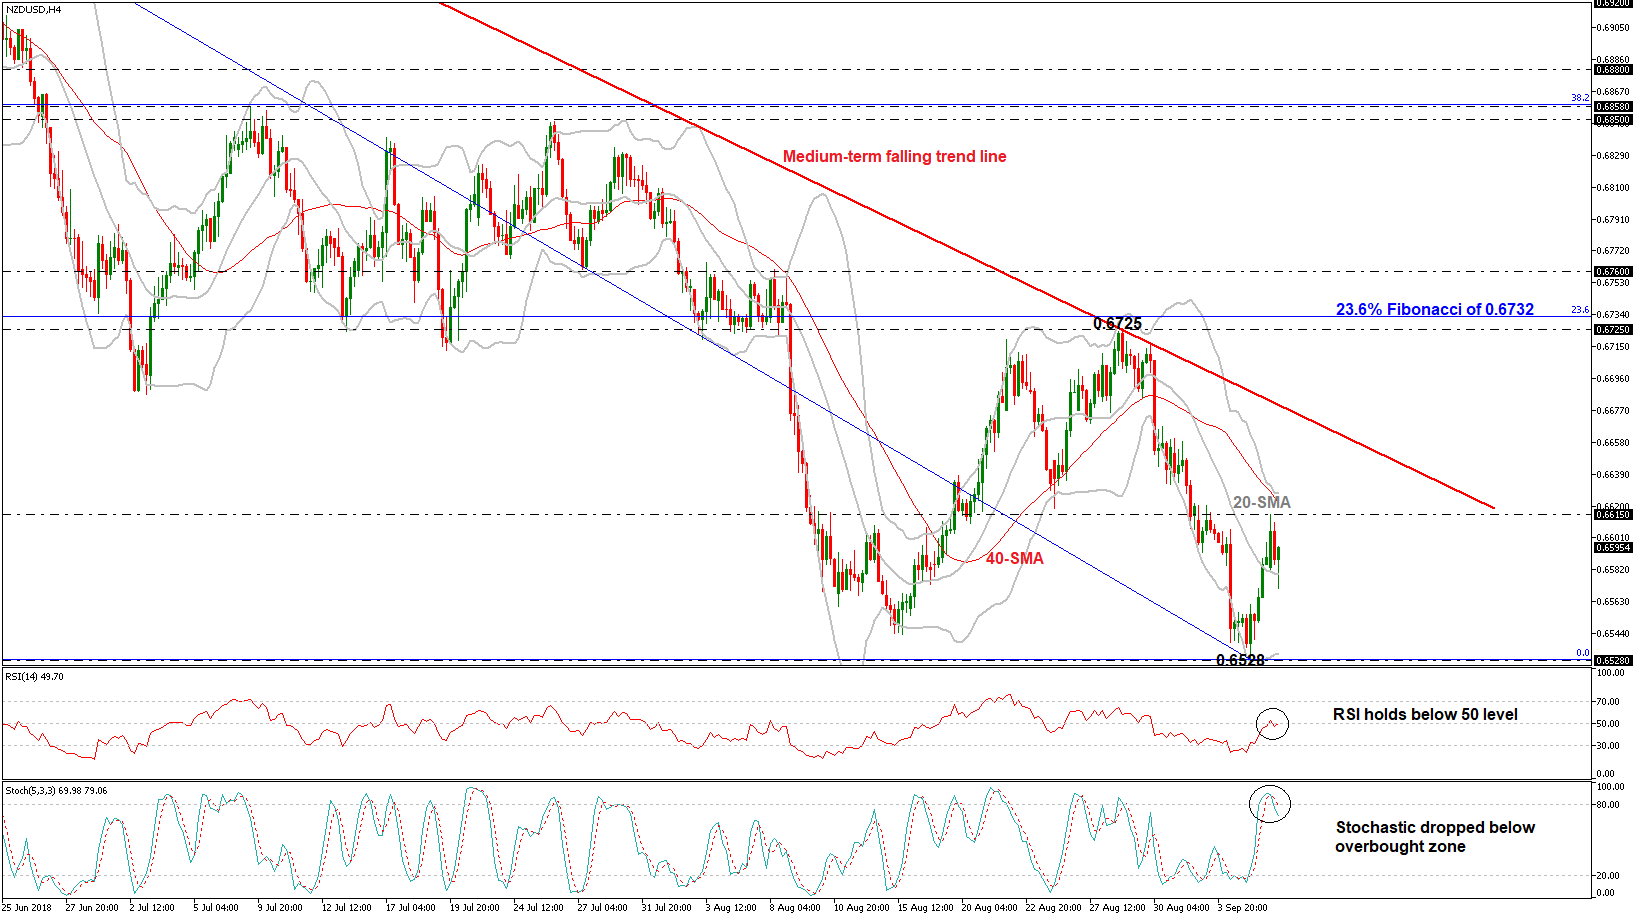
NZDUSD has declined in the previous session in the 4-hour chart but still remains above the mid-level of the Bollinger Band, this being a 20-period simple moving average (SMA). The RSI seems to be stalling its advance below the 50 neutral-perceived level, while the stochastic oscillator is giving a bearish signal in the very short-term as the %K line has crossed below the %D line, with both heading lower.
Should the pair stretch south, Wednesday’s 2½-year low of 0.6528 could provide immediate support before the January 2016 bottom of 0.6345 come into view. The round figures of 0.6500 and 0.6400 may hold psychological importance, providing some support before the aforementioned nadir is eyed.
On the flip side, the 0.6615 resistance barrier which is marginally below the upper Bollinger Band may halt upside movements. In case of a run above, the medium-term descending trend line near 0.6700 could also provide resistance. Such a move would also violate the diagonal line, confirming the start of a bullish correction and could drive the pair until 0.6725 which stands near the 23.6% Fibonacci retracement level of the downleg from 0.7390 to 0.6528.
In the medium-term, NZDUSD has been trading bearish in the past four months after the pullback on the 0.7390 hurdle.
The Analytical Overview Of The Main Currency Pairs
The EUR/USD currency pair
Technical indicators of the currency pair:
Prev Open: 1.15796
Open: 1.16300
% chg. over the last day: +0.46
Day's range: 1.16138 – 1.16592
52 wk range: 1.0571 – 1.2557
During yesterday’s trading session, the bullish sentiment prevailed on the EUR/USD currency pair. At the moment, the quotes are moving in flat. The technical pattern is ambiguous. Investors expect important economic reports from the United States. Local support and resistance levels are 1.16050 and 1.16300, respectively. Positions should be opened from these marks.
The news feed on the US economy on 2018.09.06:
Preliminary data on the labor market from ADP at 15:15 (GMT+3:00);
The volume of industrial orders at 17:00 (GMT+3:00);
The index of economic activity in the non-manufacturing sector from ISM at 17:00 (GMT+3:00).
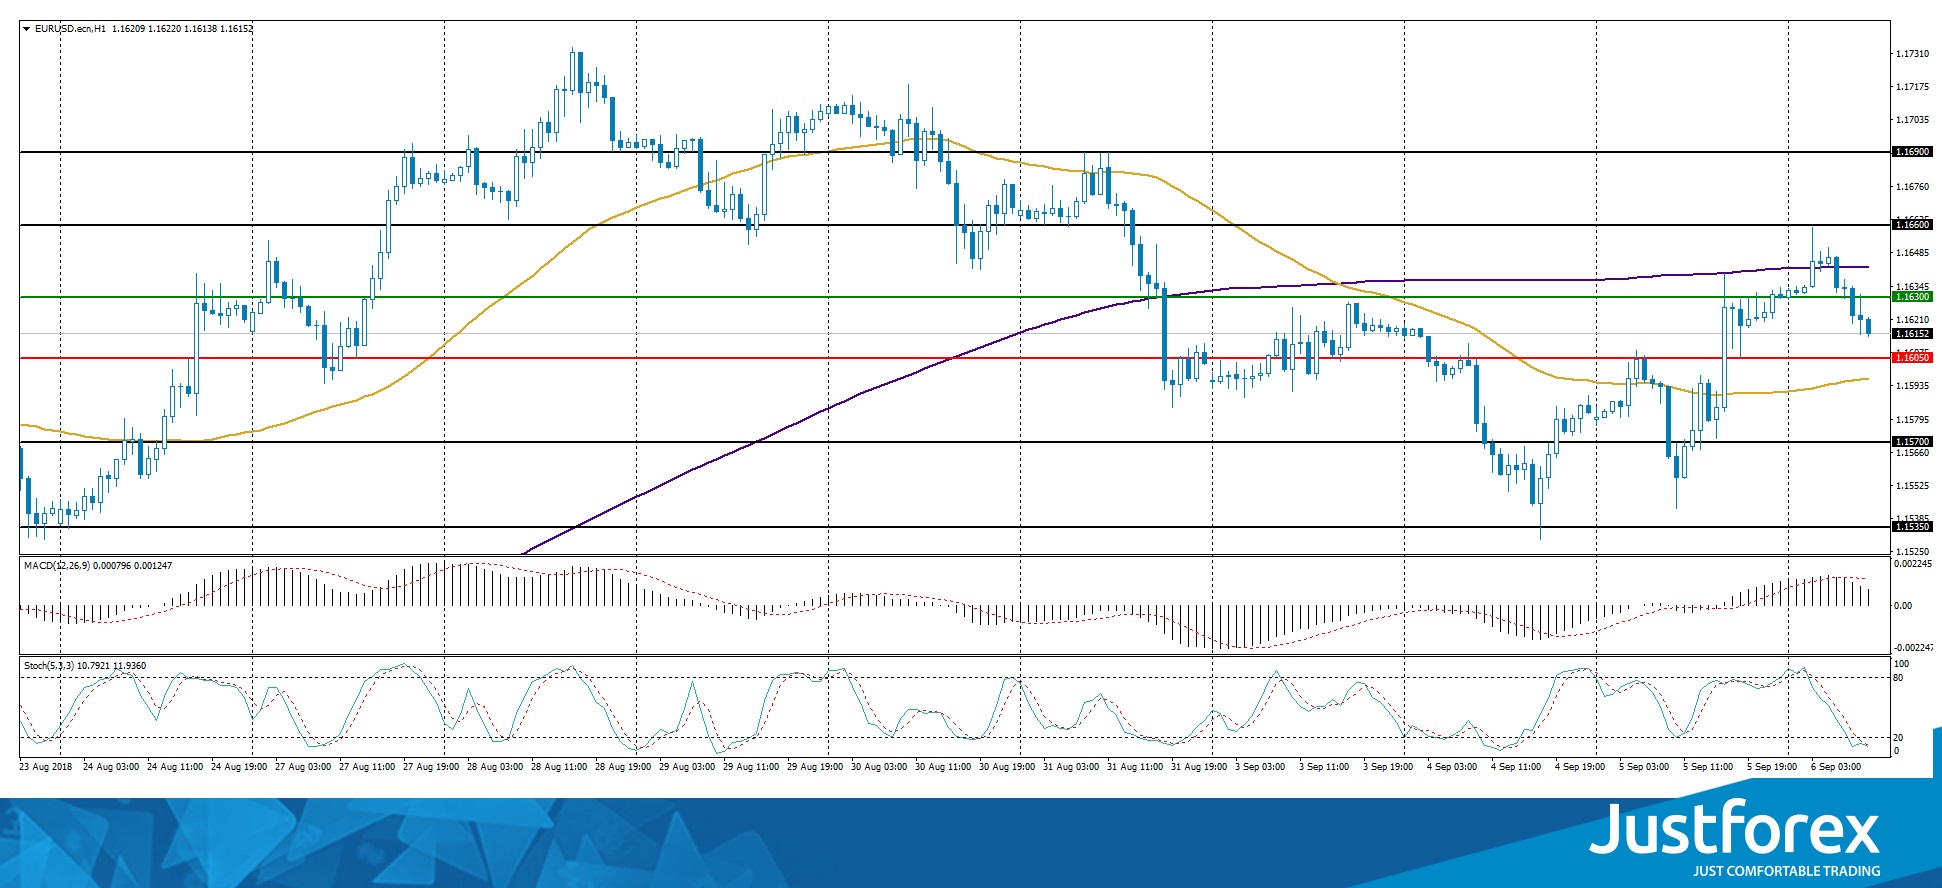
Indicators do not send accurate signals: the price has fixed between 50 MA and 200 MA.
The MACD histogram is in the positive zone, but below the signal line, which gives a weak signal to buy EUR/USD.
Stochastic Oscillator is located in the oversold zone, the %K line has crossed the %D line. There are no signals at the moment.
Trading recommendations
Support levels: 1.16050, 1.15700, 1.15350
Resistance levels: 1.16300, 1.16600, 1.16900
If the price fixes below the local support of 1.16050, the EUR/USD quotes are expected to fall. The movement is tending to 1.15700-1.15400.
Alternative option. If the price fixes above 1.16300, we recommend considering purchases of EUR/USD. The movement is tending to 1.16600-1.16900.
The GBP/USD currency pair
Technical indicators of the currency pair:
Prev Open: 1.28549
Open: 1.29018
% chg. over the last day: +0.45
Day's range: 1.28917 – 1.29288
52 wk range: 1.2361 – 1.4345
Yesterday, aggressive purchases of GBP/USD were observed. Rumors about the progress of the Brexit negotiations supported the UK currency. According to Bloomberg, Great Britain and Germany agreed on the abolition of key mutual requirements for the process of the country's exit from the EU. At the moment, the GBP/USD quotes are consolidating in the range of 1.28950-1.29300. The potential for growth remains. We recommend opening positions from the key levels.
The publication of important economic reports from the UK is not planned.
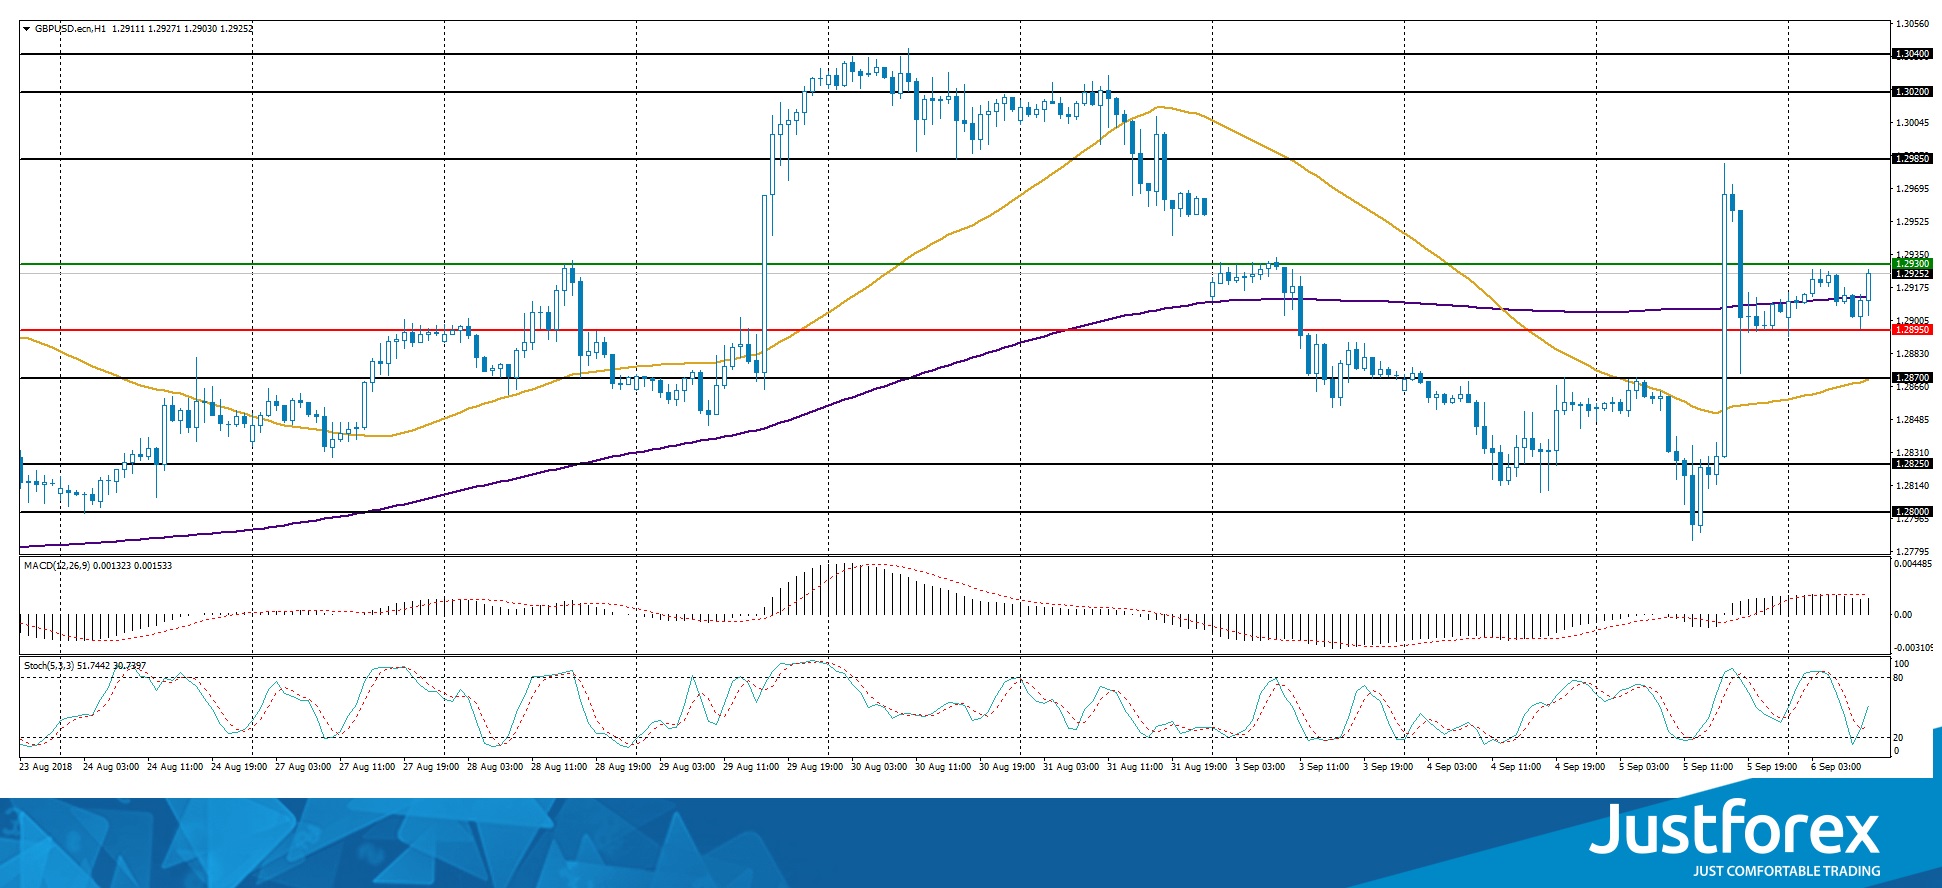
Indicators do not send accurate signals: the price has crossed 50 MA.
The MACD histogram is in the positive zone, but below the signal line, which gives a weak signal to buy GBP/USD.
Stochastic Oscillator is located in the neutral zone, the %K line is above the %D line, which indicates the bullish sentiment.
Trading recommendations
Support levels: 1.28950, 1.28700, 1.28250
Resistance levels: 1.29300, 1.29850, 1.30200
If the price fixes above 1.29300, further growth of the GBP/USD quotes is expected. The movement is tending to 1.29650-1.30000.
Alternative option. If the price fixes below the local support of 1.28950, we recommend considering sales of GBP/USD. The movement is tending to 1.28700-1.28500.
The USD/CAD currency pair
Technical indicators of the currency pair:
Prev Open: 1.31762
Open: 1.31760
% chg. over the last day: -0.10
Day's range: 1.31639 – 1.31992
52 wk range: 1.2059 – 1.3795
The Bank of Canada, as expected, kept the key interest rate at the previous level of 1.50%. At the moment, the technical pattern on the USD/CAD currency pair is ambiguous. Quotes are in a sideways trend. The key trading range is 1.31600-1.32000. Financial market participants expect new information regarding the NAFTA negotiations. Positions should be opened from the key levels.
The news feed on the economy of Canada is quite calm.
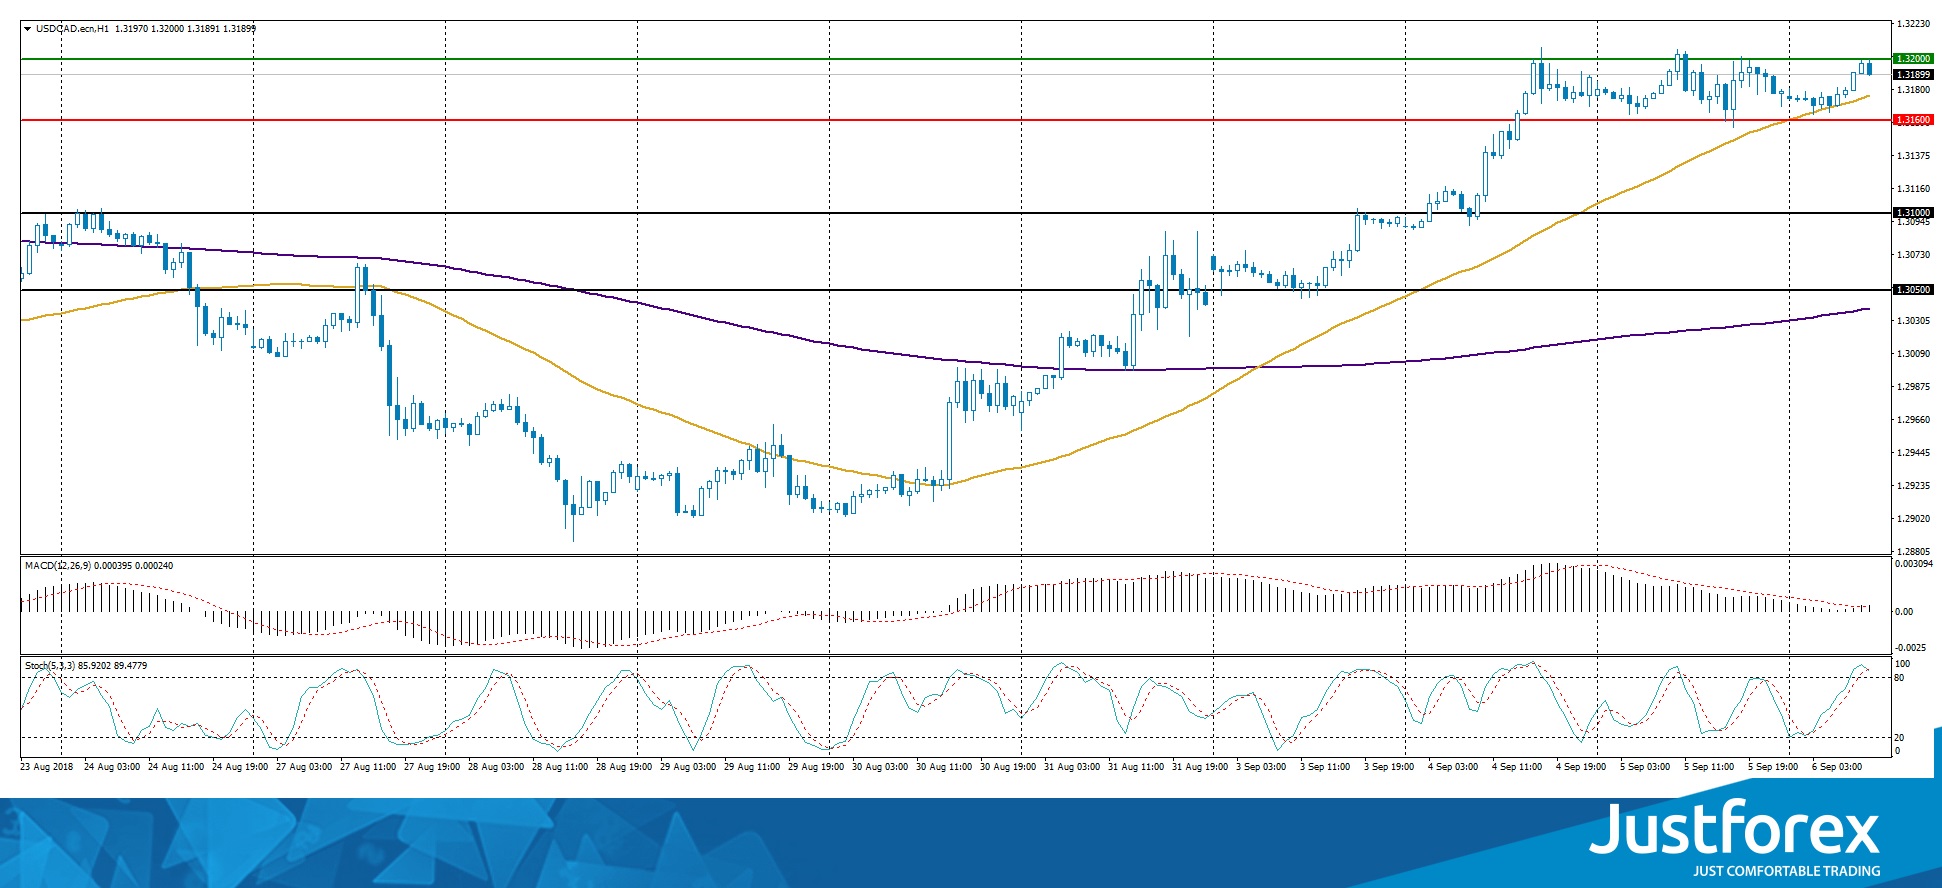
The price has fixed above 50 MA and 200 MA, which signals the power of buyers.
The MACD histogram is in the positive zone and continues to rise, which also signals to buy USD/CAD.
Stochastic Oscillator reached the overbought zone, the %K line is crossing the %D line. There are no signals at the moment.
Trading recommendations
Support levels: 1.31600, 1.31000, 1.30500
Resistance levels: 1.32000, 1.32500
If the price fixes above the round level of 1.32000, further growth of the USD/CAD currency pair is expected. The movement is tending to 1.32400-1.32600.
Alternative option. If the price fixes below the local support of 1.31600, the USD/CAD quotes are expected to correct. The target level for profit-taking is 1.31300-1.31000.
The USD/JPY currency pair
Technical indicators of the currency pair:
Prev Open: 111.313
Open: 111.528
% chg. over the last day: +0.03
Day's range: 111.171 – 111.528
52 wk range: 104.56 – 114.74
The technical pattern on the USD/JPY currency pair is still ambiguous. Quotes are consolidating. The trading instrument is testing local support and resistance levels: 111.250 and 111.450, respectively. Investors expect important economic reports from the United States. We recommend following the current information on the trade conflict between the US and China. Positions should be opened from the key levels.
The news feed on the economy of Japan is calm.
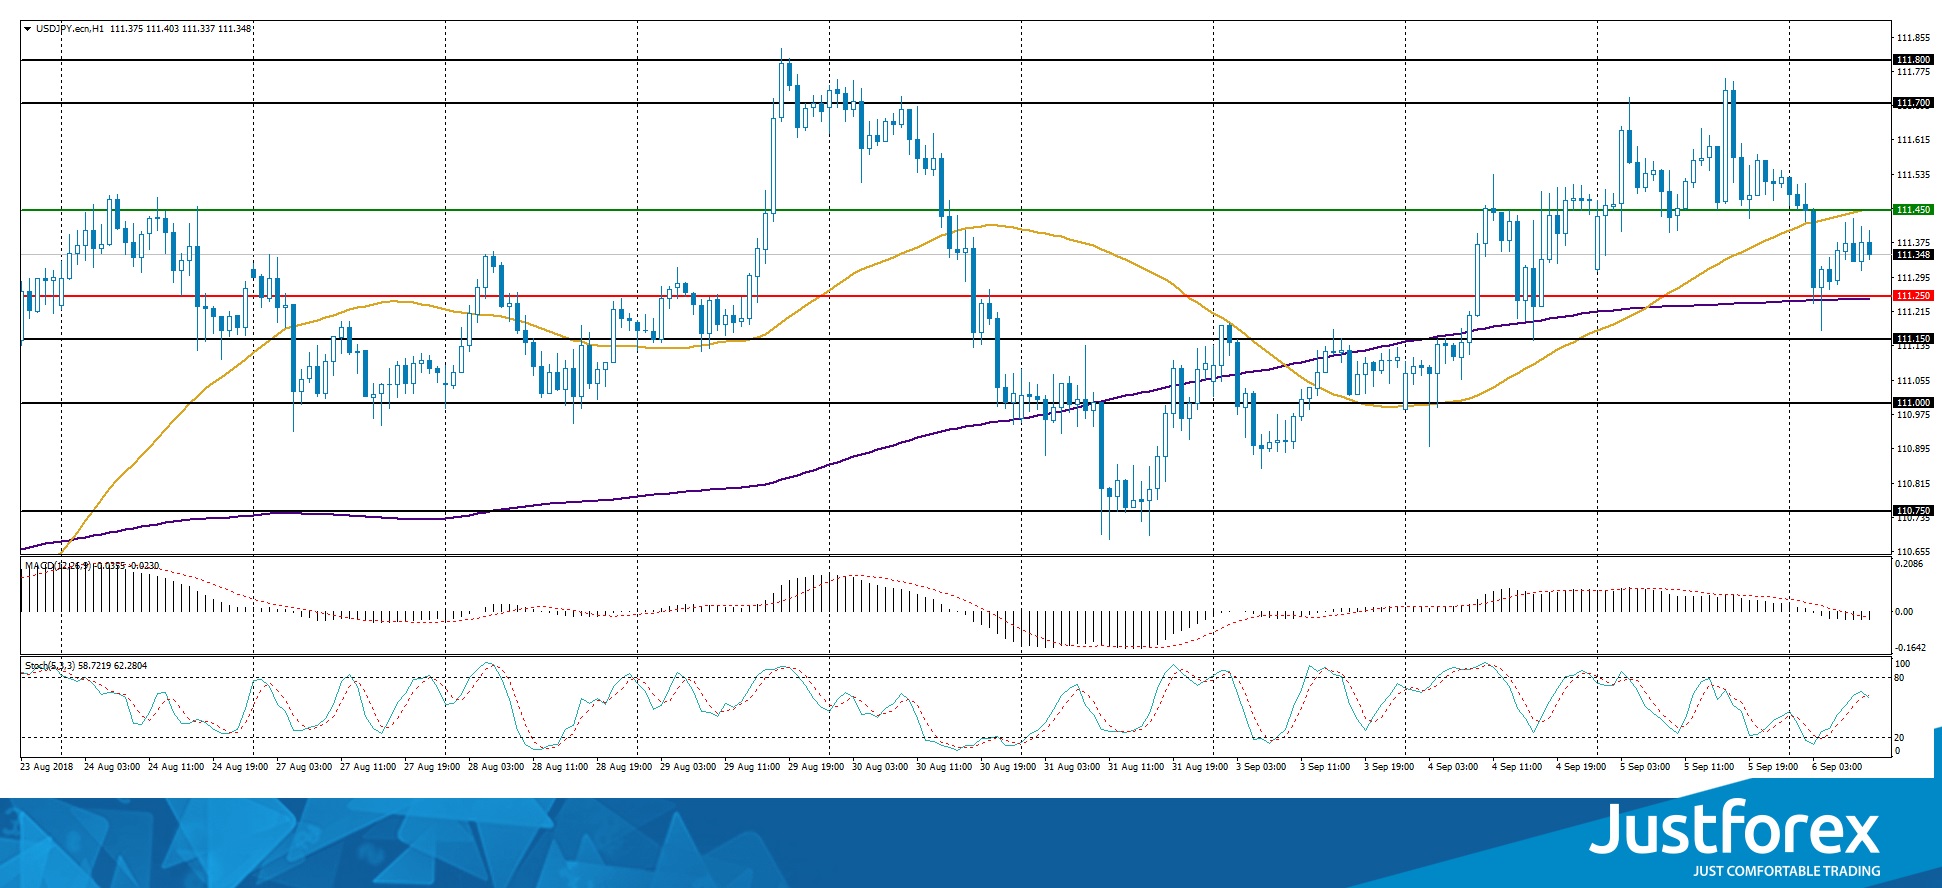
The price has fixed between 50 MA and 200 MA, which are strong dynamic support and resistance levels.
The MACD histogram has moved into the negative zone, which signals the bearish sentiment.
Stochastic Oscillator is located in the neutral zone, the %K line is crossing the %D line. There are no signals at the moment.
Trading recommendations
Support levels: 111.250, 111.000, 110.750
Resistance levels: 111.450, 111.700, 112.000
If the price fixes above the resistance level of 111.450, the USD/JPY currency pair is expected to grow. The movement is tending to 111.700-112.000.
Alternative option. If the price fixes below the level of 111.250, it is necessary to consider sales of USD/JPY. The movement is tending to 111.000-110.750.
Crypto Crisis!
Cryptos in free-fall
Cryptocurrencies faced another sharp sell-off this week, with Bitcoin dropping from $7,370 to $6,420 in less 24 hours. The entire market was dragged in negative territory as optimism about positive development in the legal environment for cryptos. The total market capitalisation slid to $202bn, down $37bn in the last day. Ethereum also fell off a cliff as it hit $210 this morning, the lowest level since September last year.
Investors' optimism continues to fade away as regulators persist to refuse Bitcoin a legitimate status. Persistent uncertainties in the regulatory environment have convinced Goldman Sachs to reduce its level of ambitions regarding the creation of a crypo exchange. The bank has not closed the door but is readjusting its scope.
From a technical standpoint, the top of the multi-month downtrend channel continues to act as a strong resistance (currently around the $7,500 level), while on the downside, the $5,600-$5,700 support area is still holding. In the short-term, we expect Bitcoin to continue grinding toward the $6,000 level before bouncing back toward the $7,500 resistance.
Swiss economy robust, but threats loom
Switzerland's economy is on the rise and appears unaffected by geopolitics. GDP is up 3.4% annually, a pace not seen in the last 8 years! The quarterly GDP advance of 0.7% remains above average (0.4%) for the fifth consecutive time. Key contributors are manufacturing and energy, which benefited from exports and a favourable exchange rate. The CHF has depreciated against the Euro, from 1.09 in September 2015 to 1.13 now, a boost for Switzerland's export-oriented businesses.
However, the trend is turning. Risks include Turkey's plunging lira, Italy's budget deficit and US duties on EU auto imports. The Swiss National Bank expects GDP growth to slow to 2% by the end of the year (still, a rate not seen since 2014). With solid growth and a strong franc, the SNB is not expected to raise interest rates any time soon. Currently trading along 1.1282. EUR/CHF is declining further, heading to 1.1265 in the short-term
WTI Oil Outlook: Oil Stands At The Back Foot And Looks For Fresh Signals From Crude Inventories Report
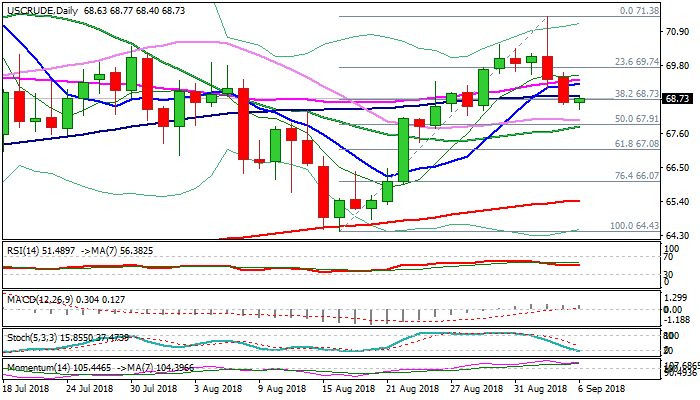
WTI oil is holding within tight consolidation in early Thursday's trading after strong two-day fall. Oil prices came under pressure on increasing turbulence in emerging markets and concerns about the trade conflict between the US and China, but stronger negative impact was offset by supply concerns over sanctions on Iran and unexpected draw in US crude stocks (API report showed 1.2 million barrels draw vs previous week's build of 0.03 million barrels.
Wednesday's break and below a cluster of daily MA's (55/10/100) between $69.35 and $68.83, as well as close below $68.73 (Fibo 38.2% of $64.43/$71.38 upleg) was bearish signal, which requires confirmation on repeated close below.
However, overall picture remains bullish and current pullback could be seen as corrective action if the price fails to clearly break below $68.73 Fibo support.
Release of EIA crude inventories report, due later today, is eyed for fresh signal. Draw of 1.29 million barrels is forecasted, compared to previous week's fall of 2.55 million barrels.
Stronger than expected drop in crude stocks would offer fresh support to oil prices and signal reversal, while negative scenario could risk extension towards next support area between $68.04 and $67.85 (converging 30/20SMA's).
Res: 68.83, 69.35, 69.74, 70.00
Sup: 68.40, 68.04, 67.85, 67.08
AUDUSD Outlook: Aussie Maintains Bearish Sentiment After Limited Impact From Better Than Expected Data
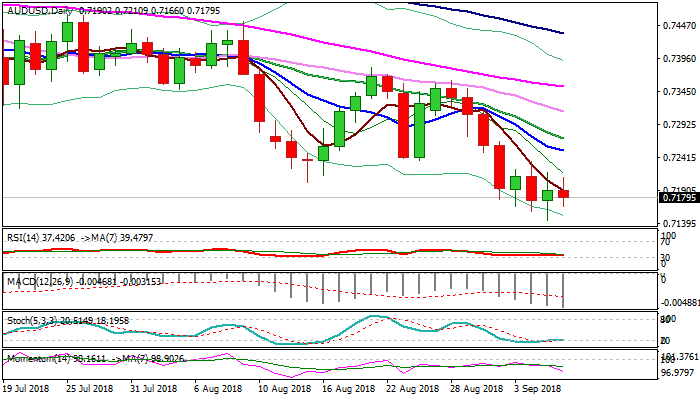
The Australian dollar slipped from session high at 0.7210 in late Asian trading, following short-lived advance after better than expected Australian trade data (trade surplus A$1.55 bn vs 1.46 bn f/c).
Prevailing bearish sentiment on turmoil in emerging markets was boosted by ANZ hike of mortgage rates, keeping bearish bias.
Daily techs maintain strong bearish momentum for renewed probe through cracked key supports at 0.7160 zone (May/Dec 2016 higher base), clear break of which would signal continuation of larger downtrend from 2018 high (0.8135) towards psychological 0.7000 support.
Falling 10SMA (0.7252) is expected to keep the upside protected.
Res: 0.7210, 0.7235, 0.7252, 0.7272
Sup: 0.7160, 0.7143, 0.7100, 0.7000
USDJPY Outlook: Continues To Face Very Strong Headwinds From Daily Cloud Top
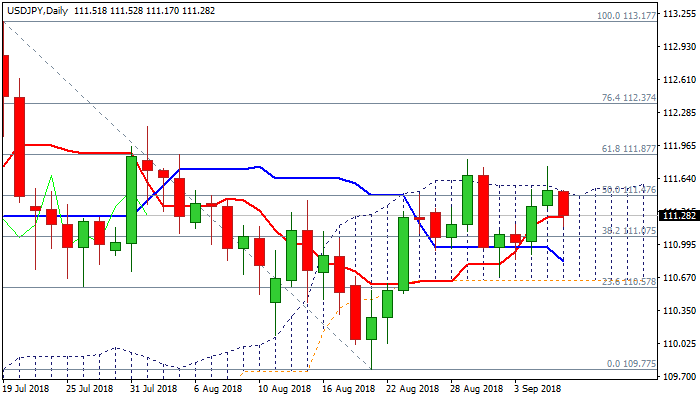
The pair moved lower in early Thursday's trading after, continuing to fight with daily cloud top, which proved to be strong barrier. Wednesday's failure to close above cloud, following spike to 111.75 and repeated rejection at cloud top (111.51) today, suggests the pair may extend sideways mode under cloud top, before establishing in fresh direction, with focus on US jobs data on Friday, which could be a catalyst. Bullish daily studies and safe-haven buying on concern about global trade issues are supportive, but weaker dollar on fresh advance of pound and Euro, partially offsets positive impact.
Res: 111.52, 111.75, 111.87, 112.15
Sup: 111.17, 111.08, 110.96, 110.68
GBPUSD Outlook: Sterling Maintains Bullish Bias After Brexit News Improved Sentiment
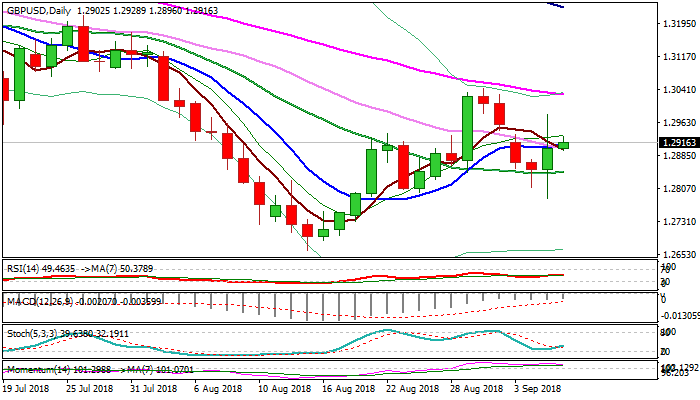
Cable holds firm tone in early Thursday's trading after previous day's strong rally on breakthrough from Brexit talks.
The pair spiked to 1.2983 on Wednesday but was unable to hold gains and pulled back to 1.2900 zone, where it closed for the day.
Long shadows of Wednesday's daily candle suggest that indecision exists, however, improved sentiment on the latest news regarding Brexit and bullishly aligned daily techs, keep near-term focus at the upside.
Fresh bulls need to fill Monday's gap to confirm reversal and open way for test of 1.3000 (psychological barrier) and 1.3028/43 (falling 55SMA / 30 Aug high) in extension.
Converged 10/30SMA's at 1.2900 zone need hold and keep bullish bias.
Conversely, break and close below 20SMA (1.2849) would generate bearish signal.
Res: 1.2933, 1.2983, 1.3000, 1.3035
Sup: 1.2900, 1.2840, 1.2800, 1.2785
Gold rebounds with 1209 minor resistance in focus
Gold's correction from 1214.30 extended to 1189.49 earlier this week but recovered since then. It's picking up some upside momentum today and is back above 1200. But for now we'd prefer to see a break of 1209.00 minor resistance to confirm near term bullishness.
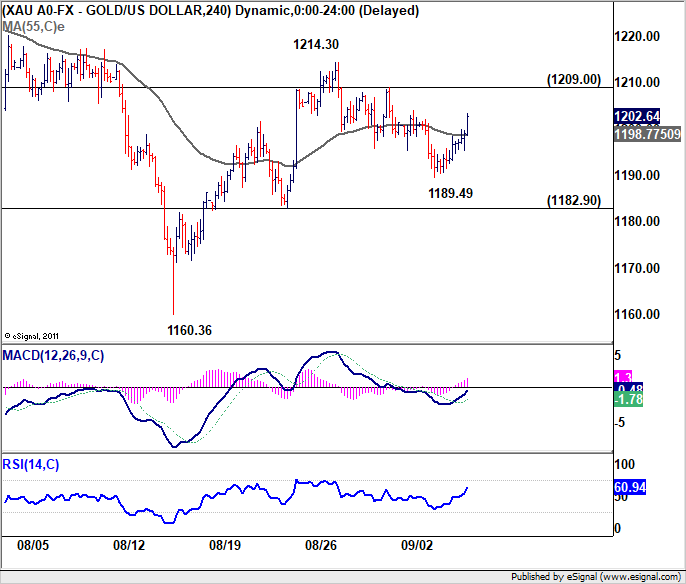
Overall outlook is unchanged. With 1182.90 minor support intact, rebound from 1160.36 is still in progress and further rise is expected. Break of 1209 will suggest rise resumption for 55 day EMA (now at 1222.51) and above.
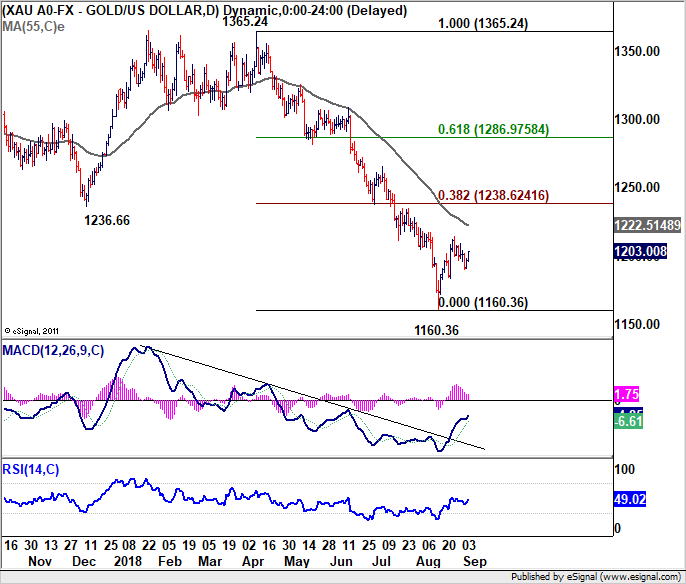
However, as this rebound is seen as a correction to the larger down trend from 1365.24, we'd expect strong resistance from 38.2% retracement of 1365.24 to 1160.36 at 1238.62 to limit upside to complete it.