Sample Category Title
EM Markets Sale-Off Spreading To DM
The current weakness on the developing countries financial markets is the longest since 2008. The similarities go further than that: as well as 10 years ago, the aggravation falls in autumn, when the funds actively review their investment strategies, and the reasons are – chronic deficits and high level of debt.
However, then the source of the problems was developed countries, and at one time there was a popular idea of decoupling, proving that the problems of the developed countries would not have a significant negative impact on the developing ones.
History showed how erroneous these hypotheses had been, and the financial world has proved to be complex and interconnected, and all the countries have not been spared the echoes of the global financial crisis. Nevertheless, developing countries recovered faster, providing an increasingly serious share of the world economy growth in subsequent years.
It is likely that this time, in case of serious problems on the financial markets of large developing countries, the developed markets will be able to maintain immunity only until a certain point when the weakening of the markets will be relatively organized. The supporters of a limited influence on the markets of developed countries may also recall that the Asian crisis of 1997 did not cause any recessions in developed countries. But in 21 years the economies of developing countries have multiplied several times.
10 years ago, countries were coping with the global crisis through joint and coordinated solutions, while the growth of populism and protectionism in politics in recent years risks exacerbating local problems and result in the loss of valuable time to find joint solutions.
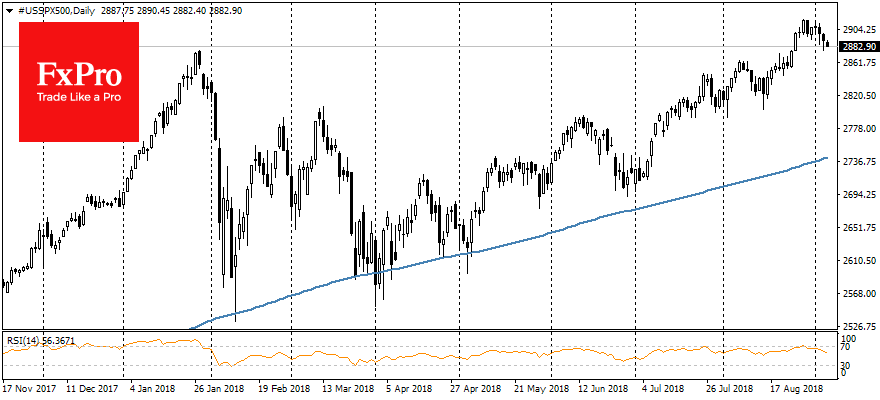
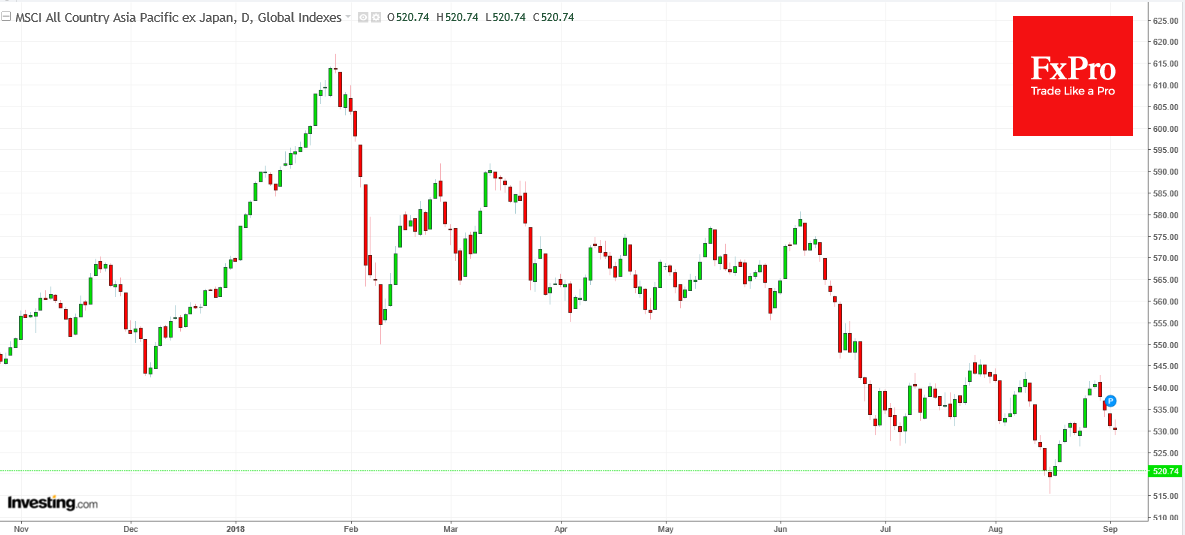
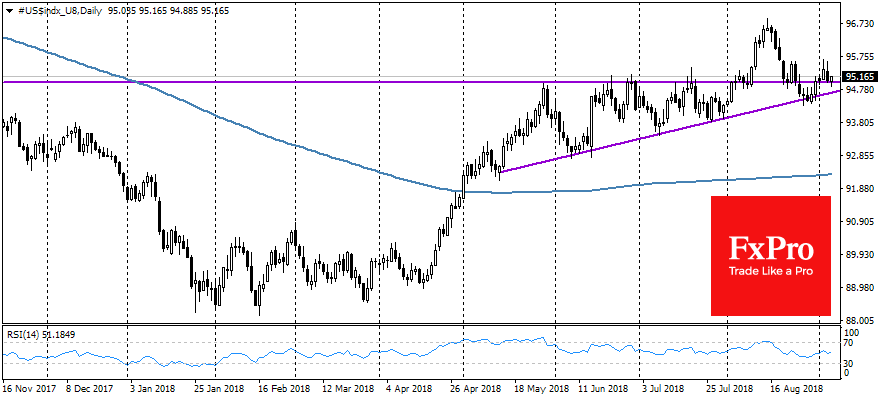
Under these circumstances, the pressure on the global stock markets may only grow in the near future. S&P500 index lost 0.5% on Wednesday, increasingly keeping away from the historical highs achieved a week earlier, despite the strong economic data from the U.S. MSCI has decreased on Thursday morning by 1.8% in the area of one-year lows. The dollar index remains near 95.10 since the beginning of the month, having fallen by 0.2% on Wednesday. However, the development of pressure on EM market is able to develop the offensive of the American currency as haven.
GBP/JPY Daily Outlook
Daily Pivots: (S1) 142.75; (P) 143.86; (R1) 145.06; More...
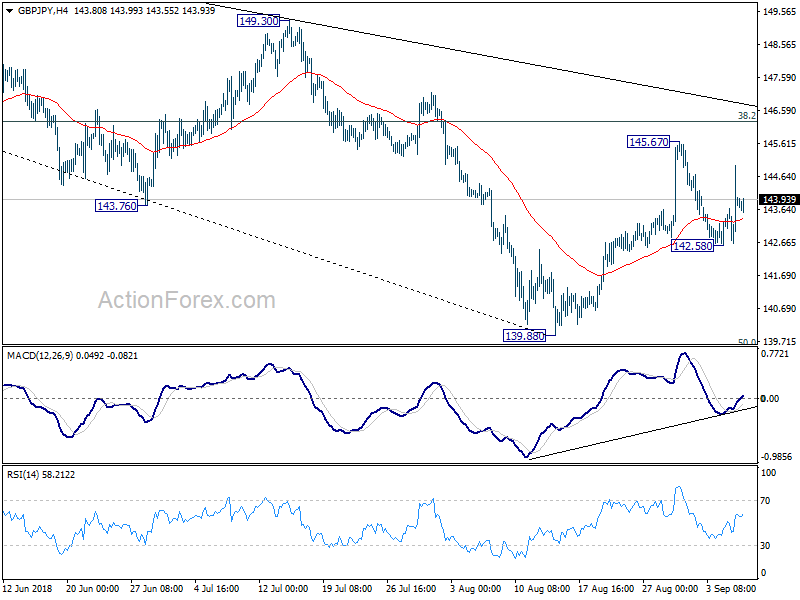
GBP/JPY failed to take out 145.67 and retreated. Intraday bias is turned neutral first. On the upside, break of 145.67 will target 38.2% retracement of 156.59 to 139.88 at 146.26. Decisive break there will be a strong signal that fall from 156.59 has completed at 139.88, ahead of 139.29/47 key support zone. Further rally should then be seen to 149.30 resistance for confirmation. On the downside, though, break of 142.58 will turn focus back to 139.88 low instead.
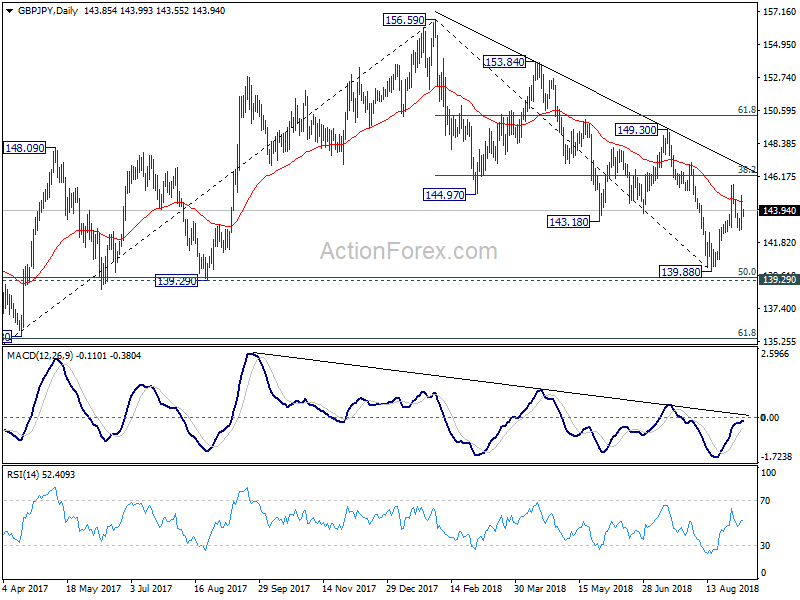
In the bigger picture, at this point decline from 156.59 is still seen as a corrective move. Focus remains on 139.29 cluster support (50% retracement of 122.36 to 156.59 at 139.47). Strong rebound from there will re-affirm the bullish case that rise from 122.36 is still to extend through 156.59 high. However, sustained break of 139.29/47 should confirm medium term reversal. GBP/JPY would then target a retest on 122.26 (2016 low).
GBP/USD Bullish Above 1.2850
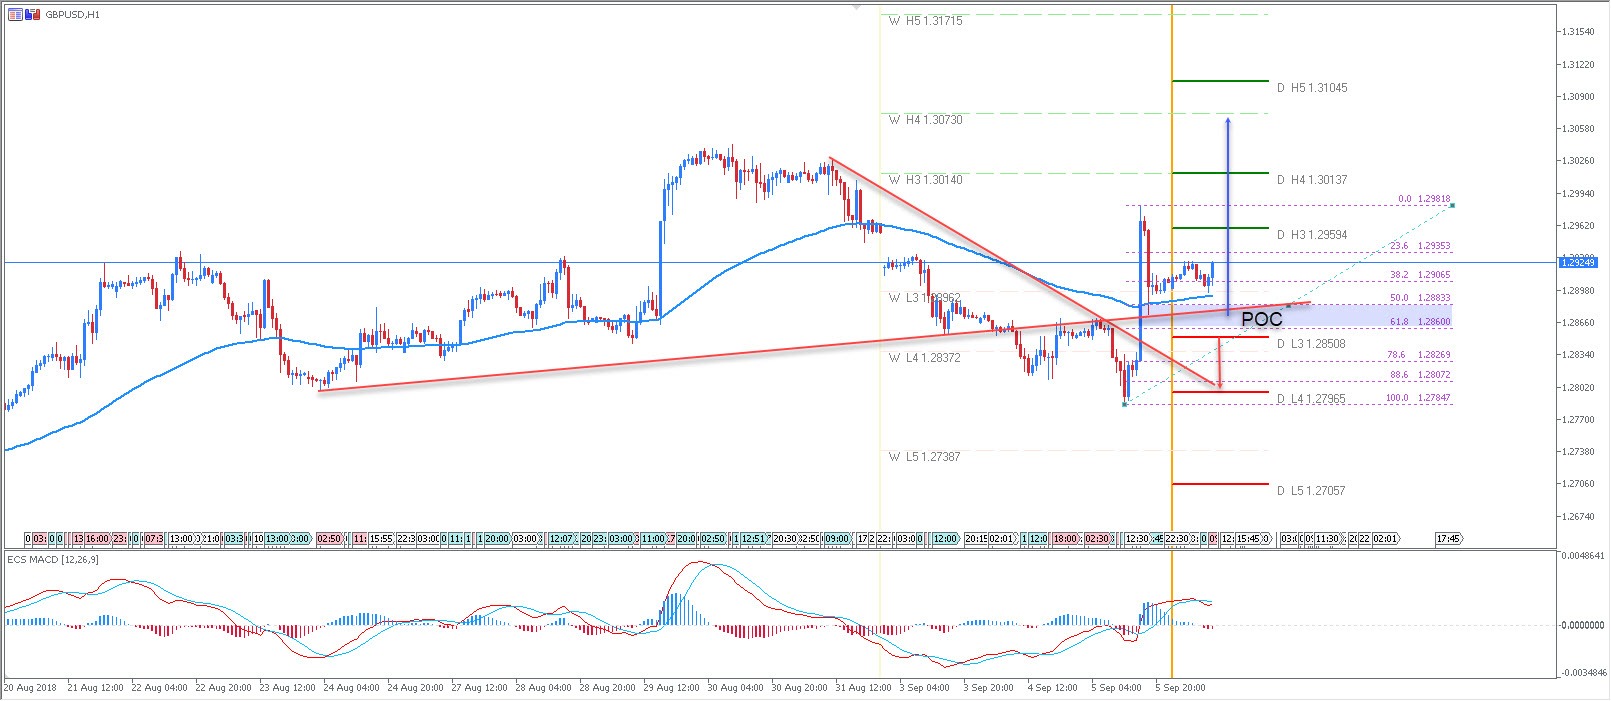
The GBP/USD has formed a strong marubozu candle, retesting the 1.2980 zone. At this point we might see another bounce as the POC zone is just below the current price. Potential buyers are within the 1.2860-1.2885 zone, but make sure to pay attention to the 1.2905 zone too. First target of 1.2959, followed by 1.2980 and 1.3015. Only a 4H close above 1.3015 should target the 1.3073 zone. However, if 1.2850 is lost, bears might dominate, targeting around 1.2796.
W L3 - Weekly Camarilla Pivot (Weekly Interim Support)
W H3 - Weekly Camarilla Pivot (Weekly Interim Resistance)
W H4 - Weekly Camarilla Pivot (Strong Weekly Resistance)
D H4 - Monthly Camarilla Pivot (Very Strong Daily Resistance)
D L3 – Monthly Camarilla Pivot (Daily Support)
D L4 – Monthly H4 Camarilla (Very Strong Daily Support)
POC - Point Of Confluence (The zone where we expect the price to react - aka the entry zone)
EUR/JPY Daily Outlook
Daily Pivots: (S1) 128.88; (P) 129.43; (R1) 130.27; More....
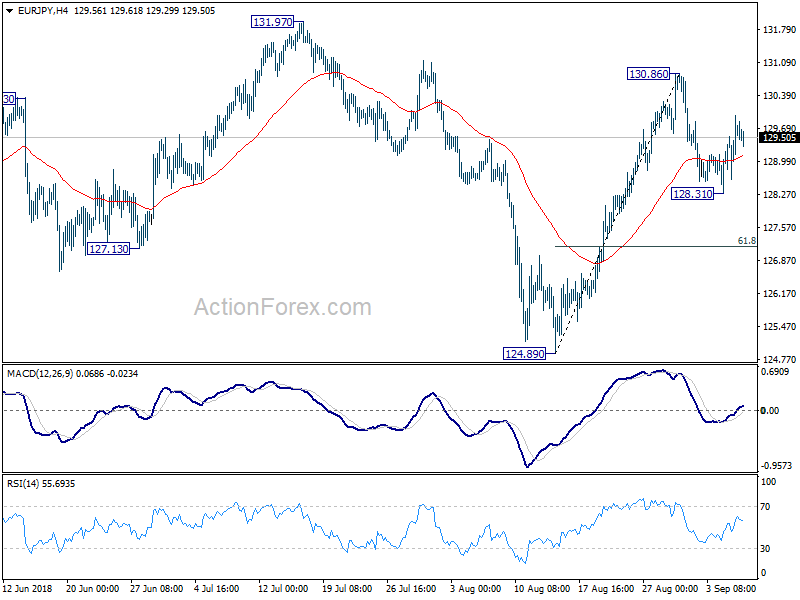
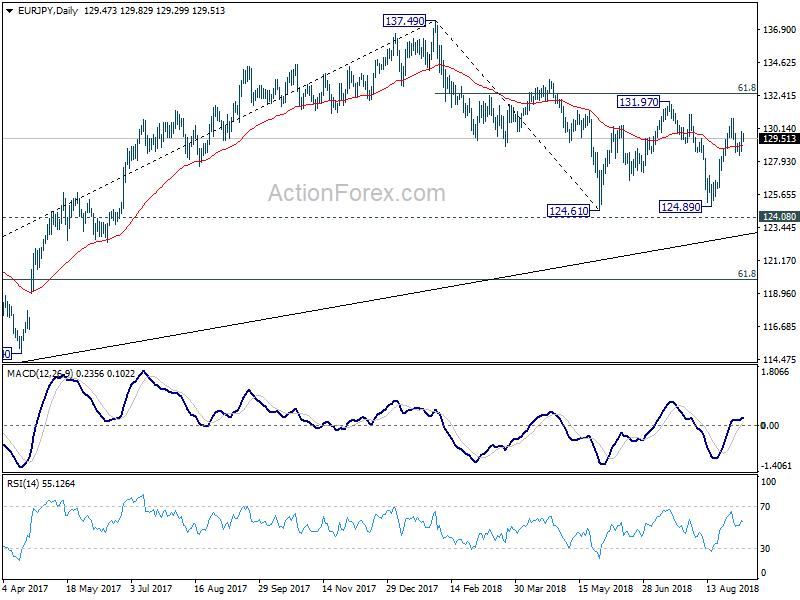
EUR/JPY lacks a clear direction for the moment as it dipped to 128.31 but then quickly recovered with weak upside momentum. Intraday bias stays neutral first. On the upside, break of 130.86 will extend the rise from 124.89 and target 131.97/132.56 key resistance zone. on the downside however, break of 128.31 will extend the fall from 130.86 to 61.8% retracement of 124.89 to 130.86 at 127.17 and below.
In the bigger picture, EUR/JPY once again rebounded ahead of 124.08 key resistance turned support. It's also held well above long term trend line from 109.03 (2016 low). The development argues that such rise from 109.03 might not be over yet. Decisive break of 61.8% retracement of 137.49 to 124.61 at 132.56 will pave the way to retest 137.49 high. But, firm break of 124.08 will argue that whole rise from 109.03 (2016 low) has completed at 137.49. Deeper decline would be seen to 61.8% retracement of 109.03 to 137.49 at 119.90 next.
EUR/GBP Daily Outlook
Daily Pivots: (S1) 0.8959; (P) 0.9007; (R1) 0.9057; More...
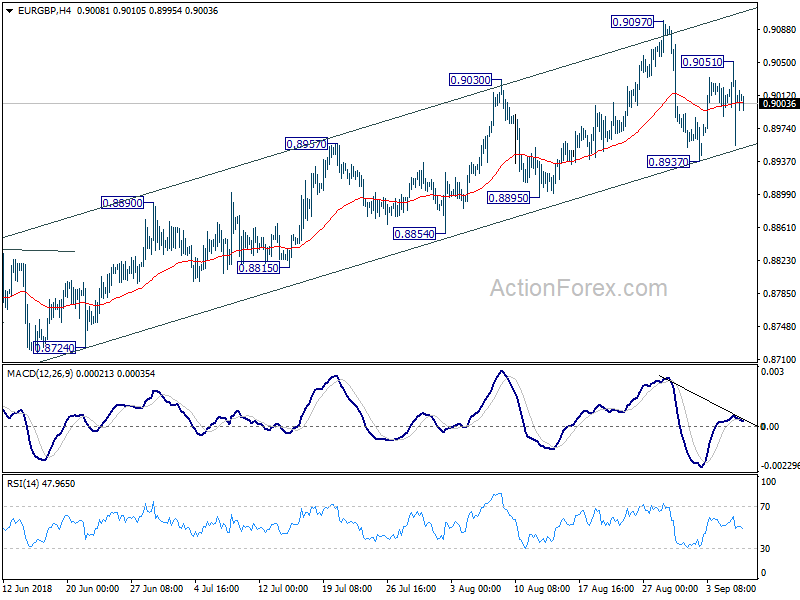
Much volatility is seen in EUR/GBP after the cross hit 0.9051. Intraday bias is turned neutral first. And, after all, it's staying inside near term rising channel. Thus, outlook stay bullish for another rise. On the upside, above 0.9051 will target 0.9097 first. Break will resume the rally from 0.8620. However, break of 0.8937 support should have near term channel support firmly taken out. And that will indicate completion of rise from 0.8620 and turn outlook bearish.
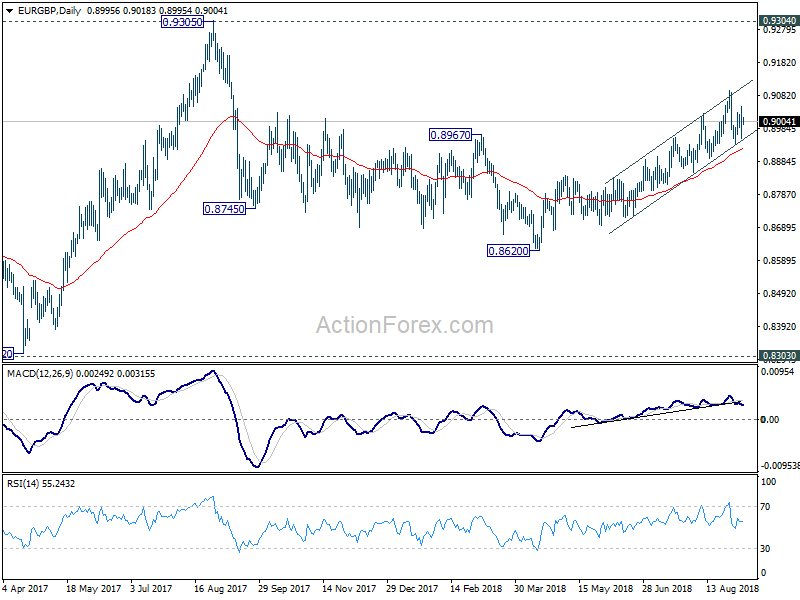
In the bigger picture, EUR/GBP is staying in long term range pattern from 0.9304 (2016 high). The corrective structure of the fall from 0.9305 to 0.8620 is raising the chance that rise from 0.8312 to 0.9305 is an impulsive move. But we're not too confident on it yet. In any case, we'd stay cautious on strong resistance from 0.9304/5 to limit upside in case of further rally. Meanwhile, if there is another medium term decline, strong support will likely be seen from 0.8303 to contain downside.
EUR/AUD Daily Outlook
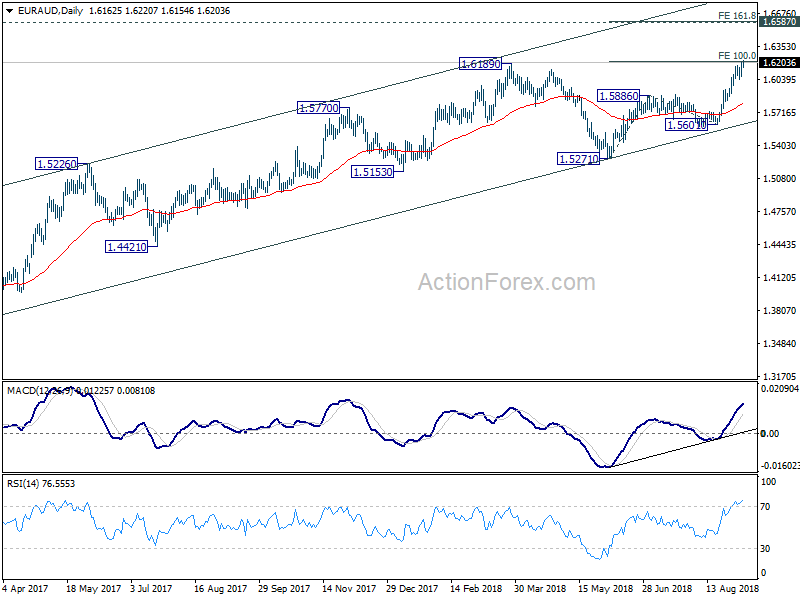
Daily Pivots: (S1) 1.6089; (P) 1.6146; (R1) 1.6221; More....
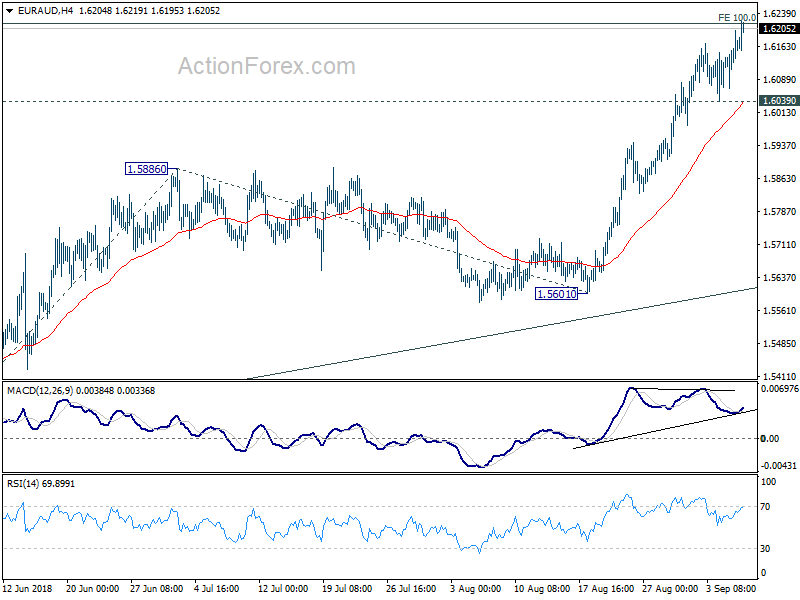
EUR/AUD's rally resumed after brief consolidation and reaches as high as 1.6220 so far. Intraday bias is back on the upside. Firm break of firm break of 100% projection of 1.5271 to 1.5886 from 1.5601 at 1.6216 will extend the larger up trend to 161.8% projection at 1.6596, which is close to another key resistance level at 1.6587. On the downside, though, break of 1.6039 support will indicate short term topping and bring lengthier consolidation first.
In the bigger picture, EUR/AUD drew strong support from 55 week EMA and rebounded. And the development argues that medium term rally from 1.3624 (2017 low) is still in progress. Firm break of 1.6189 will target a test on 1.6587 (2015 high). On the downside, break of 1.5601 support will now be the first sign of medium term reversal, and will bring a test on 1.5271 key support for confirmation.
EUR/CHF Daily Outlook
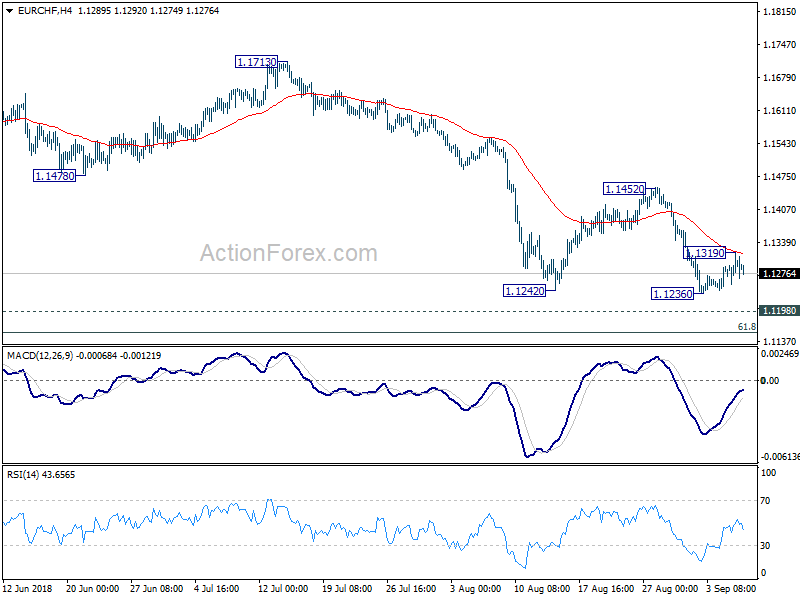
Daily Pivots: (S1) 1.1265; (P) 1.1293; (R1) 1.1332; More...
EUR/CHF recovered to 1.1319 but failed to break through 4 hour 55 EMA and retreated. Intraday bias stays neutral first. On the downside, break of 1.1236 will resume larger fall from 1.2004 to key support zone at 1.1154/98. We'd expect strong support from there to bring rebound. On the upside, sustained break of 4 hour 55 EMA (now at 1.1317) will turn bias back to the upside for 1.1452 resistance. However, sustained break of 1.1154/98 will carry larger bearish implications.
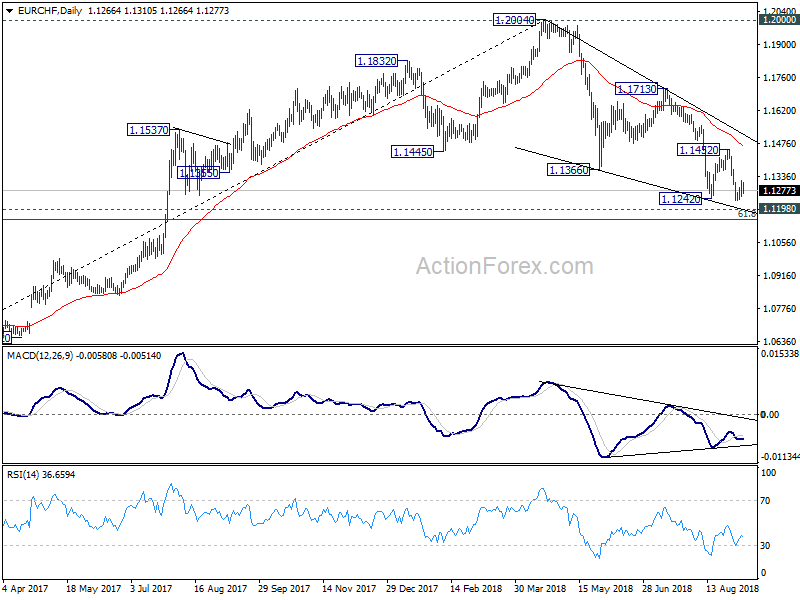
In the bigger picture, for now, the price actions from 1.2004 medium term top is seen as a correction only. Downside should be contained by support zone of 1.1198 (2016 high) and 61.8% retracement of 1.0629 to 1.2004 at 1.1154 to complete it and bring rebound. This cluster level is in proximity to long term channel support (now at 1.1173) too. A break of 1.2 key resistance is still expected in the medium term long term. However, sustained break of the mentioned support zone will mark reversal of the long term trend. In that case, 1.0629 key support will be back into focus.
EURUSD Outlook: The Euro Remains Firm But Lacks Momentum For Extension Through Thin Daily Cloud
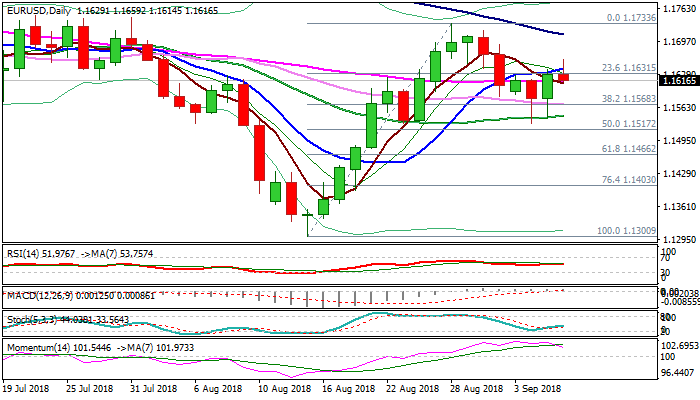
The Euro is consolidating strong gains from the previous day, after rally of British pound dragged the single currency.
Thin daily cloud (1.1662/1.1678) also attracts fresh bulls for break higher and attack at falling 100SMA (1.1710) and 28 Aug high (1.1733). Meanwhile, corrective easing may precede, as 14-d momentum turned south and created bear-cross with its 7SMA.
Initial support lays at 1.1615 (session low/55SMA), followed by 1.1600 (hourly Kijun-sen/55SMA), where dips should find support to keep fresh bulls intact. Loss of 1.1600 handle would delay bulls and risk retest of 1.1568 pivot (30SMA/Fibo 38.2% of 1.1300/1.1733 ascend).
Res: 1.1642, 1.1662, 1.1678, 1.1718
Sup: 1.1615, 1.1600, 1.1568, 1.1546
GBPUSD Spike Higher Creates Bearish Pattern
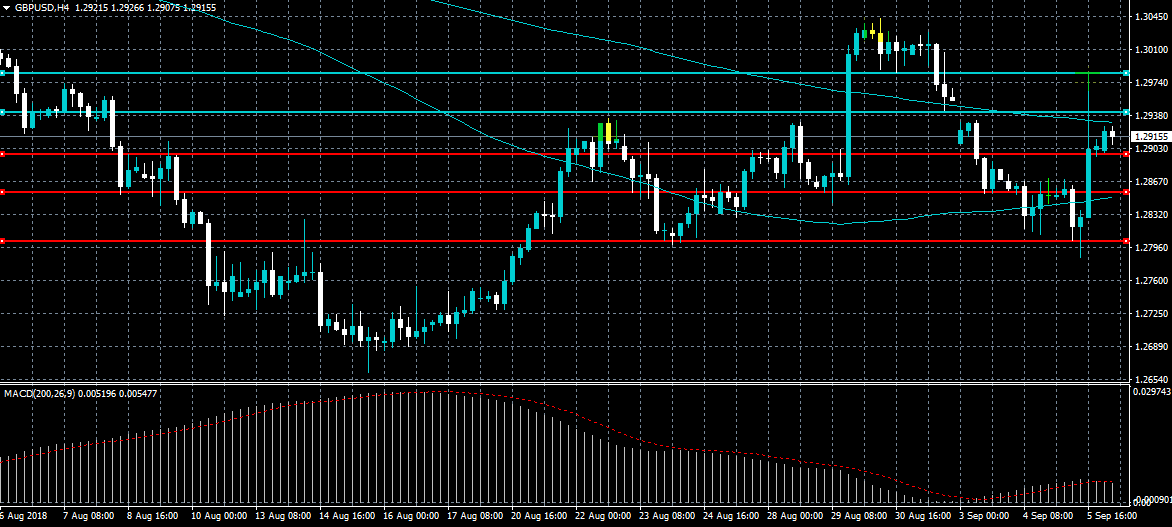
The British pound has spiked sharply higher against the US dollar after reports surfaced that German officials have dropped key Brexit demands. The GBPUSD has fallen away from the best levels of Wednesday, with the move higher helping to close the price gap on the weekly open. The recent move higher has also created a bearish head and shoulders pattern on the four-hour time frame.
The GBPUSD pair remains bearish while trading below the 1.2955 level, key support is now found at the 1.2863 and 1.2802 levels.
If the GBPUSD pair moves above the 1.2955 level, buyers are likely to target the 1.2985 and 1.3040 resistance levels.
EURUSD Attempting To Break Key Resistance
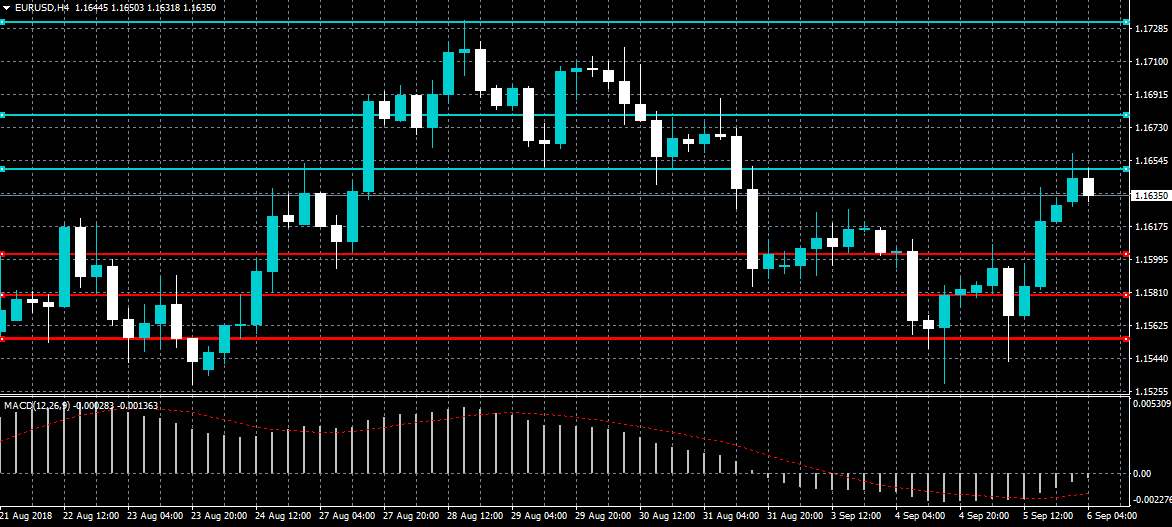
The euro currency continues to press higher against the greenback after the U.S. Dollar Index failed to hold above the key 95.50 support level for the second consecutive day. The short-term trend on the EUR/USD pair will turn bullish if buyers can hold price above the 1.1650 resistance level. The MACD indicator across the one-hour time frame continues to trend higher.
The EURUSD pair is only bullish while trading above the 1.1650 level, key technical resistance is now found at the 1.1681 and 1.1730 levels.
If the EURUSD sellers move price below the 1.1600 level once again, sellers will likely test the 1.1580 and 1.1553 levels.