Sample Category Title
USD/JPY Needs Bearish Breakout To Confirm ABC Pattern
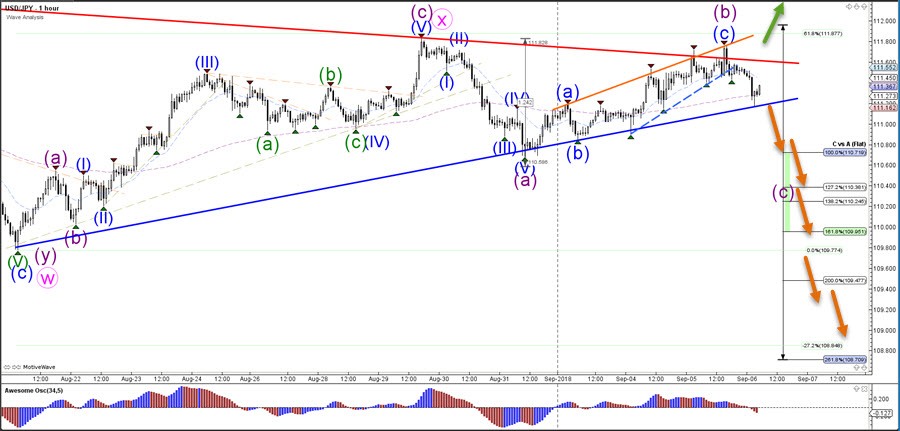
The USD/JPY made a bearish bounce atthe resistance trend line (red) but a breakout below the support trend line (blue) is still needed before the wave B (purple) pattern becomes more likely and can be confirmed.
The USD/JPY bearish breakout would be part of a larger ABC (purple) zigzag pattern within wave Y (pink). A break above the resistance trend line (red) could see price move up towards the 78.6% Fib and expand wave X (pink).
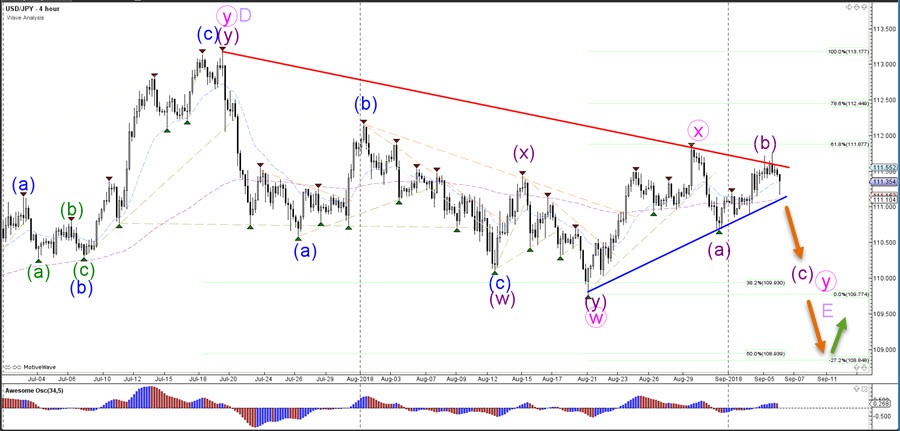
The USD/JPY is testing the support (blue) and resistance (red) trend lines and the breakout will be an important factor for the next direction.
Riksbank Set To Postpone Rate Hike To Next Year
Market movers today
The key event today will be the Riksbank meeting, where it is a close call as to whether the Riksbank will maintain its expectation of a rate hike this year. We expect another delay in the policy tightening.
The US ADP employment report will be watched ahead of non-farm payrolls for August tomorrow.
German factory orders for July will be monitored for any signs of the lingering impact of weaker external demand and trade war concerns.
Selected market news
Sweden's big week kicks off today as the Riksbank convenes. The Swedish central bank announces its rate decision at 09:30 CEST. We expect the central bank to postpone its first rate hike in seven years yet again. This would be accomplished by lowering the probability of a rate hike in Q4 and hence effectively postponing the hike to next year. We acknowledge that it is a close call, however, as the central bank is divided.
The other major event for Sweden is the general election on Sunday, where we expect a minority government outcome led by Ulf Kristersson and the Moderates. For a detailed exp osition on Sweden's tumultuous week. For a brief explanation of market impact, turn the page to our Scandi and FX sections.
Italian bonds rallied for a second day in a row as multiple Italian news sources reported that Deputy Prime Ministers Di Maio and Salvini were going to conform to EU budget deficit limits. The Maastricht Treaty stipulates the budget deficit limit at 3% of GDP, although there have been numerous exceptions, as even Germany has breached deficit rules multiple times. We see an Italy-EU budget standoff as a major risk for markets.
Emerging markets remained under pressure. In the equities space, Indonesian stocks witnessed the most excessive bloodletting. In the currency domain, the South African rand took the lead as the country entered a recession for the first time since 2009. The sell-off has broadened across the emerging markets universe.
The US trade deficit widened to USD50.1bn in July from USD45.7bn in June, which amounts to a five-month high as exports fell and imports rose. Net exports will prove a headwind for US GDP in the third quarter, however domestic demand continues to be the main driver of the US economy.
S&P500 E-Mini Futures Entering Buying Areas Soon?
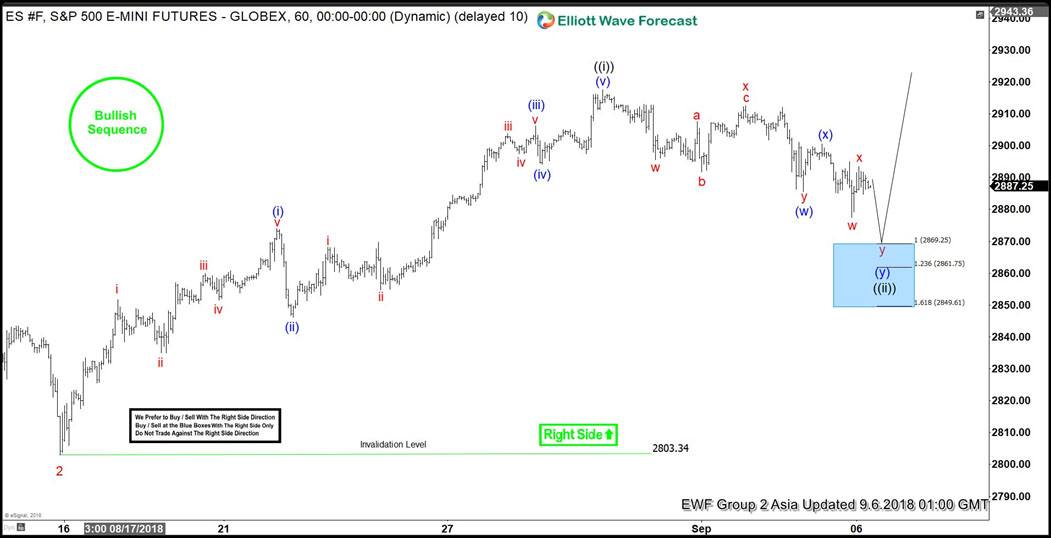
S&P500 E-Mini Futures ticker symbol: $ES_F Elliott wave view suggests that the pullback to $2803.34 low ended Minor wave 2. Up from there, the rally higher to $2917.50 high ended Minute wave ((i)). The internals of that rally higher unfolded as impulse structure with the sub-division of 5 waves structure in it’s each leg higher i.eMinutte wave (i), (iii) & (v).
Up from $2803.34 low, the initial rally to $2874 high ended Minutte degree wave (i) in 5 waves structure. Down from there, the 3 waves pullback to $2846.25 low ended Minutte wave (ii). A rally higher from there ended Minutte wave (iii) in another 5 waves structure at $2906.25 high. Below from there, a pullback to $2894.25 low ended Minutte wave (iv). Then finally a rally to $2917.50 high ended Minutte wave (v) & also completed the Minute wave ((i)). Currently, the instrument is doing a Minute wave ((ii)) pullback against $2803.34 low in 3, 7 or 11 swings before further upside is seen. Near-term focus remains towards $2869.25-$2849.61, which is 100%-161.8% Fibonacci extension area of Minutte wave (w)-(x) to end the short-term correction. Index should find buyers from there looking for another extension higher or for minimum 3 waves reaction higher. We don’t like selling it as the right side tag & bullish sequence calling index higher.
S&P500 E-Mini Futures 1 Hour Elliott Wave Chart
Euro-Zone’s Retails Sales Fell For The First Time Since April 2018 In July
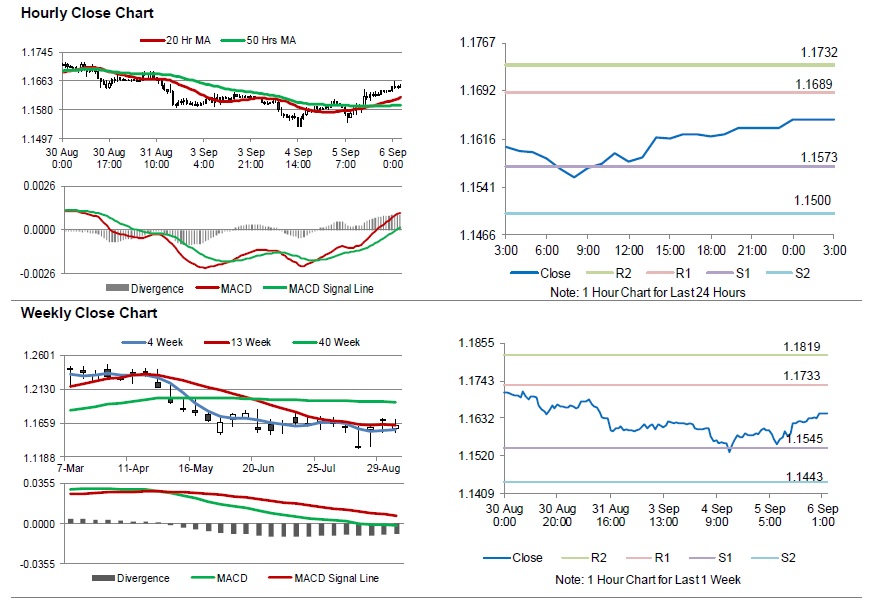
For the 24 hours to 23:00 GMT, the EUR rose 0.43% against the USD and closed at 1.1633.
On the data front, Euro-zone's final Markit services PMI climbed to a level of 54.4 in August, in line with market expectations and confirming the preliminary figures. In the prior month, the PMI had recorded a reading of 54.2. On the other hand, the region's seasonally adjusted retail sales retreated 0.2% on a monthly basis in July, registering its first decline in three months and compared to an advance of 0.3% in the previous month. Market participants had expected retail sales to drop 0.1%.
Separately, in Germany, the final services PMI advanced to a level of 55.0 in August, compared to market anticipations for a gain to a level of 55.2. In the preceding month, the PMI had registered a level of 54.1, while the preliminary figures had indicated a rise to 55.2.
In the US, data revealed that US trade deficit widened to a 5-month high level of $50.1 billion in July, from a revised deficit of $45.7 billion in the previous month. Markets had envisaged the nation to register a trade deficit of $50.2 billion. Moreover, the nation's MBA mortgage applications slid 0.1% on a weekly basis in the week ended 31 August 2018. Mortgage applications had registered a drop of 1.7% in the prior week.
In the Asian session, at GMT0300, the pair is trading at 1.1646, with the EUR trading 0.11% higher against the USD from yesterday's close.
The pair is expected to find support at 1.1573, and a fall through could take it to the next support level of 1.1500. The pair is expected to find its first resistance at 1.1689, and a rise through could take it to the next resistance level of 1.1732.
Moving ahead, investor's will await Germany's factory orders for July, set to release in a while. Later in the day, investors would focus on the US initial jobless claims along with the ADP employment change, ISM and Markit services PMIs, all for August. Additionally, factory orders and durable goods orders, both for July, will garner significant amount of investors' attention.
The currency pair is trading above its 20 Hr and 50 Hr moving averages.
USD/CAD Daily Outlook
Daily Pivots: (S1) 1.3157; (P) 1.3182; (R1) 1.3206; More...
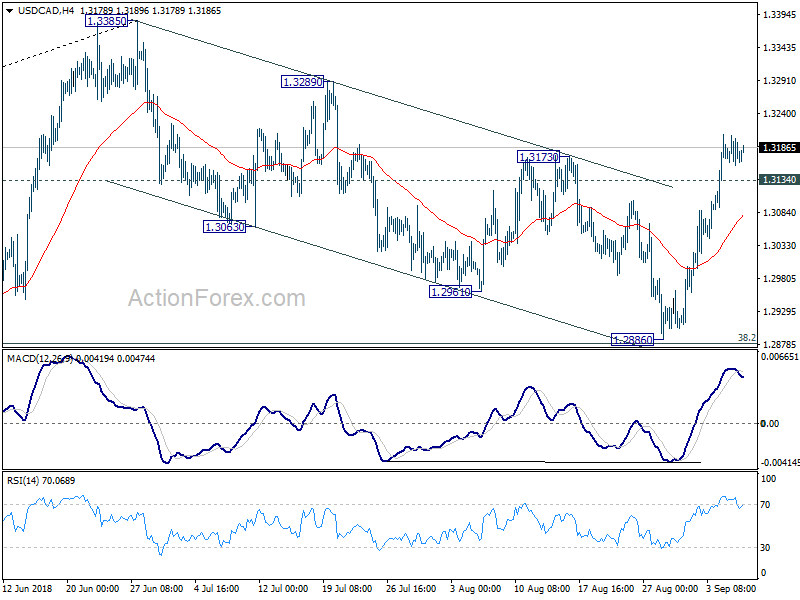
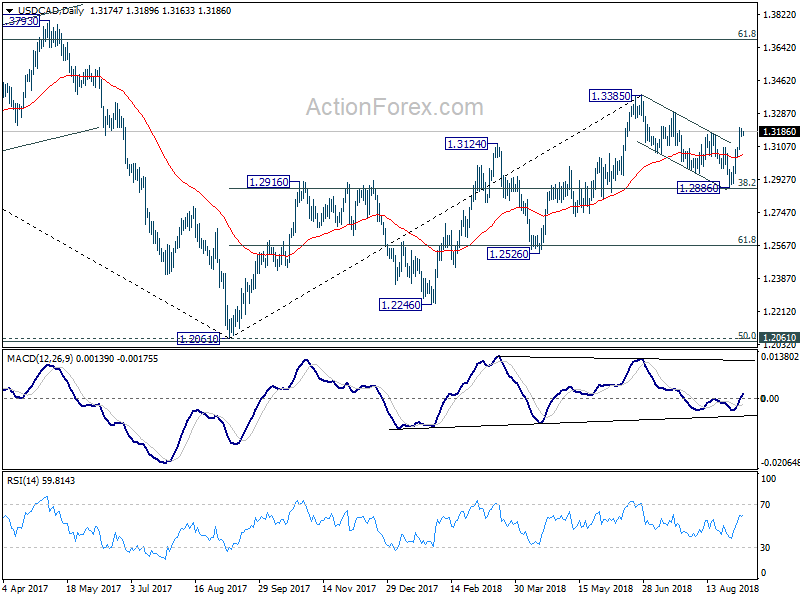
USD/CAD is losing some upside momentum as seen in 4 hour MACD. But with 1.3134 minor support intact, intraday bias stays on the upside for further rise. As noted before, the corrective pull back from 1.3385 should have completed at 1.2886 already, just ahead of 1.2879 key fibonacci level. Further rise should be seen to retest 1.3385 first. Break will resume the whole up trend form 1.2061 and target next key resistance level at 1.3685. On the downside, below 1.3134 minor support will bring more consolidation first, before staging another rally.
In the bigger picture, strong rebound ahead of 38.2% retracement of 1.2061 to 1.3385 at 1.2879 key fibonacci level retains medium term bullishness. That is, rise from 2017 low at 1.2061 is still in progress. Break of 1.3384 should target 61.8% retracement of 1.4689 (2015 high) to 1.2061 (2017 low) at 1.3685. On the downside, as long as 1.2886 support holds, outlook will now remain bullish.
Britain’s Service Sector Activity Expanded In August, On Strong New Orders
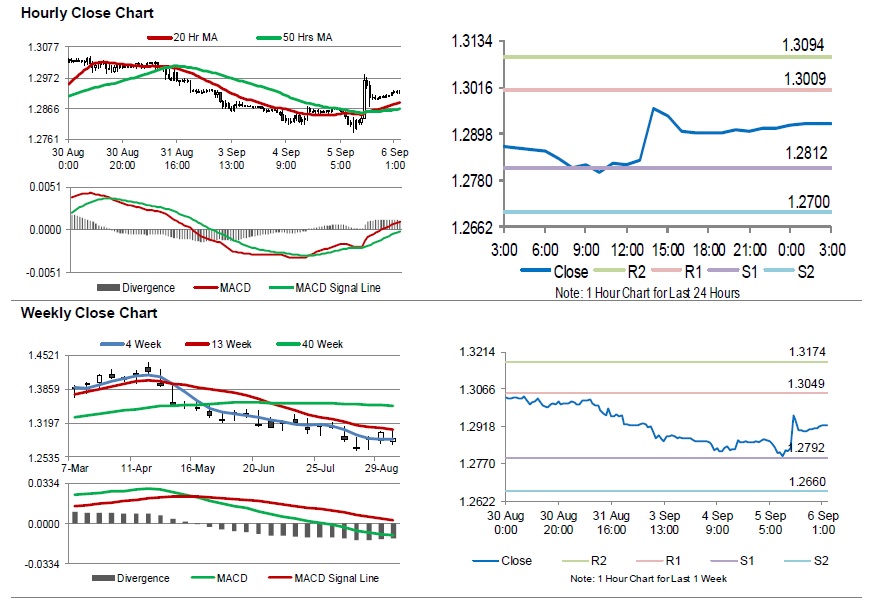
For the 24 hours to 23:00 GMT, the GBP rose 0.42% against the USD and closed at 1.2911.
Macroeconomic data indicated that UK's services PMI climbed to 54.3 in August, reaching its second-highest level since February and more than market consensus for a rise to a level of 53.9. The services PMI had recorded a reading of 53.5 in the previous month.
In the Asian session, at GMT0300, the pair is trading at 1.2923, with the GBP trading 0.09% higher against the USD from yesterday's close.
The pair is expected to find support at 1.2812, and a fall through could take it to the next support level of 1.2700. The pair is expected to find its first resistance at 1.3009, and a rise through could take it to the next resistance level of 1.3094.
With no macroeconomic releases in the UK today, investors would look forward to global macroeconomic releases for further directions.
The currency pair is trading above its 20 Hr and 50 Hr moving averages.
Japanese Yen Trading Higher In The Asian Session
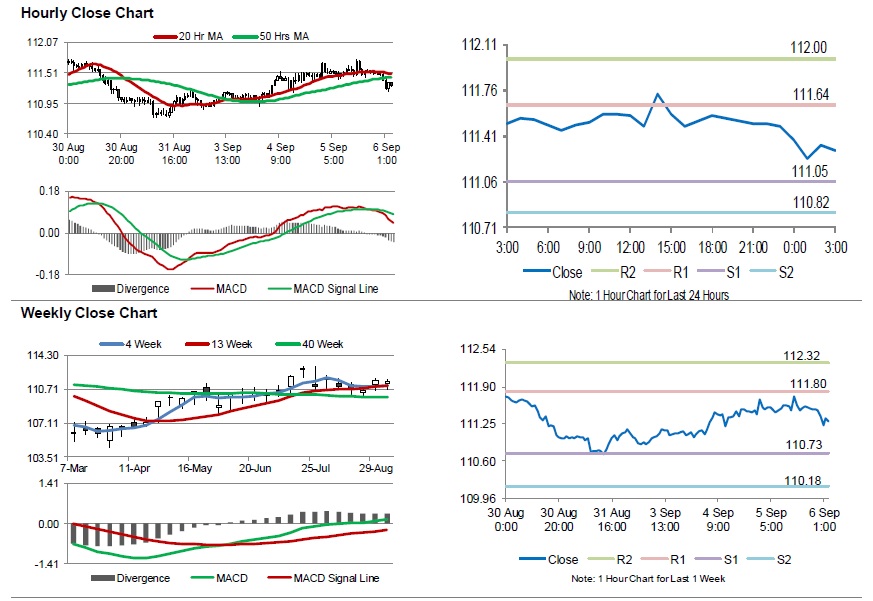
For the 24 hours to 23:00 GMT, the USD remained flat against the JPY and closed at 111.48.
In the Asian session, at GMT0300, the pair is trading at 111.29, with the USD trading 0.17% lower against the JPY from yesterday’s close.
The pair is expected to find support at 111.05, and a fall through could take it to the next support level of 110.82. The pair is expected to find its first resistance at 111.64, and a rise through could take it to the next resistance level of 112.00.
Looking forward, investor would keep a close watch on Japan’s overall household spending data for July, scheduled to release overnight.
The currency pair is trading below its 20 Hr and 50 Hr moving averages.
Swiss Franc Extends Its Gains In The Morning Session
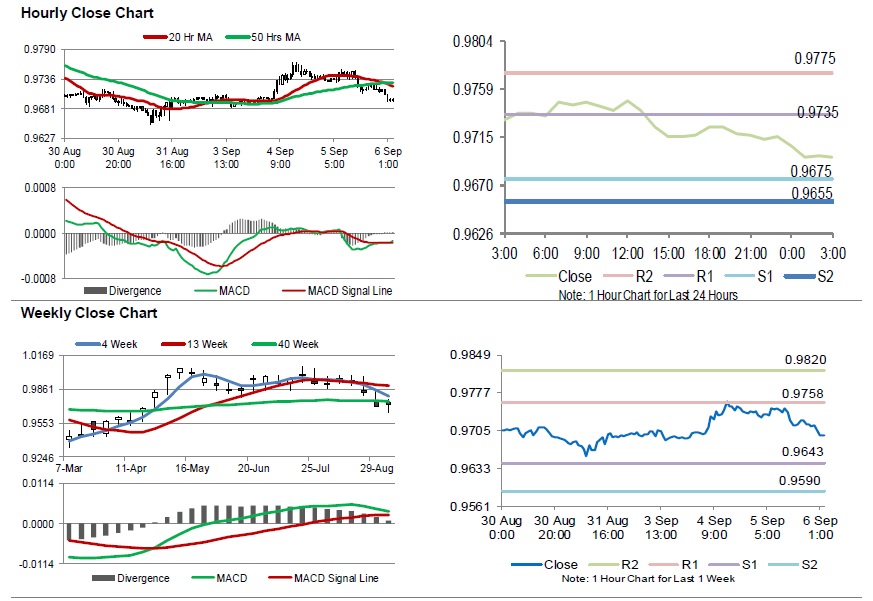
For the 24 hours to 23:00 GMT, the USD declined 0.27% against the CHF and closed at 0.9715.
In the Asian session, at GMT0300, the pair is trading at 0.9696, with the USD trading 0.20% lower against the CHF from yesterday’s close.
The pair is expected to find support at 0.9675, and a fall through could take it to the next support level of 0.9655. The pair is expected to find its first resistance at 0.9735, and a rise through could take it to the next resistance level of 0.9775.
Going ahead, investors’ will keep an eye on Switzerland’s 2Q GDP figures, slated to release in a while.
The currency pair is trading below its 20 Hr and 50 Hr moving averages.
AUD/USD Daily Outlook
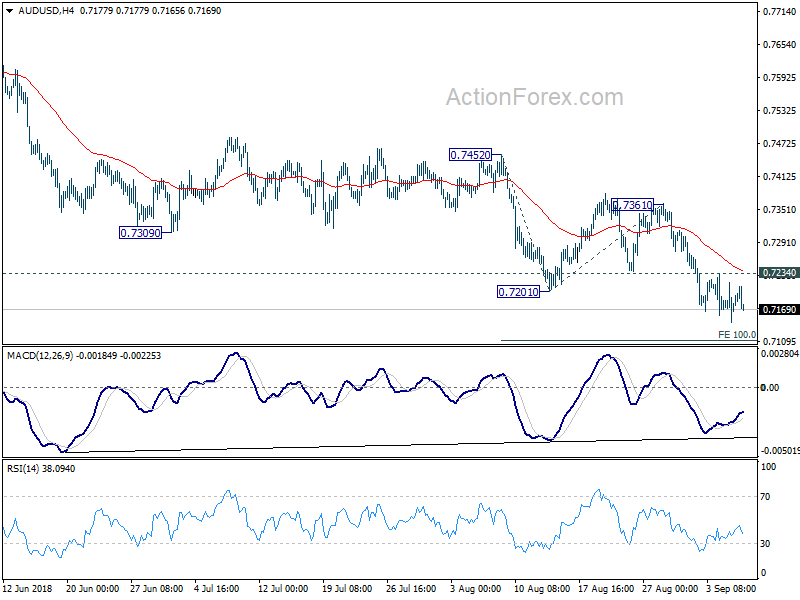
Daily Pivots: (S1) 0.7153; (P) 0.7185; (R1) 0.7225; More...
AUD/USD continues to edge lower with weak downside momentum as seen in 4 hour MACD. For now, deeper fall is expected as long as 0.7234 minor resistance holds, Next target is 100% projection of 0.7452 to 0.7201 from 0.7361 at 0.7110. Break will target 161.8% projection at 0.6955. However, break of 0.7234 will indicate short term bottoming and bring lengthier consolidations.
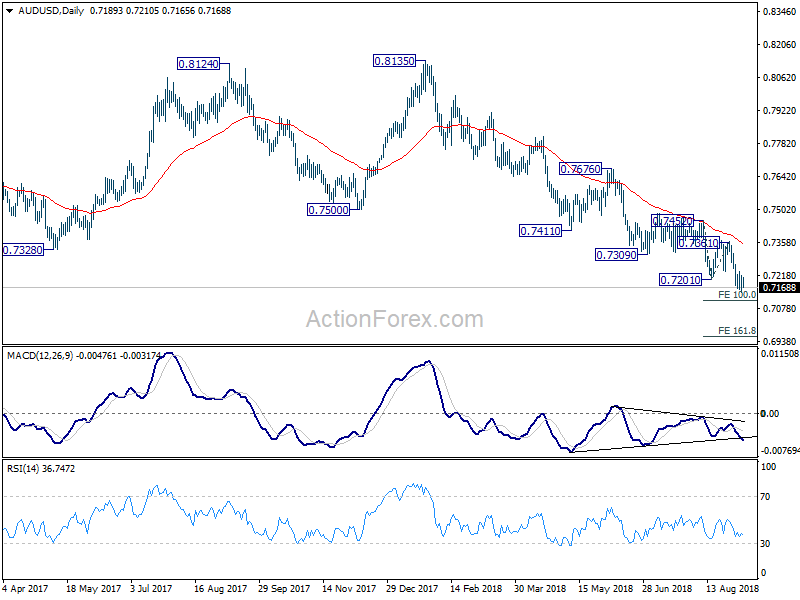
In the bigger picture, rebound from 0.6826 (2016 low) is seen as a corrective move that should be completed at 0.8135. Fall from there would extend to have a test on 0.6826. There is prospect of resuming long term down trend from 1.1079 (2011 high). But we'll look at downside momentum to assess at a later stage. On the upside, break of 0.7452 resistance, however, will indicate medium term bottoming, on bullish convergence condition in daily MACD. In that case, a medium term correction should be seen first before down trend resumption.
BoC Kept Its Benchmark Interest Rate Unchanged At 1.50%
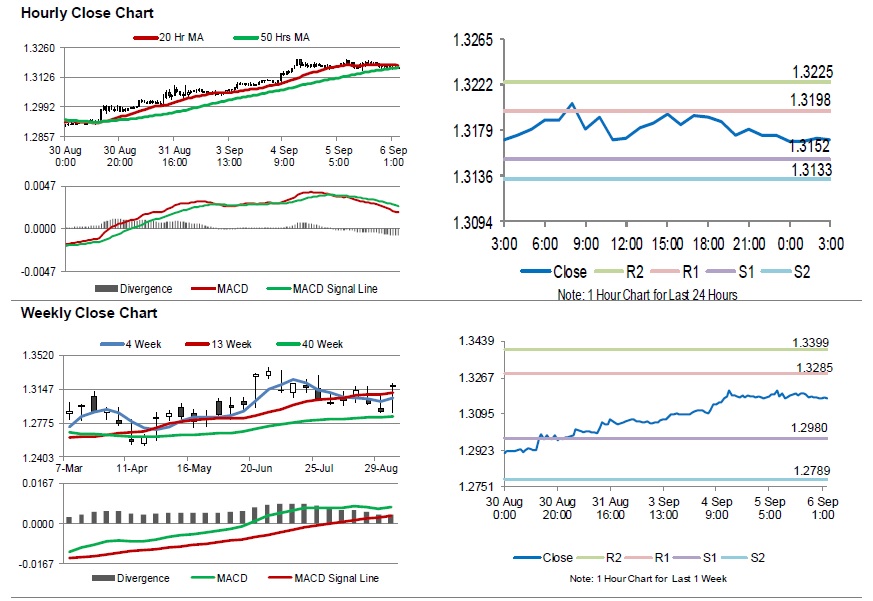
For the 24 hours to 23:00 GMT, the USD slightly declined against the CAD and closed at 1.3174.
The Bank of Canada (BoC), in its September monetary policy meeting, opted to leave its key interest rate unchanged at 1.50%, at par with market expectations, amid looming risks over NAFTA and inflation outlook. However, the bank signalled a possible rate hike at its next meeting on 24 October.
In the Asian session, at GMT0300, the pair is trading at 1.3171, with the USD trading slightly lower against the CAD from yesterday’s close.
The pair is expected to find support at 1.3152, and a fall through could take it to the next support level of 1.3133. The pair is expected to find its first resistance at 1.3198, and a rise through could take it to the next resistance level of 1.3225.
Moving ahead, investors would keep an eye on Canada’s building permits for July, slated to release later in the day.
The currency pair is showing convergence with its 20 Hr and 50 Hr moving averages.