Sample Category Title
Forex Technical Analysis: EUR/USD, USD/JPY, GBP/USD
EUR/USD
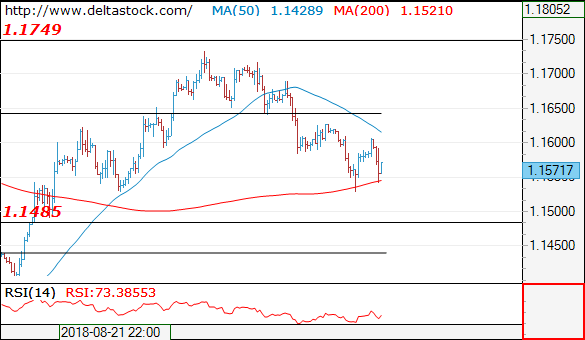
Current level - 1.1571
The bias is still bearish, for a dip to 1.1490 area. The latter should provide base for an upswing towards 1.1740.
| Resistance | Support | ||
| intraday | intraweek | intraday | intraweek |
| 1.1640 | 1.1750 | 1.1530 | 1.1300 |
| 1.1840 | 1.1840 | 1.1490 | 1.1100 |
USD/JPY
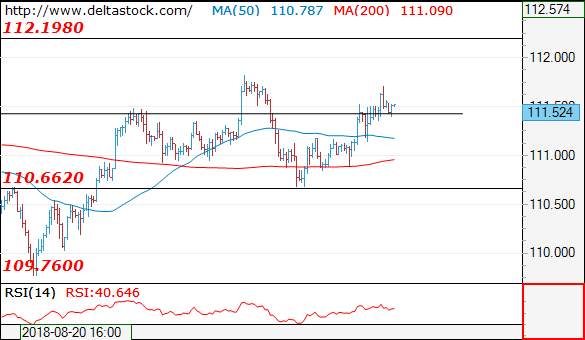
Current level - 111.54
My outlook is counter-trend, for a reversal and dip towards 110.70 zone. Crucial on the upside is 111.80 peak.
| Resistance | Support | ||
| intraday | intraweek | intraday | intraweek |
| 111.80 | 114.50 | 110.70 | 109.30 |
| 111.80 | 114.50 | 109.70 | 109.30 |
GBP/USD
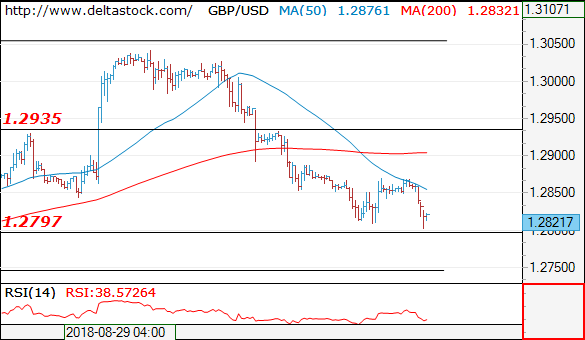
Current level - 1.2821
I favor a break through 1.2800, towards 1.2740 support area. The latter should mark the finale of the whole slide from 1.3050.
| Resistance | Support | ||
| intraday | intraweek | intraday | intraweek |
| 1.2890 | 1.3060 | 1.2800 | 1.2570 |
| 1.2935 | 1.3210 | 1.2740 | 1.2570 |
Gold Outlook: Risks Further Weakness If Recovery Attempts Stall
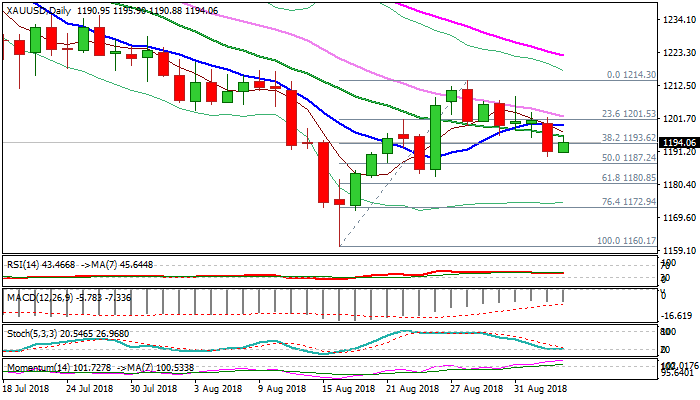
Spot Gold consolidates above new low at $1190, posted on Tuesday, with evidence of basing attempt supported by growing momentum and slow stochastic in sideways mode at the border of oversold zone.
Recovery action was so far capped by falling 20SMA ($1196), with sustained break here needed to ease existing downside risk and extension above 10SMA ($1199) to confirm reversal.
However, strengthening dollar keeps the yellow metal under pressure and bounce could be seen as positioning before bears off $1214 resume.
Loss of $1190 handle would open pivotal supports at $1183 (24 Aug trough) and $1180 (Fibo 61.8% of $1160/$1214 upleg).
Res: 1196, 1199, 1202, 1208
Sup: 1193, 1190, 1183, 1180
EURJPY Lacks Clear Direction In Near-Term, Drops Below 129.00
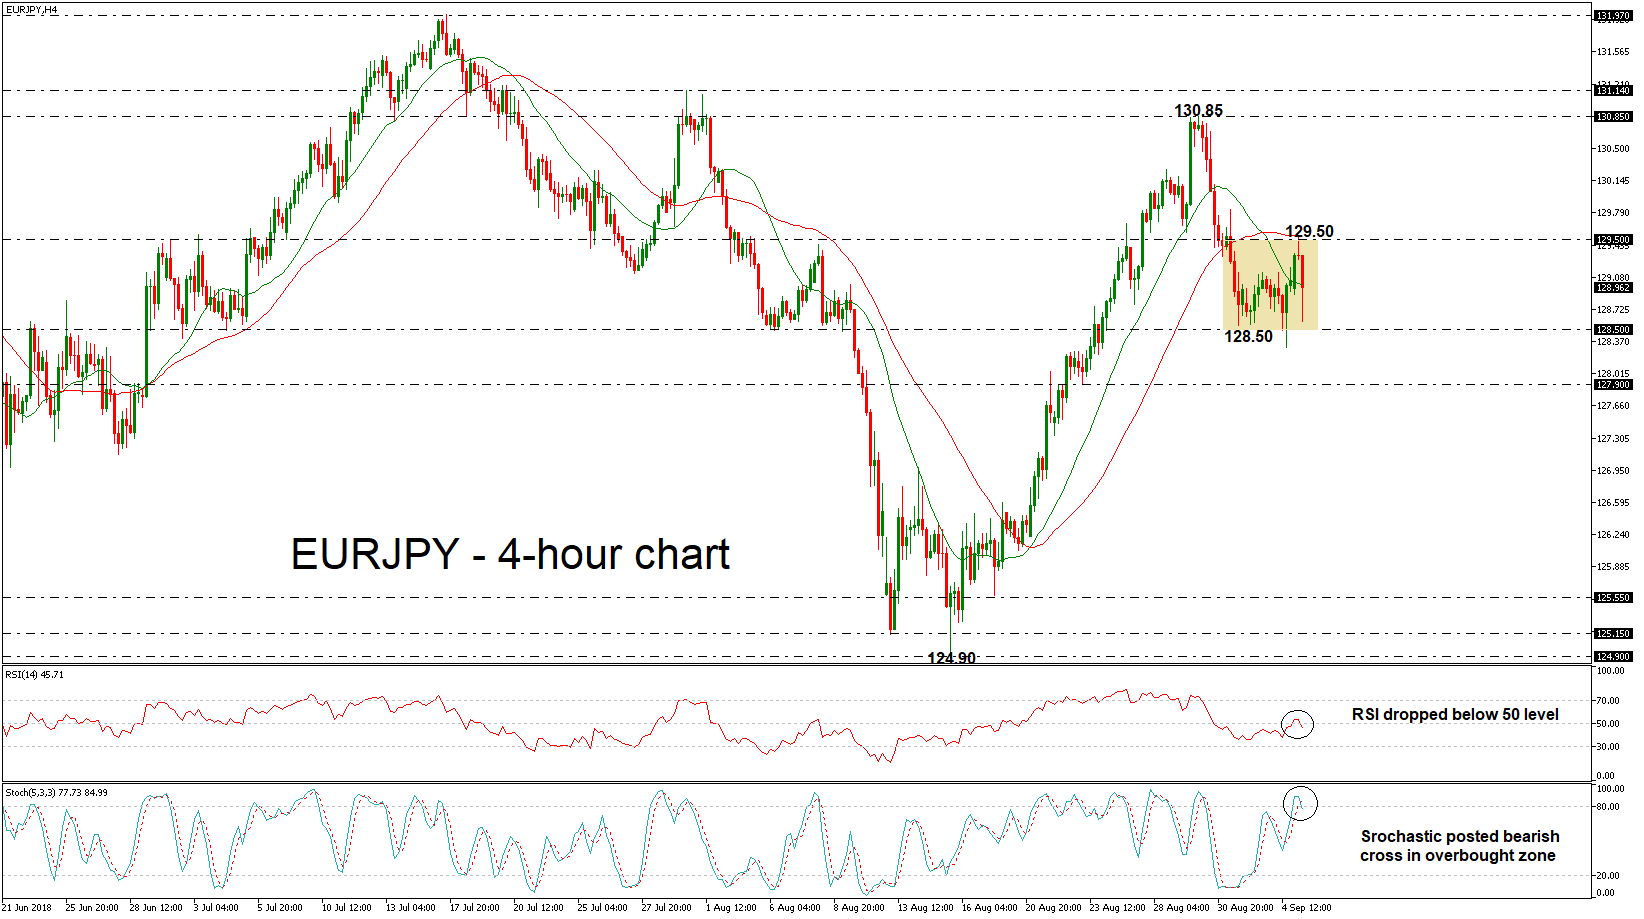
EURJPY has been moving sideways since the soft rebound on the 128.50 support level in the previous couple of days. Currently, the price is moving sharply lower, below 129.00, and is standing below the 20- and 40-simple moving averages (SMAs) in the 4-hour chart, while the technical indicators are signaling further losses. The RSI indicator slipped below the threshold of 50 and the %K line of the stochastic oscillator recorded a bearish crossover with the %D line in the overbought zone.
If the bears manage to take charge, then the expectation is for another test of the 128.50 barrier. A break of this key level, which is the lower boundary of the narrow range, would confirm a downside tendency and may pave the way towards the 127.90 obstacle.
On the flip side, a retest of the upper boundary of 129.50, which overlaps with the 40-SMA is possible. A clear jump above this level would bring the pair above the near-term consolidation area and move towards the 130.85 resistance region, taken from the high on August 30.
To sum up, the market is expected to hold neutral in the short-term and bearish in the medium-term.
Gold Looks Neutral In The Short-Term, Remains Bearish In The Medium-Term
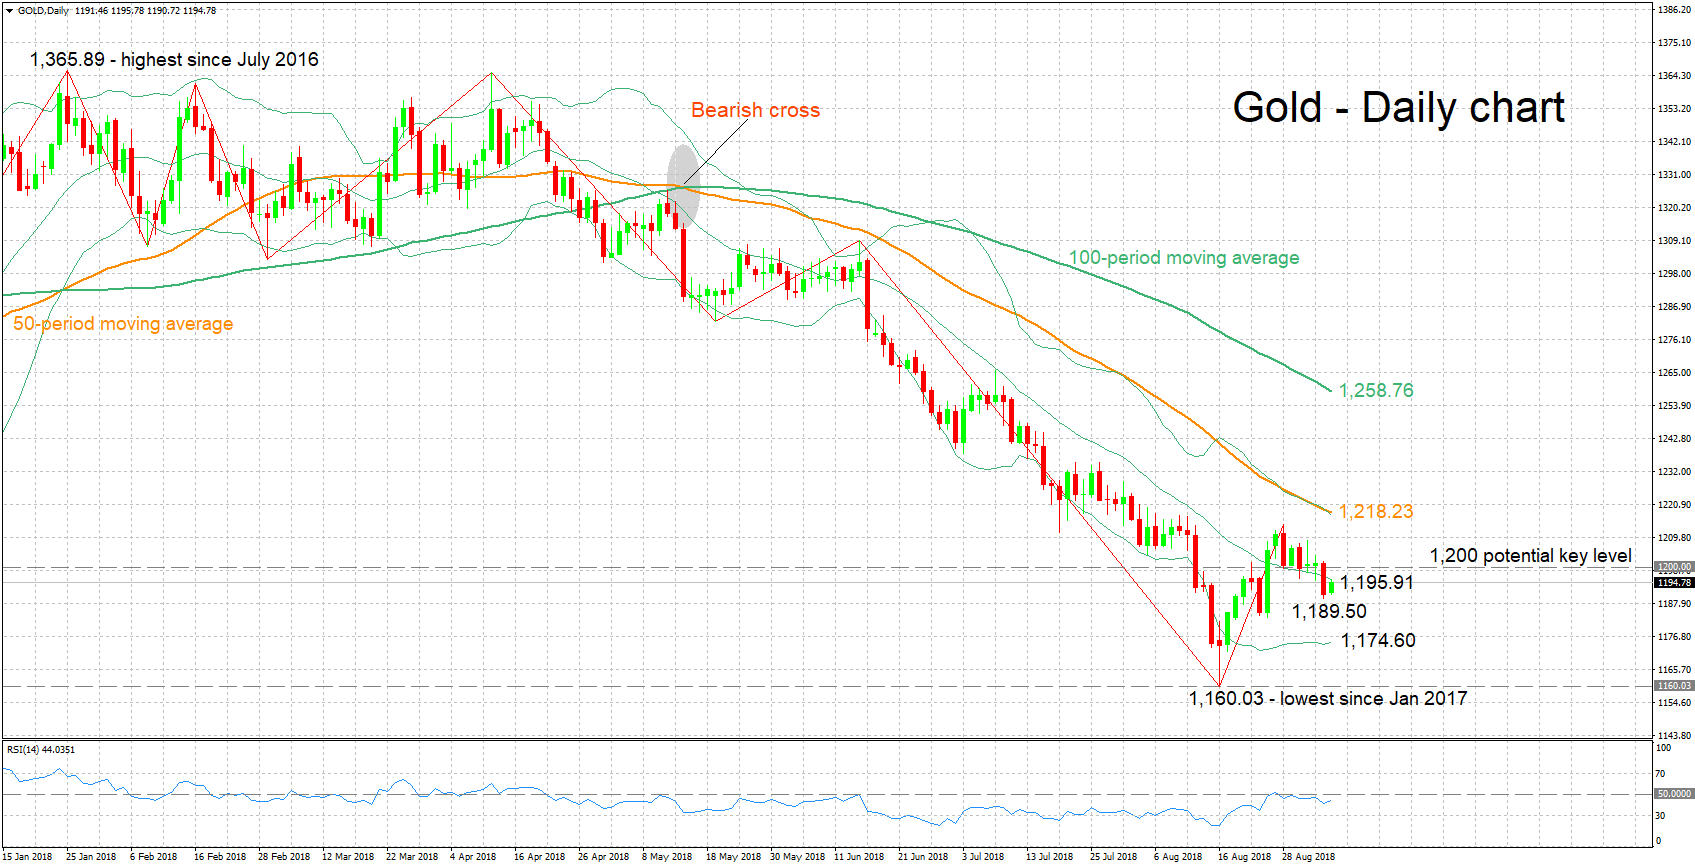
Gold gained some ground on Wednesday after touching a near two-week low of 1,189.50 the previous day.
The RSI is largely moving sideways in support of a neutral picture in the short-term.
Given a move above the middle Bollinger line – a 20-day moving average line – at 1,195.91, additional resistance to advances may come around the 1.200 mark which may hold psychological significance. Further above, the focus would shift to the area around the current level of the 50-day MA at 1,218.23; this is where the upper Bollinger band also lies, while the zone around this encapsulates the four-week high of 1,214.15 recorded in late August as well.
On the downside, immediate support may occur around Tuesday’s near two-week low of 1,189.50, while further below the region around the lower Bollinger band at 1,174.60 would be eyed. Lower still, 1,160.03, the precious metal’s lowest since January 2017 hit around mid-August would come into scope.
The medium-term picture is clearly bearish, with trading activity taking place below the 50- and 100-day MA lines and confirming the negative signal given by May’s bearish cross when the 50-day MA moved below the 100-day one.
Overall, the near-term bias appears neutral, while the medium-term outlook is bearish. For perspective, the yellow metal lost 14.3% after touching its highest since July 2016 in late January and is trading lower by 9.0% in the year-to-date.
Tale of Two Crises – Comparing Argentina and Turkey
Since our last discussion in May, the financial situation in Argentina has not improved. Rather, it has deteriorated rapidly over the past few months. Last week, President Mauricio Macri announced that he had asked the IMF to accelerate disbursement of its 3-year stand-by loan worth of US$ 50B, after securing US$ 15B of funding in June.
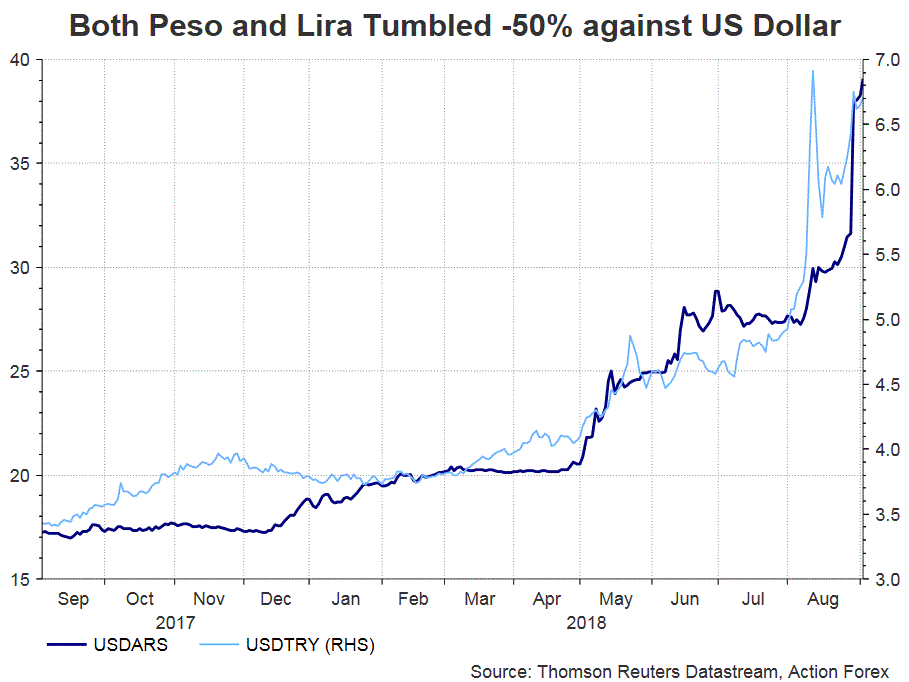
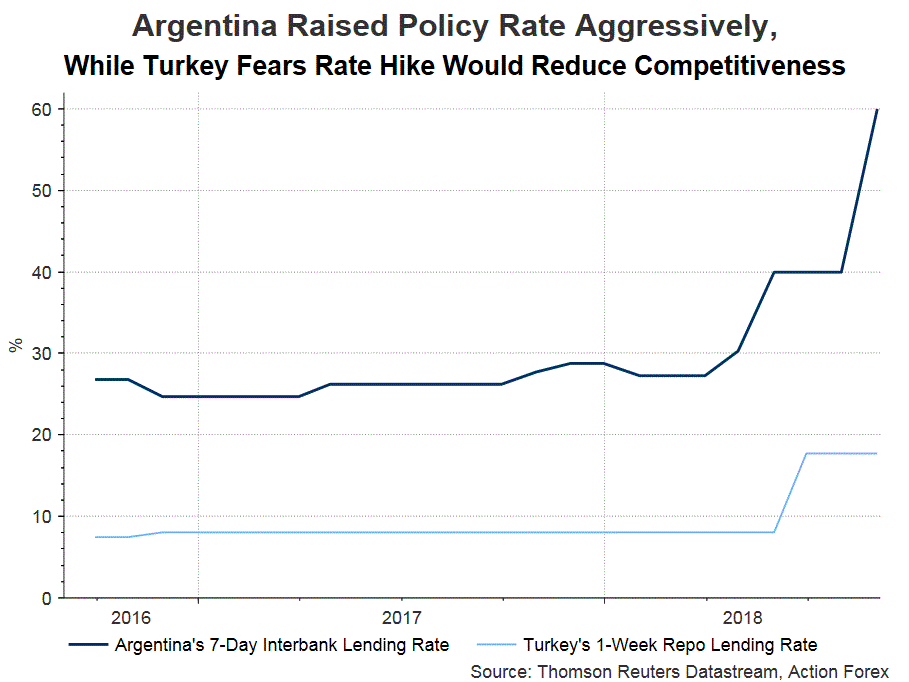
The news sparked concerns over the country’s ability to refinance and repay its debts. Peso sank, tumbling -19% against USD, despite the world’s highest interest rate at 60%. Since the beginning of the year, Peso has halved its value against the greenback.
Many has associated the debt-ridden Argentina with Turkey. Yes, both are among the biggest emerging economies, experienced crises and received IMF assistance back in early 2000s. Both both are debt-ridden and stricken by the collapse of market confidence in the current crisis. Yet, the two crises are not entirely the same.
Similarities:
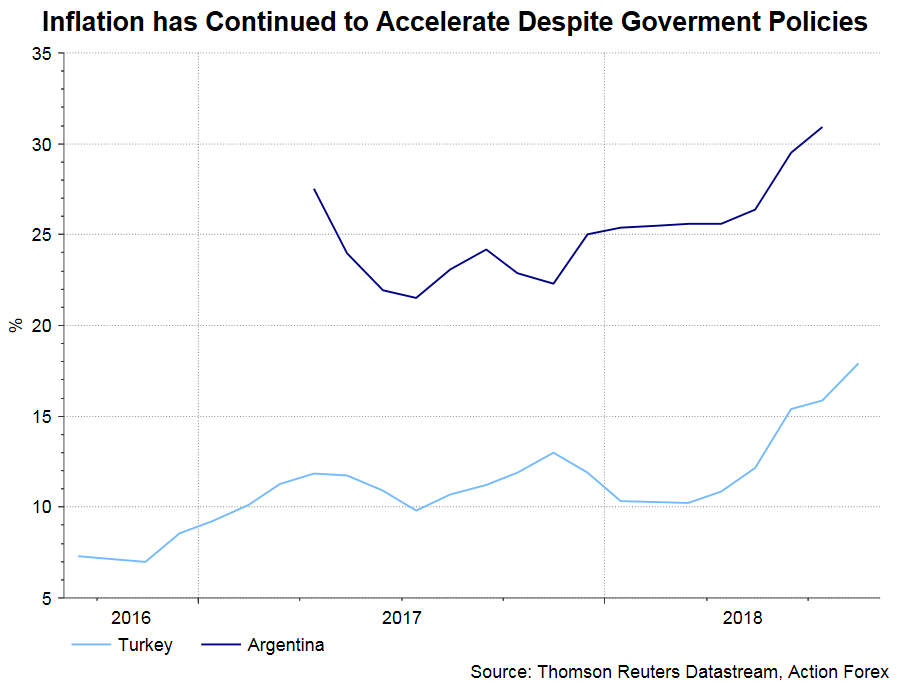
On the economic front, inflation is high in both countries.
Argentina has been suffering from high inflation which has surpassed +30% y/y in July, compared with an average of +25% in 2017. It is, however, eased from +40% in 2016.
For Turkey, the latest figure shows that headline CPI has hit 18% y/y in August, from 17% in the prior month.
Both countries are struggling with high debts and are sensitive to foreign investments.
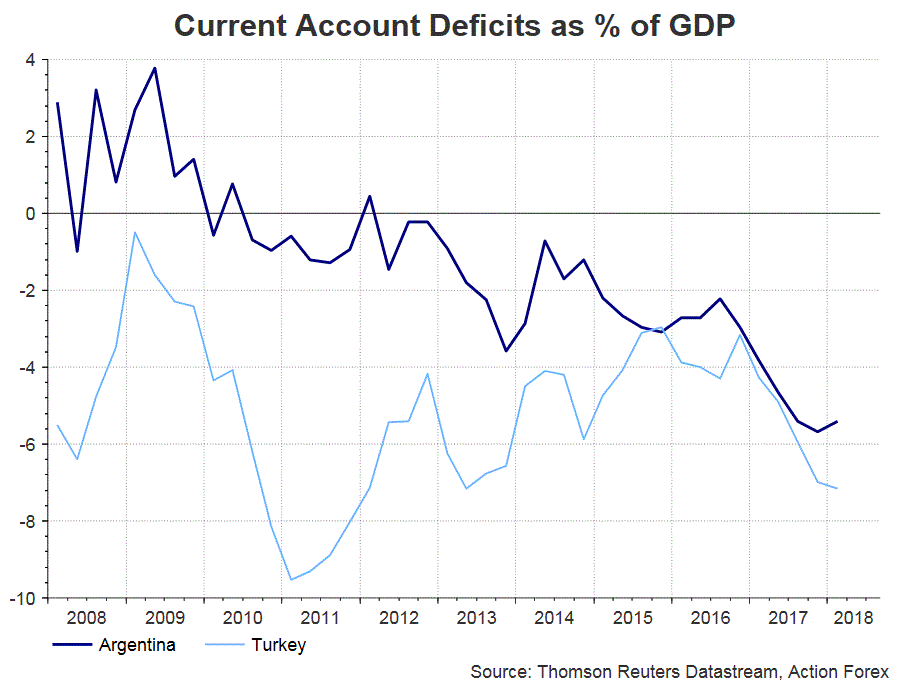
Argentina’s record high current account deficit has exceeded 5% of GDP and about 39% of the country’s total exports. It is estimated that the country’s primary fiscal deficit stands at 2.7% of GDP this year and 1.3% in 2019. The latest plan is to bring it to 0% by next year (previously by 2020). The country has been financing much of its fiscal deficit (3.9% of GDP in 2017) with FX-denominated public debt, which has taken up around 65% of the total. The government has determined to trim its fiscal deficit level, via a series of reforms including reduction in spending and tariff. The path could be challenging, in particular ahead of the general election next year.
Turkey’s current account deficit is about 7% of GDP, one of the largest among emerging markets.
Differences:
The two countries handle the crisis differently.
Notwithstanding the painful experience back in 2001, it appears that Argentina is still willing to comply with IMF's plan and implement austerity measures to lower deficit. As mentioned above, the government has pledged to eliminate deficit by 2019. Besides, it has planned to accelerate the stringent fiscal tightening measures including re-imposition of export tax and delay of planned tax cuts to soy exports and corporate profits. Government spending would also be reduced. Meanwhile, in order to rescue the currency from panic selling, the central bank has been responsive and adopted rate hikes several times this year.
On the contrary, declaring himself the “enemy of interest rate”, Turkish President Erdogan has refrained of raising interest rate since his re-election. The central bank, now controlled by Erdogan and his protégé, focused on injecting liquidity to the market – a tool that should send inflation higher. The government earlier this week pledged the revise the monetary policy later this month, with the market speculating that a rate hike might be implemented next week.
The trigger points for the recent crises are different.
For Argentina, the situation has deteriorated markedly after Macri surprisingly announced in Youtube that he has requested the IMF to front-load the loans. This was accompanied with no statement from the IMF until some time later. IMF's statement was vague itself, without guidance on the current situation of Argentina. We would say the problem of communication and the way Macri handled the situation have caused the deterioration of the situation.
In Turkey, the diplomatic dispute with the US was probably the last straw that. The major problem lies on Erdogan's policies. No matter what the causes are, the underlying reason for the downward spiral to continue is the "crisis of confidence". While it appears obvious that the top priority is to restore market confidence, finding a way out is no easy task.
GBPUSD Back Under Preesure Despite Data Beat
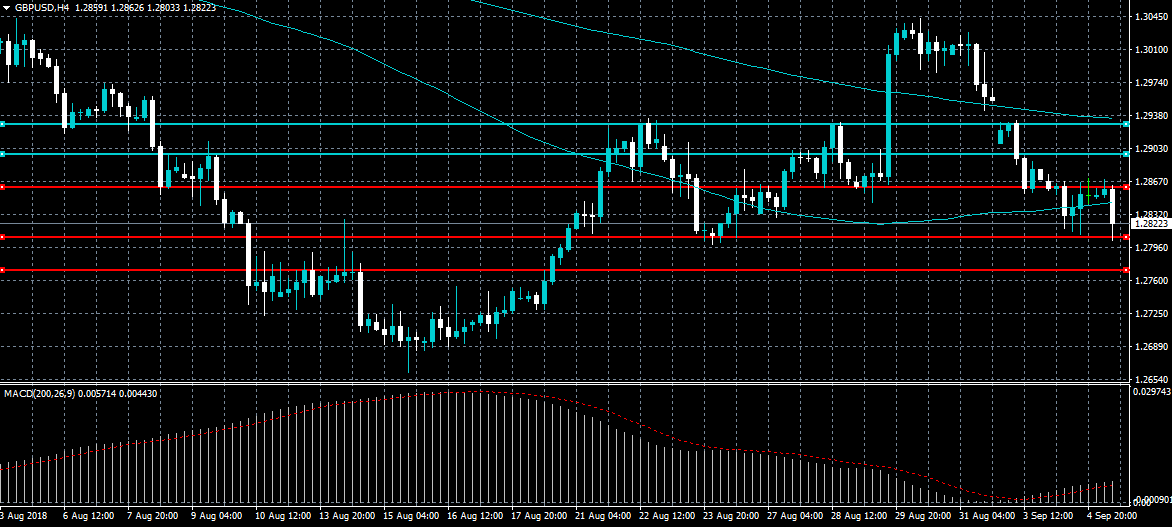
The British pound has fallen to a fresh monthly trading-low against the US dollar during the European trading session, hitting 1.2802. The GBPUSD pair remains under selling pressure despite the UK Services PMI beating market expectations with a 54.3 reading. Sellers will continue to target below the 1.2800 support level, while buyers need to push the price above the 1.2863 to stabilize the decline.
The GBPUSD pair is strongly bearish while trading below the 1.2810 level, key support is now found at the 1.2775 and 1.2750 levels.
If the GBPUSD pair moves above the 1.2863 level, buyers are likely to target the 1.2900 and 1.2930 levels.
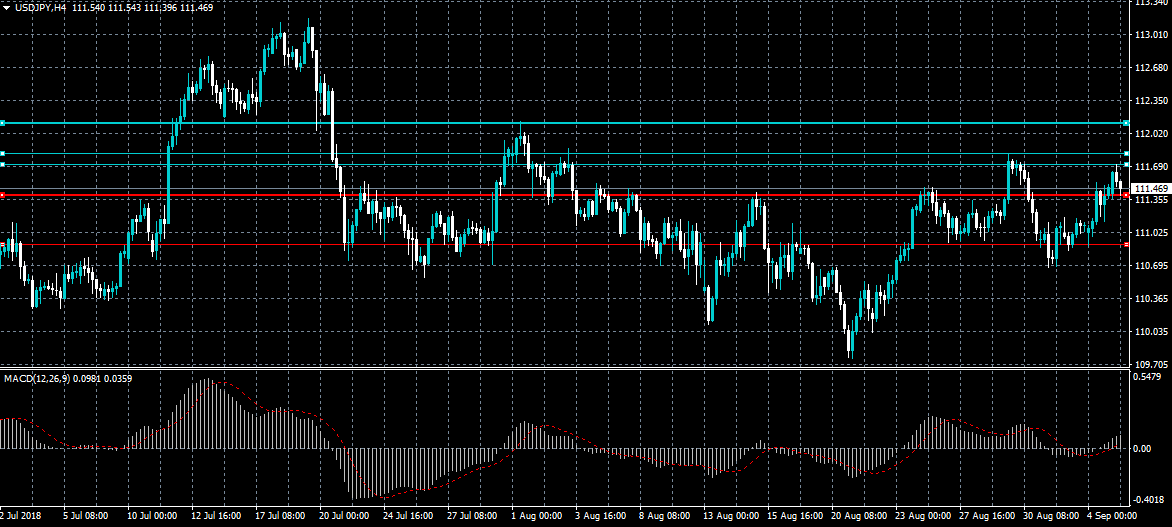
USDJPY Bulls Need To Break 111.80
The US dollar continues to trade to the upside against the Japanese yen currency on Wednesday, with price earlier hitting 111.70. The sentiment surrounding the USDJPY pair received a boost after the US ISM Manufacturing survey climbed to a fourteen-year high. Buyers need to break above the 111.80 to keep the momentum intact, while sellers need to break the 110.90 support level to change the short-term trend.
The USDJPY pair remains bullish while trading above the 111.39 level, key resistance is found at the 111.80 and 112.05 levels.
If the USDJPY pair trades below 110.90 level, sellers will likely test the 110.68 and 110.10 support regions.
EUR/USD Analysis: Stopped By The 55-Hour SMA
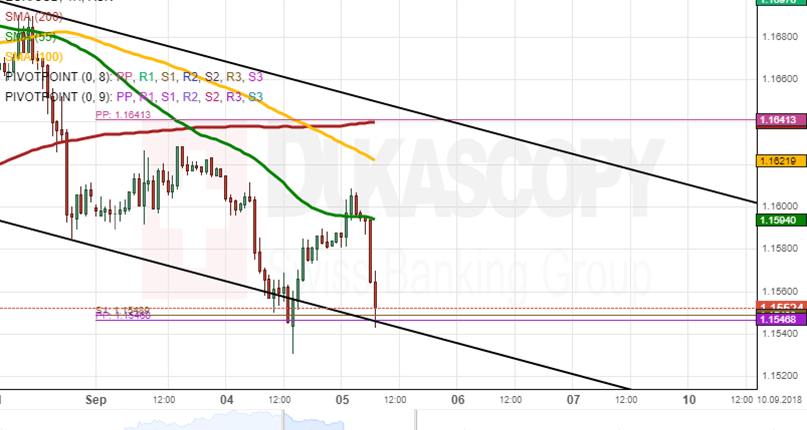
The European Single Currency depreciated 0.26% since Tuesday's trading session. The exchange currency rate was stopped by the 55-hour simple moving average, which took a role of a resistance for the currency during morning hours.
In regards to the near future, the European Single Currency will continue to move sideways until it meets the weekly PP at the 1.1546 mark and the weekly S1 at the 1.1549 mark. It is expected that the currency should be stopped by the strong support level of the weekly S1 and the weekly pivot point.
In another scenario, the rate might break the trend-line and push the rate to go upwards to the 100-hour simple moving average at the 1.1623 mark.
GBP/USD Analysis: Remains Above 1.28
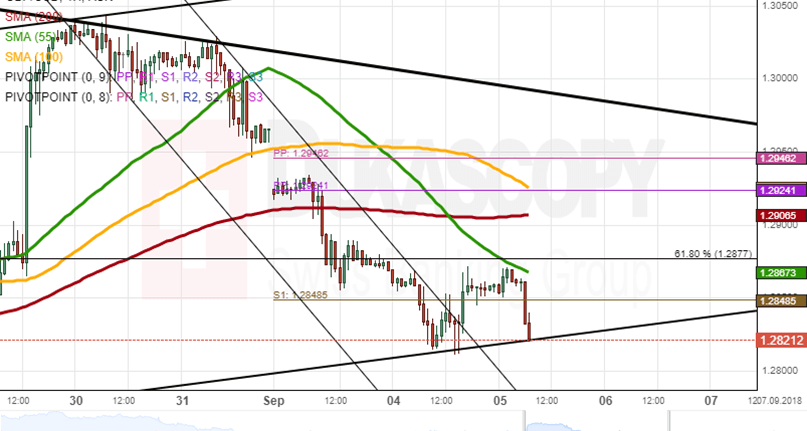
The British pound depreciated against the US Dollar 0.18% since Tuesday's trading session. The rate tried to recover itself from bearish movements during morning hours.
Most likely, the rate will break the support line of a medium channel during today's trading session due to a strong resistance of the 55-hour simple moving average, which is located above the currency exchange rate near 1.2870.
On the other hand, the British pound may use the support line of the pattern as a support level and try to push the rate upwards, which may break the 55-hour simple moving average at the 1.2870 level.
USD/JPY Analysis: Breaks A Large Channel
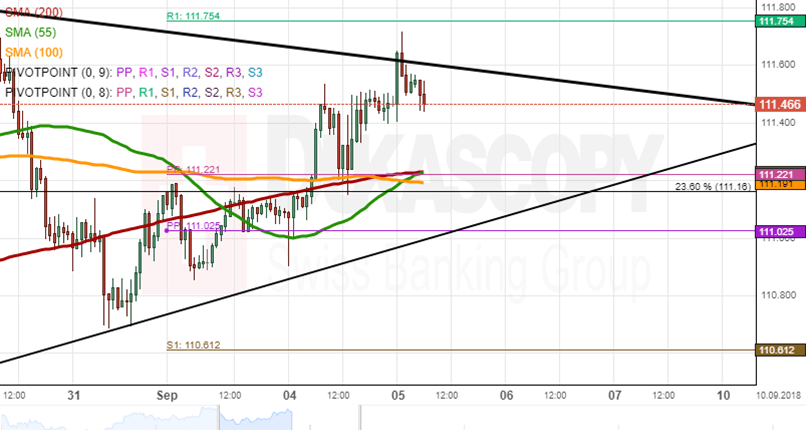
The US Dollar appreciated 0.47% against the Japanese Yen since Tuesday's session. The currency exchange rate experienced the 55-hour and 200-hour SMAs squeeze breakout which lead the rate to move upwards during Wednesday's morning hours.
In theory, the rate should take the upper boundary of the large channel as a resistance barrier and bounce off the line to move backwards into the channel.
However, the USD/JPY could break the large channel and go up towards the weekly R1 at the 111.75 level.