Sample Category Title
EUR/AUD Daily Outlook
Daily Pivots: (S1) 1.6004; (P) 1.6044; (R1) 1.6103; More....
EUR/AUD surges to as high as 1.6123 so far and intraday bias remains on the upside. Current rally should target 100% projection of 1.5271 to 1.5886 from 1.5601 at 1.6216, which is close to 1.6189 high. On the downside, below 1.5983 resistance turn support will turn intraday bias neutral and bring consolidation first, before staging another rally.
In the bigger picture, EUR/AUD drew strong support from 55 week EMA and rebounded. And the development argues that medium term rally from 1.3624 (2017 low) is still in progress. Firm break of 1.6189 will target a test on 1.6587 (2015 high). On the downside, break of 1.5601 support will now be the first sign of medium term reversal, and will bring a test on 1.5271 key support for confirmation.


EUR/CHF Daily Outlook
Daily Pivots: (S1) 1.1284; (P) 1.1328; (R1) 1.1353; More...
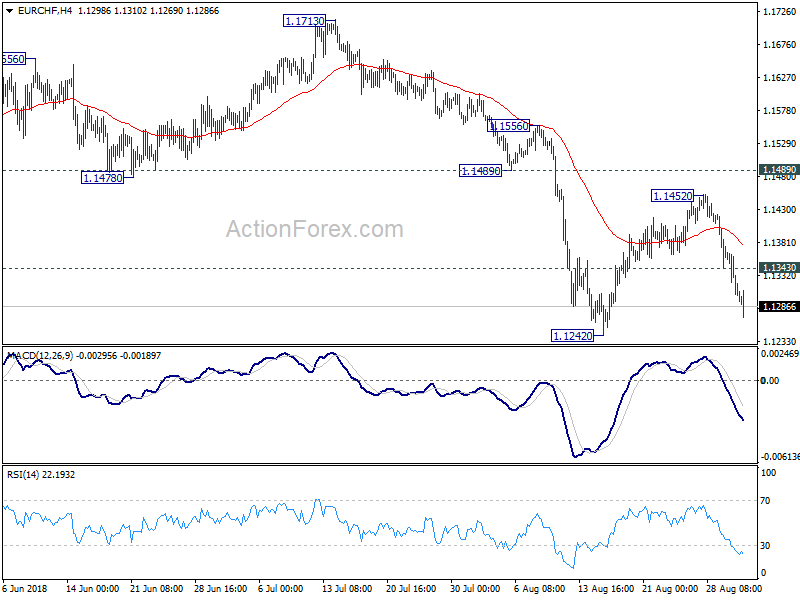
EUR/CHF's fall from 1.1452 continues today and reaches as low as 1.1269 so far. Intraday bias remains on the downside for 1.1242 low first. Break will bring a test on key support zone at 1.1154/98. On the upside, above 1.1343 minor resistance will turn intraday bias neutral first. In that case, more range trading would likely be seen above 1.1242 in the near term.
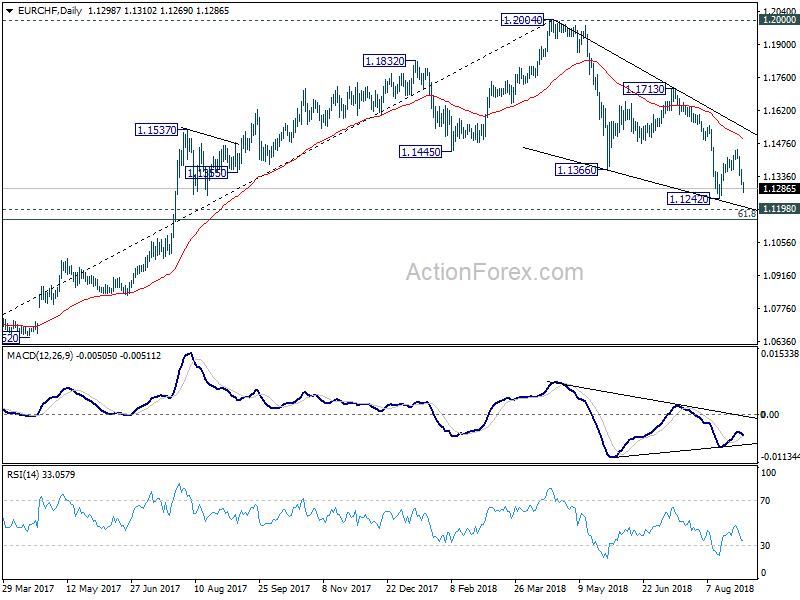
In the bigger picture, for now, the price actions from 1.2004 medium term top is seen as a correction only. Downside should be contained by 1.1198 (2016 high), 61.8% retracement of 1.0629 to 1.2004 at 1.1154 to complete it and bring rebound. This cluster level is in proximity to long term channel support (now at 1.1189) too. A break of 1.2 key resistance is still expected in the medium term long term. However, sustained break of the mentioned support zone will mark reversal of the long term trend.
EURUSD Head And Shoulders Pattern In Play
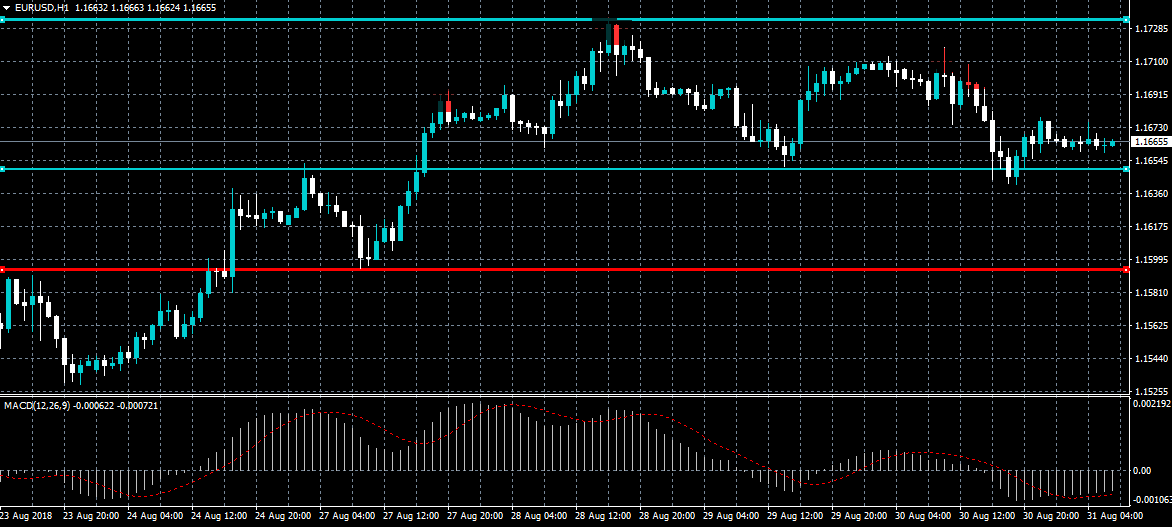
The euro is trading on the back foot against the US dollar on Friday after the United States economy posted much better than inflation data during yesterday’s US session. The EURUSD pair is intraday bearish while trading below the 1.1681 level and continues trade within a bearish head and shoulders pattern. Financial market participants now look to key Inflation and Unemployment data from the eurozone economy.
The EURUSD pair is intraday bearish while trading below the 1.1681 level, key support is found at the 1.1640 and 1.1590 levels.
If the EURUSD pair moves above the 1.1681 level, buyers are will likely to test towards the 1.1700 and 1.1730 support levels.
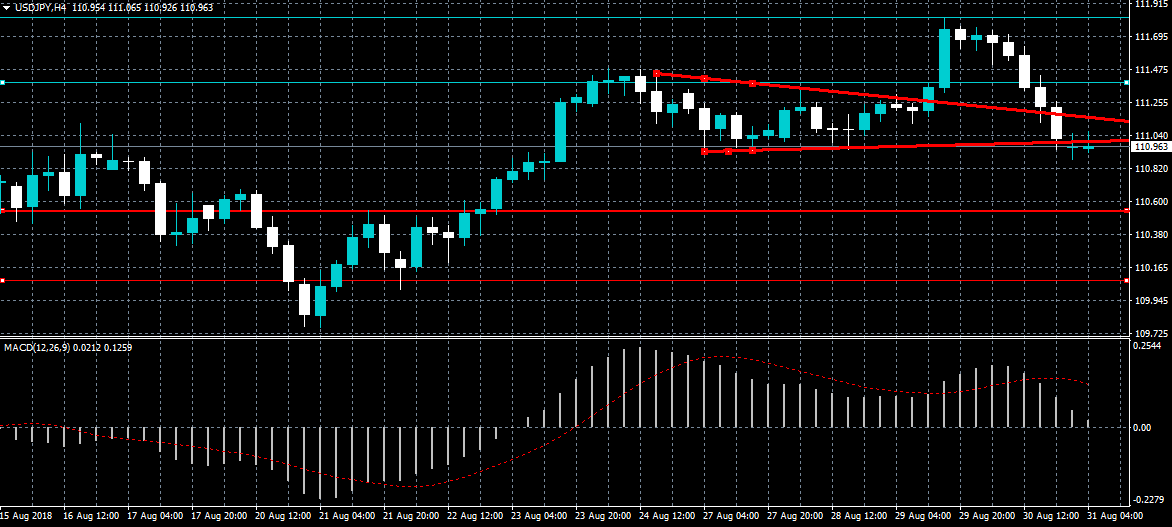
USDJPY Turns Intraday Bearish Below 111.10
The US dollar has erased earlier gains against the Japanese yen, as global equity markets turn lower over growing concerns about emerging market economies. The USDJPY pair has been hurt by growing risk-off trading sentiment, as traders seek the safety of the Japanese yen. Selling pressure is likely to remain on the USDJPY pair while price continues to trade below the 111.10 level.
The USDJPY pair is bearish while trading below the 111.10 level, key support is found at the 110.90 and 110.55 levels.
If the USDJPY pair trades moves above the 111.10 level, buyers may once again test towards the 111.39 and 111.80 resistance levels.
Bitcoin Rises As Traders Peg Their Hopes On The Sec
Greed and fear are the main drivers of the financial markets. This has been particularly true of the crypto market recently. In 2017, greed pushed the price of Bitcoin from $600 to $19,000. Other currencies performed better. This year, however, fear has taken over and cryptocurrency investors are starting to worry about the value of their holdings. The key concerns about Bitcoin are its volatility, its cost, its safety, and its reliability. Therefore, risk-averse companies are afraid of accepting a currency whose value can fall by more than 10% within a day.
The price of Bitcoin has been volatile this month and the movement has been attributed to several factors. Firstly, there was a sell-off as traders who benefited from the announcement by BlackRock last month took profits. Secondly, the decision by the SEC to reject the nine ETF proposals was demoralizing to many traders. This week, however, the price has been recovering as SEC announced that it would review its decision. Thirdly, there were concerns about the increased wave of short-selling. A Recent Commitment of Traders (COT) report showed that more retail, commercial, and non-commercial traders were increasing their short bets on Bitcoin.
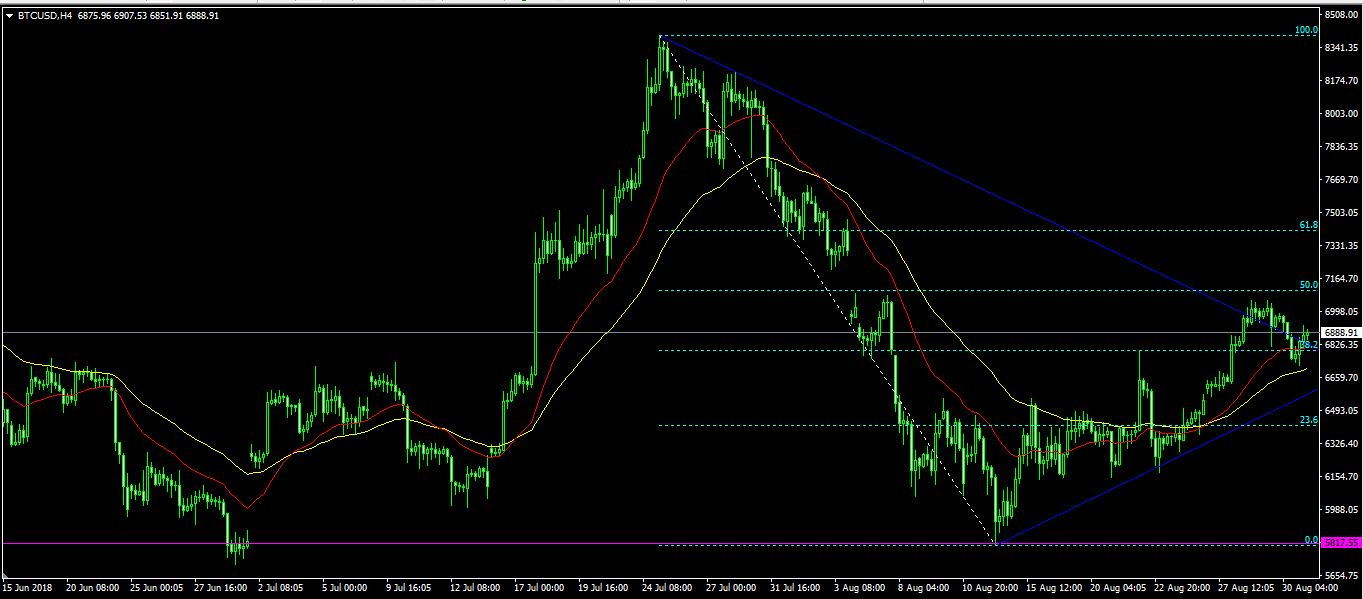
On Monday, the short-term EMA (25) crossed the longer-term EMA (50) as shown below. Since then, the pair has continued to move up, reaching a two-week high of 7050. It is now trading slightly lower at 6890, which is along the 38.2% Fibonacci Retracement level. As the new month starts, there is a likelihood that the pair will move up to test the 7120 level, which is also the 50% Fibonacci retracement level.
Eurozone Data Takes Centre Stage
The economic calendar features a slew of market-moving headlines on Friday, with the Eurozone representing the lion's share of activity.
Action begins at 06:45 GMT with the latest reports on French consumer and producer inflation. From there, investors will assess Spanish retail sales and Italian CPI inflation. Italy will also present the latest unemployment figures at 09:00 GMT.
The European Commission's statistical agency will report on the unemployment rate at 09:00 GMT. Eurozone unemployment is forecast to fall slightly to 8.2% in July compared with 8.3% the previous month.
At the same time, Eurostat will also report on the Eurozone consumer price index for July. Consumer inflation in the 19-member currency region is forecast to come in at 2.1% annually in August. Core inflation is projected at 1.1%, according to analysts.
Ahead of the North American session, investors can expect a revised reading on Italian GDP for the second quarter.
In North America, ISM-Chicago will release the closely-watched Chicago purchasing managers' index (PMI) at 13:45 GMT. Just 15 minutes later, the University of Michigan will release its final reading of the consumer sentiment index. According to analysts, the revised reading is expected to show a slight improvement at 94.4
Earlier in the session, the Chinese government reported better than expected PMI data, a sign the world's second-largest economy was slowly regaining momentum. The National Bureau of Statistics' manufacturing PMI strengthened to 51.3 in August from 51.2 the previous month. The services PMI gauge improved 0.2 point to 54.2.
AUD/USD
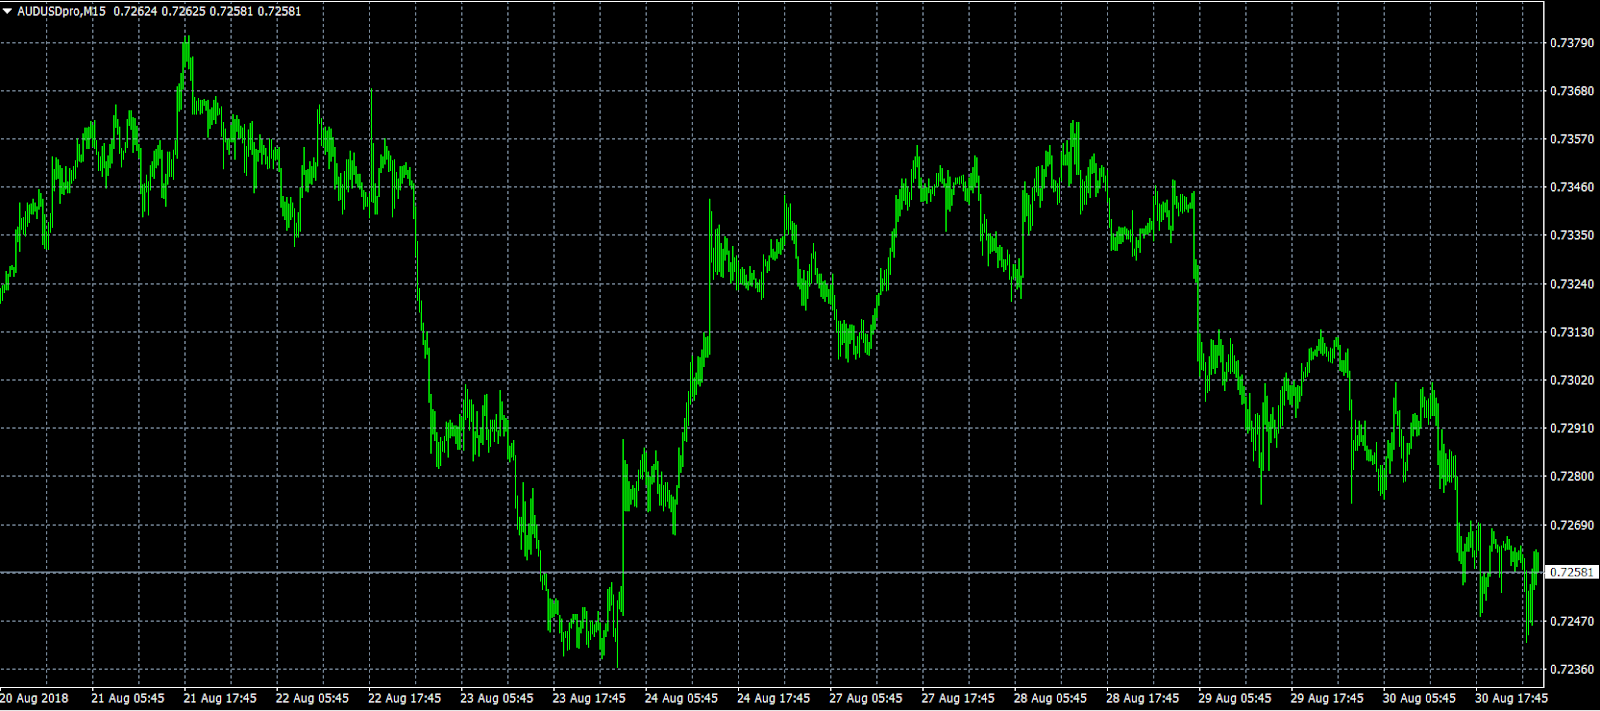
After an impressive recovery attempt, the Australian dollar has once again fallen on hard times. The AUD/USD exchange rate is down nearly 100 pips from its recent high and is now forming a double-bottom in the mid-0.7200 range. At the time of writing, the AUD/USD exchange rate was trading at 0.7263, where it was little changed compared with the previous close. The pair faces immediate support at 0.7200.
EUR/USD
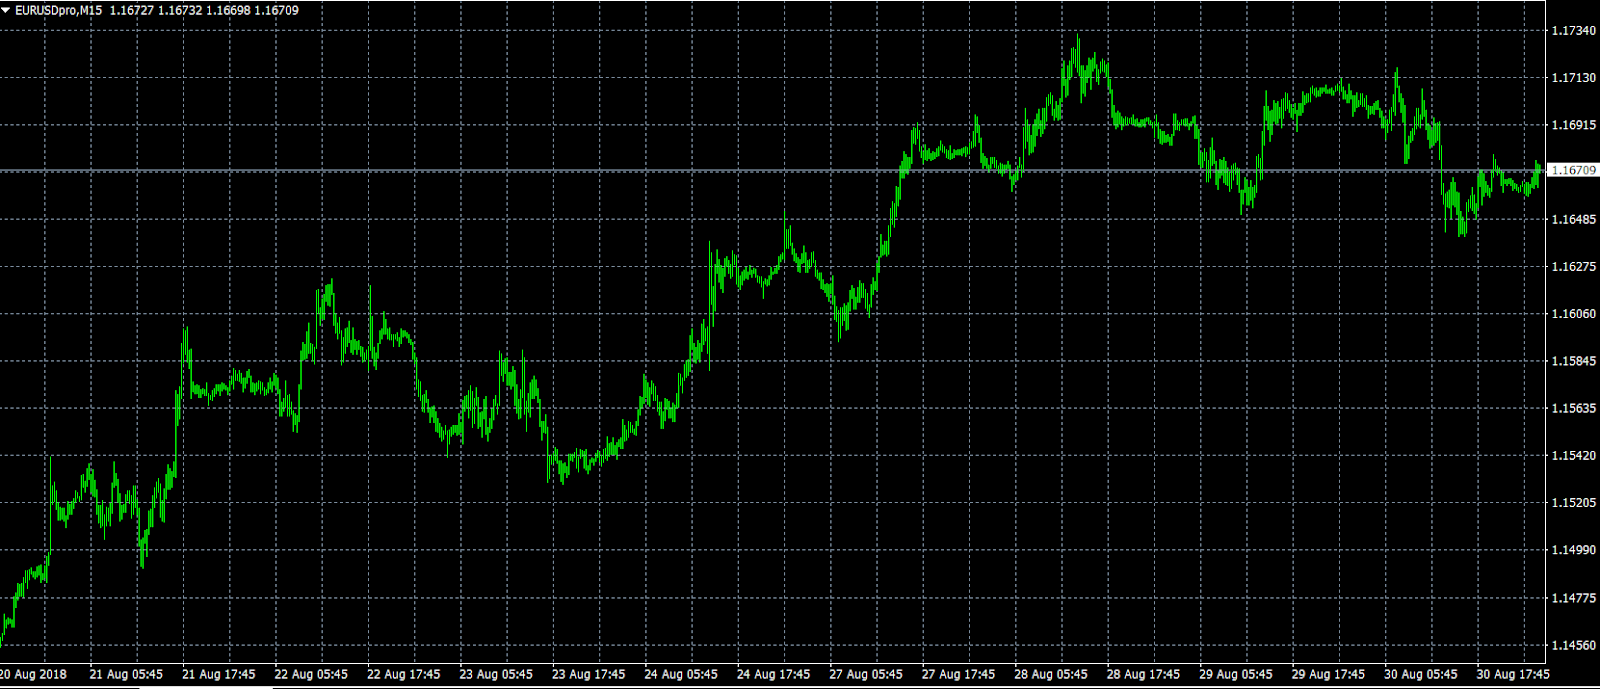
Europe's common currency continues to trade comfortably in the 1.1670-1.1700 region after maxing out at 1.1734 earlier in the week. At press time, the EUR/USD currency pair was holding steady at 1.1671. From a technical perspective, the pair faces immediate support at 1.1538, which corresponds with the 21-day simple moving average. On the opposite side of the ledger, immediate resistance is located at 1.1745.
GBP/USD
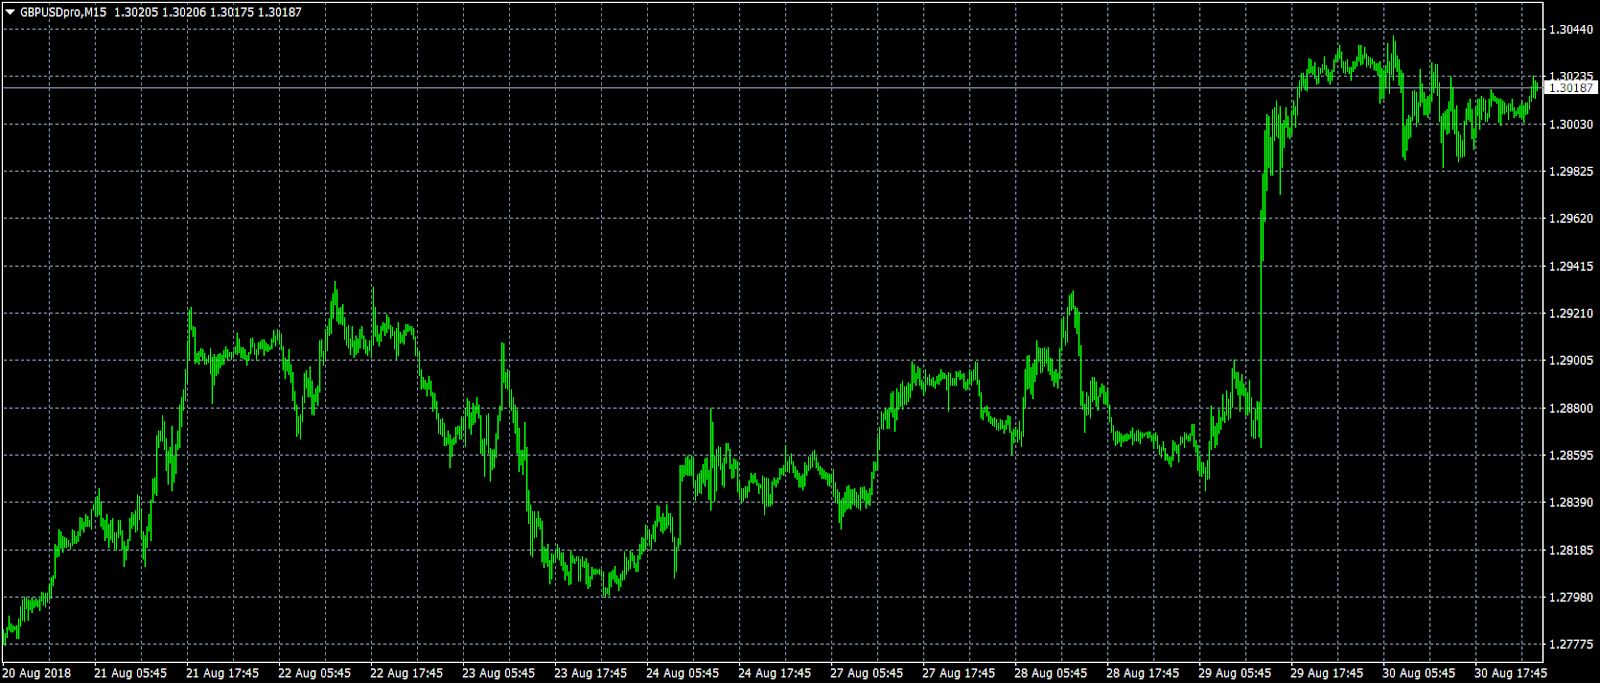
Cable has flatlined near four-week highs, a sign that the bulls were gradually running out of steam. The GBP/USD exchange rate currently sits at 1.3020, where it was up slightly compared with the previous close. In terms of technical indicators, the pair faces immediate support at 1.3000, which also corresponds with the 61.8% Fibonacci retracement. On the flipside, the immediate resistance is at 1.3057.
DAX30 Bullish SHS Breakout Has Been Completed
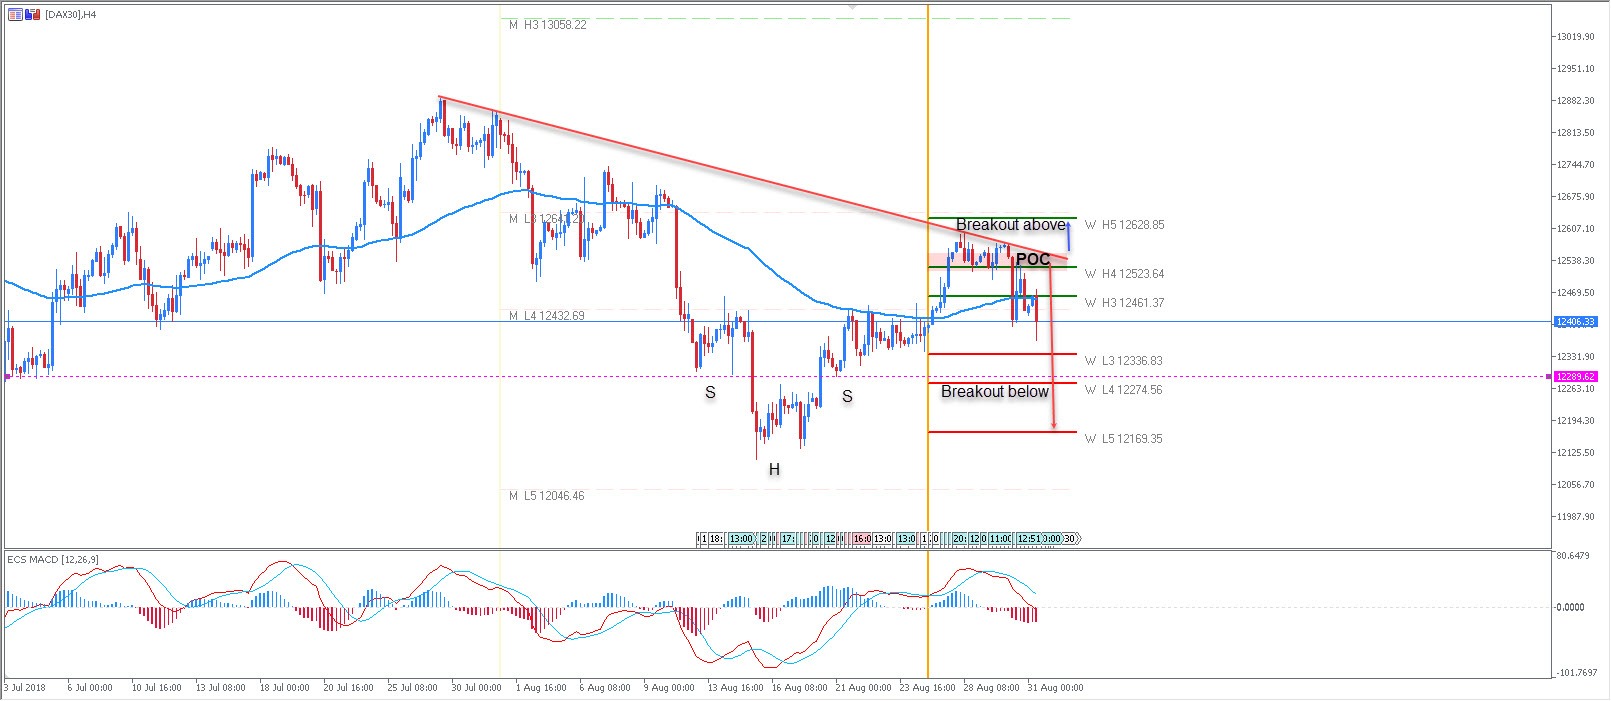
The DAX30 has completed a breakout of a bullish SHS pattern and the price is rejecting the trend line below the W H5 Pivot. At this point we might expect further rejections as long as the price is below the trend line. Breakout below 12289 and we might see 12169. Only a breakout above the trendline will be bullish for the price and in that case the target is 12628.
W L3 - Weekly Camarilla Pivot (Weekly Interim Support)
W H3 - Weekly Camarilla Pivot (Weekly Interim Resistance)
W H4 - Weekly Camarilla Pivot (Strong Weekly Resistance)
M H4 - Monthly Camarilla Pivot (Very Strong Monthly Resistance)
M L3 – Monthly Camarilla Pivot (Monthly Support)
M L4 – Monthly H4 Camarilla (Very Strong Monthly Support)
POC - Point Of Confluence (The zone where we expect the price to react - aka the entry zone)
GBPUSD Outlook: Weekly Close Above 1.30 Would Signal Further Upside
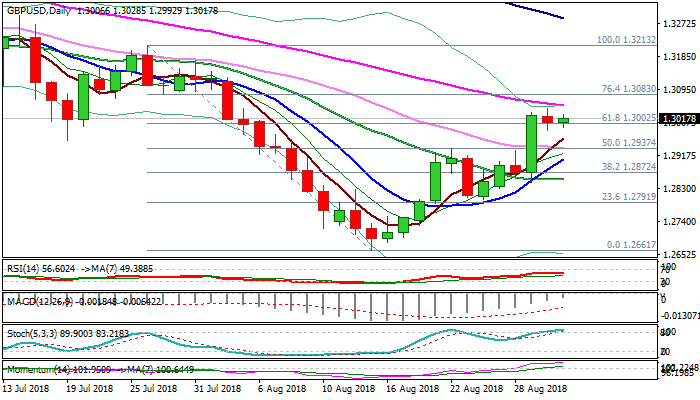
Cable remains firm and holding above 1.30 on Friday but lacks strength for attack at pivotal barrier at 1.3052 (falling 55SMA).
Momentum remains strong but starts moving sideways, with overbought slow stochastic, generating initial signal that bulls might be running out of steam. On the other side, weekly studies are improving (momentum created bull-cross and is running towards positive territory while slow stochastic is heading north after reversal from oversold territory) with the pair on track for strong weekly close (third straight bullish weekly close) which mark bullish signals.
Bullish signals need confirmation on weekly close above 1.30 (Fibo 61.8% of 1.3213/1.2661) to open way for break above 55SMA and extension of recovery rally from 1.2661 (15 Aug low) towards strong barrier at 1.3136 (daily cloud base).
Thick hourly cloud (1.2985/1.2944) underpins near-term action, with extended dips expected to find ground at 1.2940 zone (hourly cloud base, reinforced by 30SMA).
Res: 1.3052, 1.3083, 1.3136, 1.3173
Sup: 1.3000, 1.2985, 1.2940, 1.2907
EURUSD Outlook: Extended Consolidation Is Seen As Likely Scenario Before Bulls Resume
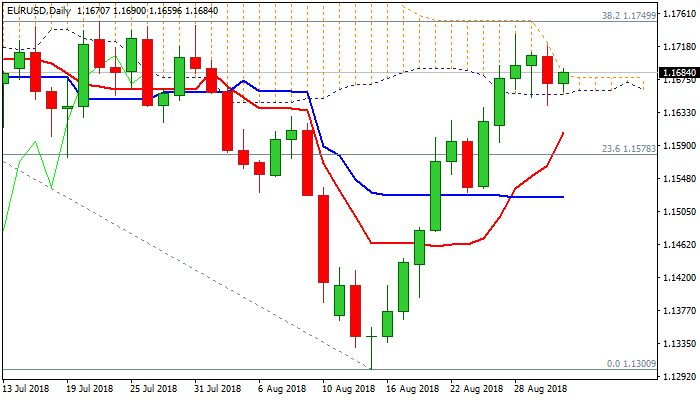
The Euro holds in a narrow range and within narrowing daily cloud in early Friday's trading, maintaining bullish bias despite Thursday's close in red. Overall bulls are showing signs of fatigue as slow stochastic reversed from overbought territory after forming bearish divergence, but downside attempts were so far limited by cloud base and strong momentum offsets bearish threats for now.
Positive signals are also developing on weekly chart, as the pair is on track for the third consecutive bullish weekly close with further bullish signal seen on close above weekly 10SMA (1.1620).
Extended consolidation is expected to be likely scenario as bulls look for a catalyst to continue higher.
However, deeper pullback cannot be ruled out as negative signals are developing, with bull-cross of 10/55SMA's offering solid support at 1.1620 zone and guarding pivotal support at 1.1568 (Fibo 38.2% of 1.1300/1.1733 rally).
Res: 1.1690, 1.1718, 1.1733, 1.1750
Sup: 1.1641, 1.1620, 1.1568, 1.1542
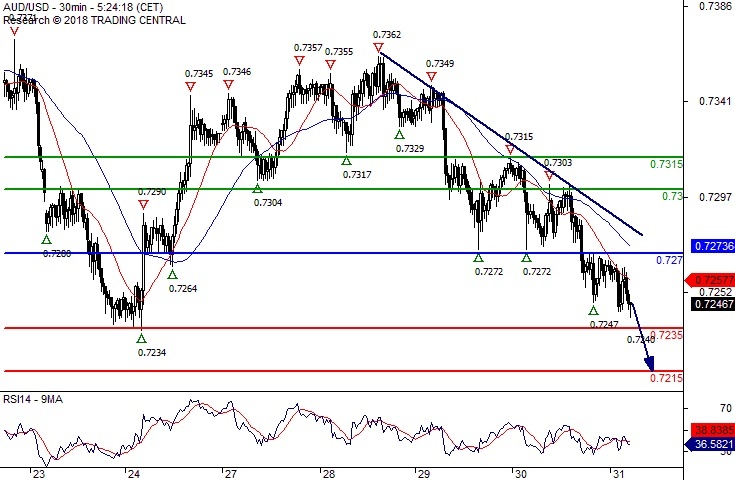
AUD/USD Under Pressure
Pivot (invalidation): 0.7270
Our preference Short positions below 0.7270 with targets at 0.7235 & 0.7215 in extension.
Alternative scenario Above 0.7270 look for further upside with 0.7300 & 0.7315 as targets.
Comment The RSI is bearish and calls for further downside.