Sample Category Title
GBP/JPY Daily Outlook
Daily Pivots: (S1) 143.99; (P) 144.83; (R1) 145.30; More...
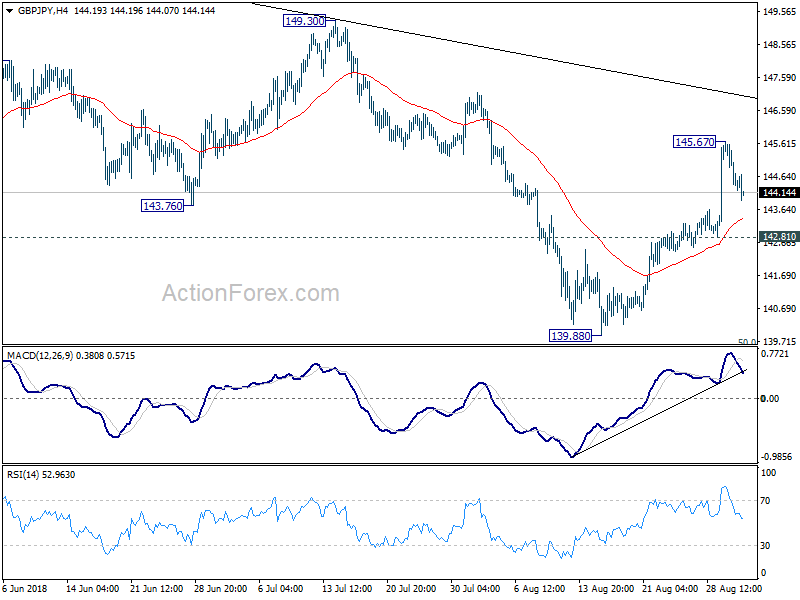
GBP/JPY formed a temporary top at 145.67 and intraday bias is turned neutral first. As long as 142.81 minor support holds, another rise is mildly in favor. Above 145.67 will target trend line resistance (now at 147.01). Firm break there will be a signal of bullish reversal and should target 149.30 resistance for confirmation. However, break of 142.81 will argue that the rebound form 139.88 has completed and turn bias back to the downside for 139.29/47 key support zone.
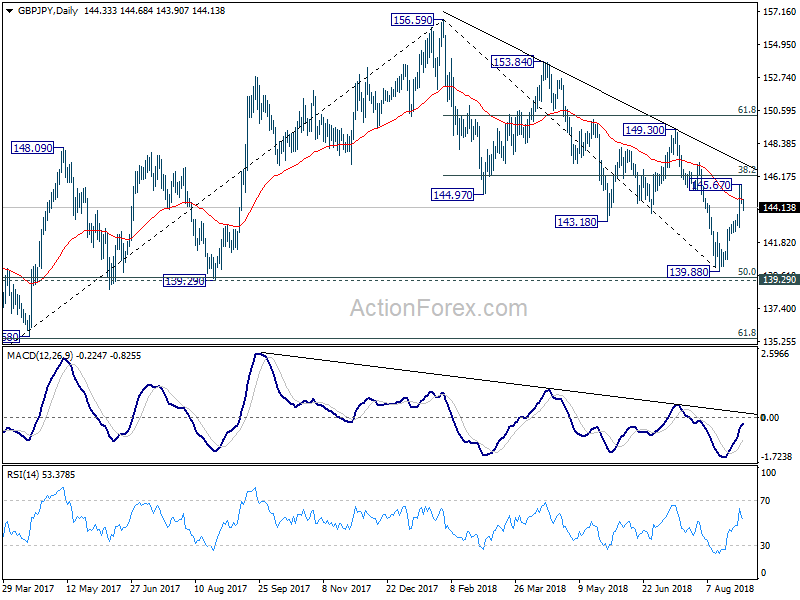
In the bigger picture, at this point decline from 156.59 is still seen as a corrective move. Focus remains on 139.29 cluster support (50% retracement of 122.36 to 156.59 at 139.47). Strong rebound from there will re-affirm the bullish case that rise from 122.36 is still to extend through 156.59 high. However, sustained break of 139.29/47 should confirm medium term reversal. GBP/JPY would then target a retest on 122.26 (2016 low).
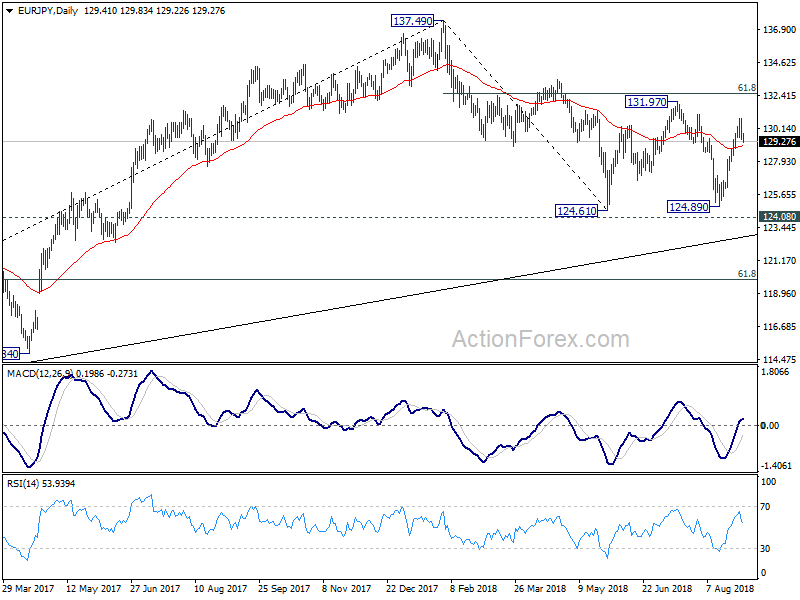
EUR/JPY Daily Outlook
Daily Pivots: (S1) 128.98; (P) 129.97; (R1) 130.51; More....
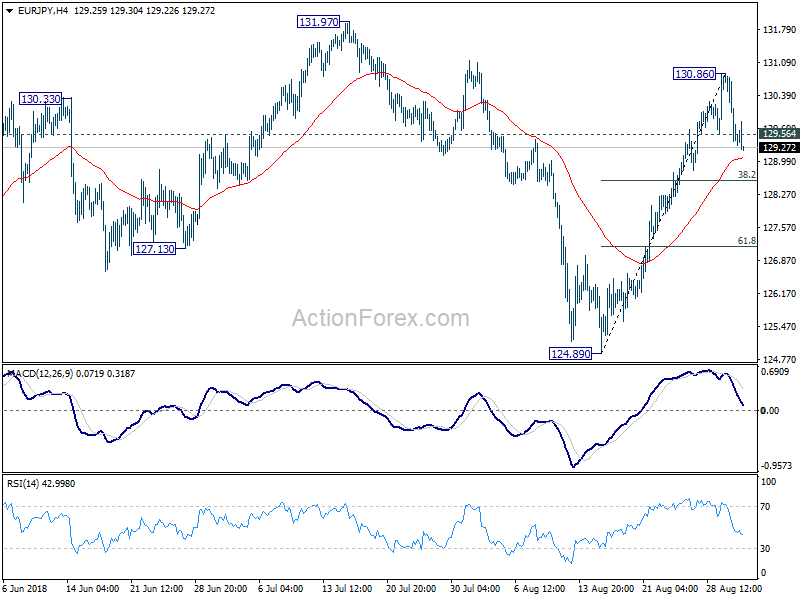
EUR/JPY's break of 129.56 minor support suggests temporary toping at 130.86. Intraday bias is turned neutral first. As long as 38.2% retracement of 124.89 to 130.86 at 128.57 holds, another rise is mildly in favor. Above 130.86 will target resistance zone between 131.97 and 61.8% retracement of 137.49 to 124.61 at 132.56. Break will indicate larger bullish reversal. However, firm break of 128.57 will argue that rebound from 124.89 has completed, and it's the third leg of consolidation pattern from 124.61. In that case, intraday bias will be turned back to the downside for 124.61 low.
In the bigger picture, EUR/JPY once again rebounded ahead of 124.08 key resistance turned support. It's also held above long term trend line from 109.03 (2016 low). The development argues that such rise from 109.03 might now be over yet. Decisive break of 61.8% retracement of 137.49 to 124.61 at 132.56 will pave the way to retest 137.49 high. But, firm break of 124.08 will argue that whole rise from 109.03 (2016 low) has completed at 137.49. Deeper decline would be seen to 61.8% retracement of 109.03 to 137.49 at 119.90 next.
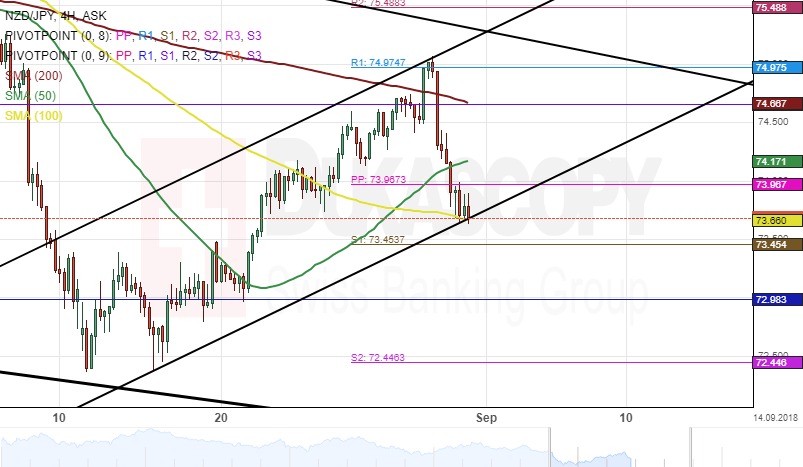
NZD/JPY 4H Chart: Sets For Breakout
The New Zealand Dollar has been trading in two different channels against the Japanese Yen. The most important of the pattern is the junior ascending channel pattern which is currently guiding the price higher.
However, after hitting the upper boundary of the junior ascending channel, the currency pair made a U-turn south. As a result, the rate breached the three moving averages.
Given that the currency exchange rate has moved closer to the bottom border of the junior channel pattern, a breakout is likely to occur during the following trading session. Meanwhile, technical indicators flash bearish sentiment.
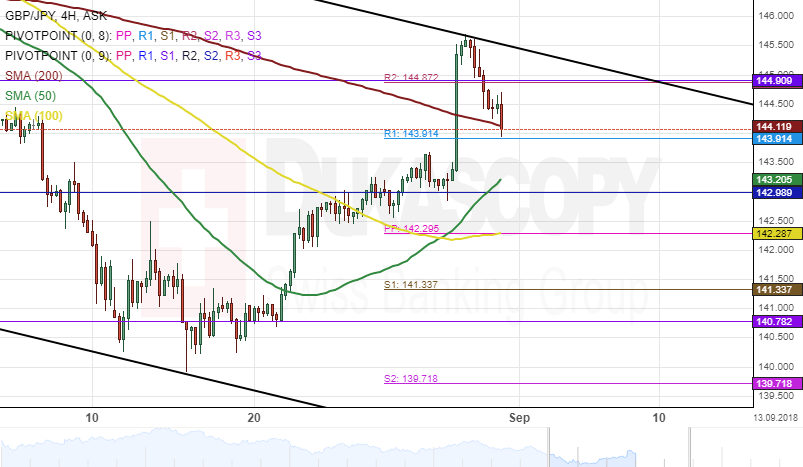
GBP/JPY 4H Chart: Sets For Bullish Momentum
The Pound Sterling has been trading in a junior descending channel against the Japanese Yen. The currency pair reversed from the upper boundary of the pattern on July 13 and had since remained inside the channel.
During the past two weeks, the exchange rate has been gradually gaining strength. The pair re-tested the upper border of the junior descending channel pattern on August 30.
Given that the price action has moved above the 50-, 100-, and 200-hour SMAs, the currency exchange rate could be set for bullish momentum in long-term. Meanwhile, technical indicators flash a strong buy signal on the 4(H) time-frame.
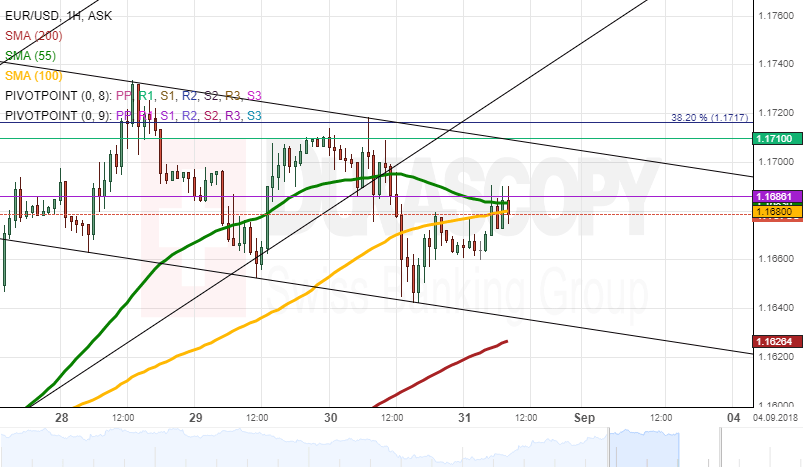
EURUSD Analysis: Reveals Descending Pattern
The European Single Currency appreciated 0.25% against the US Dollar during morning hours. The currency pair bounced off the bottom of a new trend line and retraced back to the monthly pivot point near the 1.1690 level to remain relatively unchanged from the previous trading session. The rate was at the 1.1680 level.
The 55-hour and the 100-hour SMA's passed through the rate during Thursday's session. The 55-hour SMA played a role of resistance for the currency pair on Friday. Moreover, it seems that the rate might move upwards breaking the 55-hour SMA's resistance level and pass through the monthly pivot point to continue trading near the 1.1400 mark.
The rate is still waiting for the squeeze of the 55– hour and the 100-hour SMA's which might force the rate to breakout.
GBPUSD Analysis: Consolidates On Friday
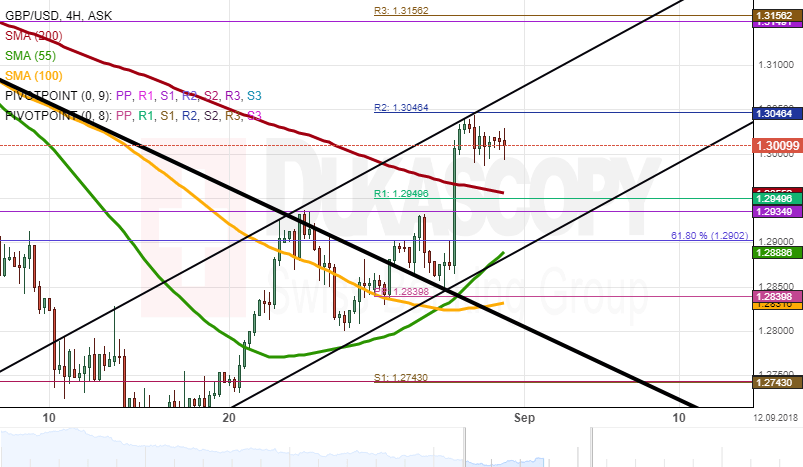
The GBP/USD remained stuck in the range at the 1.3020 mark on Friday morning. The rate bounced off the upper boundary of the freshly drawn trend line during Thursday's session.
The rate had no support on Friday, as the closest support level was the 55-hour SMA at 1.2980. However, it was too far away from the rate to actually provide support. Moreover, the hourly SMA's tried to catch up the rate during the last two trading sessions.
Most likely the currency exchange rate will continue to trade sideways until the SMAs catch up and slam it into the weekly R2 at 1.3046.
USDJPY Analysis: Trades Sideways
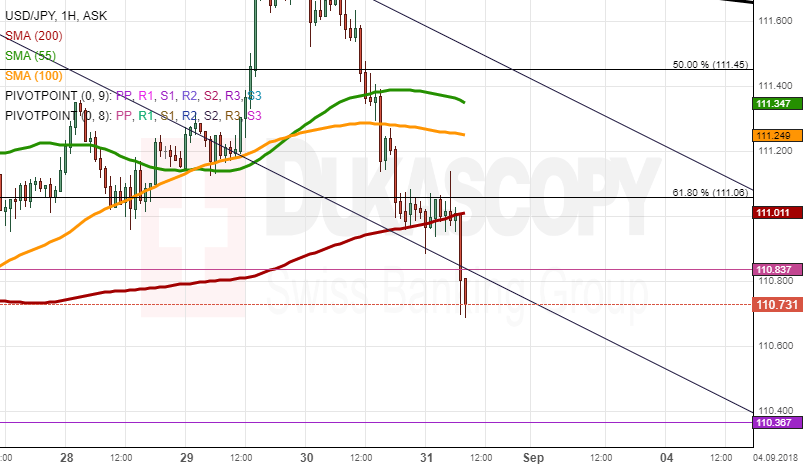
The USD/JPY has been trading sideways since it encountered the 200-hour SMA.. The currency pair tested the Fibonacci 61.80% during morning hours.
The Dukascopy analytics adjusted the most dominant pattern on Friday. Previously the pattern's location was only speculative. It was not know precisely at which mark the upper trend line would be confirmed. After the adjustments, we could see that the senior descending pattern's real borders.
In regards to the near future, the pair is set to be squeezed in between the mentioned Fibonacci retracement and the 200-hour SMA. After the squeeze, a break out should occur.
XAUUSD Analysis: Meets Junior Resistance
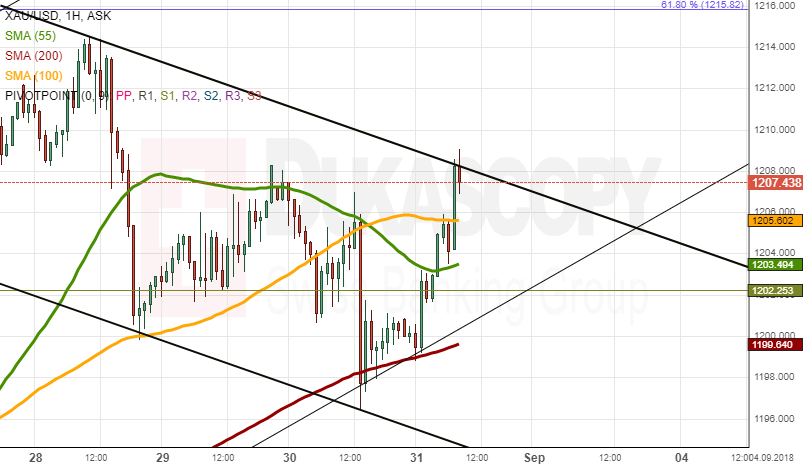
The gold price appreciated 0.80% to the 1,208.00 mark on Friday. The yellow metal bounced off the junior descending pattern 's resistance line on Friday early in the morning.
Meanwhile, we could see that the squeeze of the 55– hour and the 100-hour SMA's forced the rate to breakout downwards during Thursday's session. The 200-hour SMA was playing support during the last trading session, as it strengthened the support of the medium-term ascending channel pattern.
In regards to the future, the forecast is simple. The junior patterns resistance is most likely going to be broken and the bullion will resume its surge.
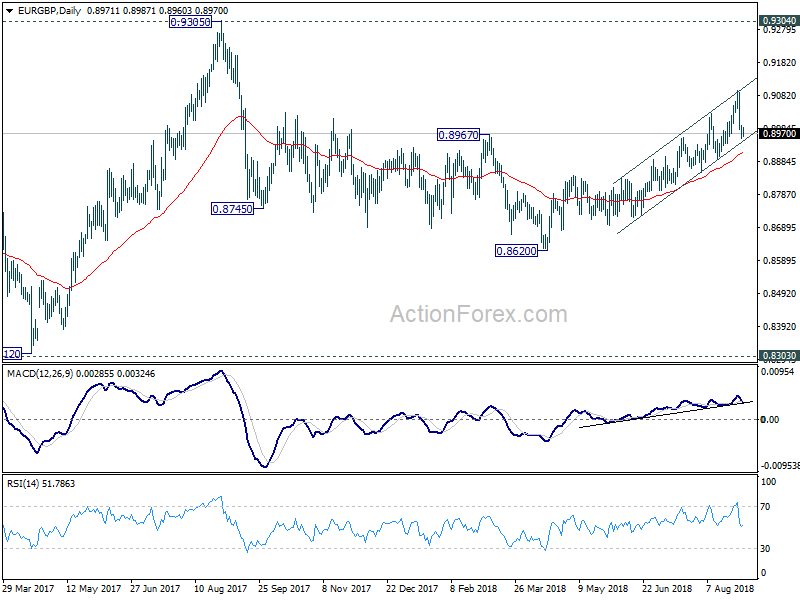
EUR/GBP Daily Outlook
Daily Pivots: (S1) 0.8948; (P) 0.8972; (R1) 0.8989; More...
While the fall from 0.9097 is steep, EUR/GBP is staying in rising channel and well above 0.8895 support. Hence, there is no indicate of trend reversal yet. Larger rally from 0.8620 is still expected to extend higher. Break of 0.9097 will target a test on 0.9305 high. Though, sustained break of channel support will be the first sign of reversal, and focus will be turned back to 0.8895 for confirmation.
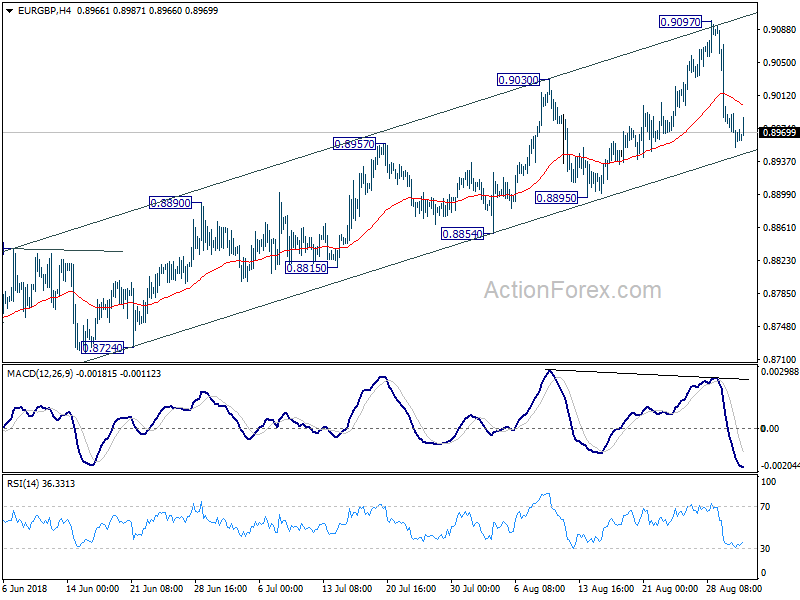
In the bigger picture, EUR/GBP is staying in long term range pattern from 0.9304 (2016 high). The corrective structure of the fall from 0.9305 to 0.8620 is raising the chance that rise from 0.8312 to 0.9305 is an impulsive move. But we're not too confident on it yet. In any case, we'd stay cautious on strong resistance from 0.9304/5 to limit upside in case of further rally. Meanwhile, if there is another medium term decline, strong support will likely be seen from 0.8303 to contain downside.
USDJPY Outlook: Fresh Bears Look For Extension Below Daily Cloud Base
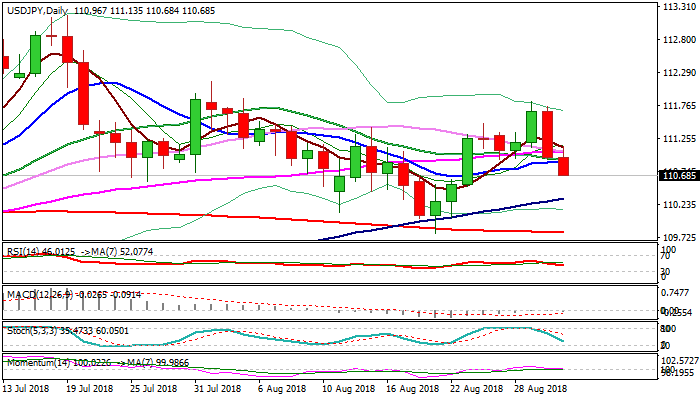
The pair remains under increased pressure on Friday, with extension of previous day’s strong fall (down 0.64% in the biggest one-day fall since 20 July), which formed bearish outside day and generated initial negative signal.
Repeated failure to sustain probes above daily cloud resulted in strong bearish acceleration which is now threatening to break below cloud and generate strong bearish signal (pivotal supports lay at 110.64/56 – daily cloud base/Fibo 61.8% of 109.77/111.82 rally).
Firm break below daily cloud would expose 100SMA (110.31) with stronger acceleration lower, capable of travelling towards key supports at 109.77/79 (21 Aug low / 200SMA).
Weakening daily studies support scenario as 14-d momentum is forming bear-cross and breaking into negative territory, while slow stochastic is in steep descend and MA’s (10, 20, 30, 55) turned to bearish configuration. Cluster of converging daily MA’s between 110.89 and 111.11 marks solid barriers which should keep the upside protected.
Res: 110.89, 111.11, 111.43, 111.83
Sup: 110.64, 110.31, 110.00, 109.77