Sample Category Title
Elliott Wave View: AUDUSD Downside Pressure Remains
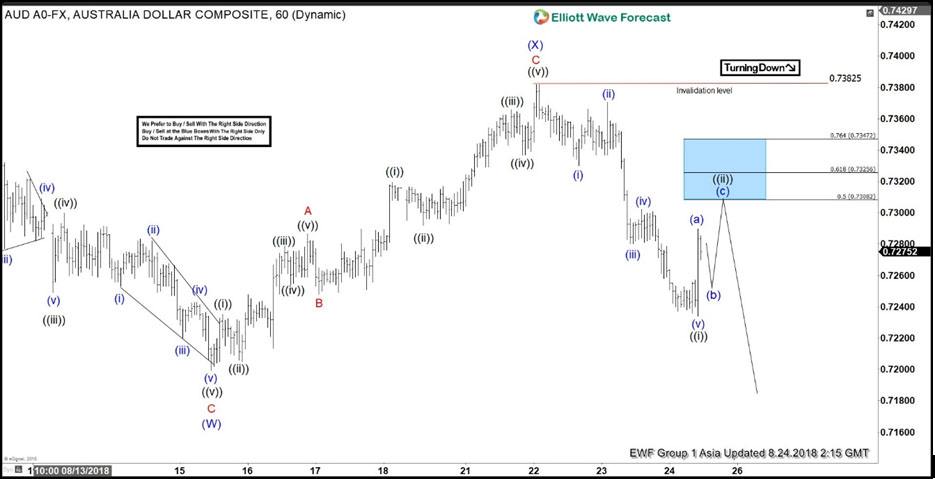
Elliott Wave view on AUDUSD suggests that the decline to 0.7199 ended Intermediate wave (W). Intermediate wave (X) rally appears complete at 0.7382. The internal of Intermediate wave (X) unfolded as a zigzag Elliott Wave structure. Minor wave A of (X) ended at 0.7287, Minor wave B of (X) ended at 0.7248. and Minor wave C of (X) completed at 0.7382.
The decline from there takes the form of s an impulse Elliott Wave structure where Minute wave ((i)) ended at 0.7234. The subdvision of Minutte wave ((i)) unfolded in 5 waves where Minutte wave (i) ended at 0.733, Minutte wave (ii) ended at 0.737. Pullback to 0.728 ended Minutte wave (iii) and Minutte wave (iv) bounce ended at 0.7302. Finally, the move lower to 0.7234 completed Minutte wave (v) as well as Minute wave ((i)). Minute wave (ii) rally is in progress to correct cycle from 8/22 peak (0.738) and while pivot at 0.738 high stays intact, expect pair to extend lower. We don't like buying the proposed rally and expect sellers to appear in 3-7-11 swing provided pivot at 0.738 is holding.
AUDUSD 1 Hour Elliott Wave Chart
EUR/USD Bearish Wave-C After Break Below Support Line
The EUR/USD made a bearish bounce as expected after completing a bullish ABC (purple) zigzag pattern within a larger wave W (pink) correction. A bearish correction is now taking place most likely and is taking price back towards the Fibonacci retracement levels of wave X vs W.
The EUR/USD is now testing the support trend line (blue) and a bearish break will probably create complete an ABC correction within wave X (pink). Price is expected to bounce at the Fib levels if it is indeed building a WXY correction (pink). However, a break below the bottom and 100% Fib makes this wave pattern less likely.

The EUR/USD is building an ABC pattern. A bearish break could indicate that the wave C is not yet finished whereas a bullish breakout could indicate a new bullish push. A bearish break below the neck line (blue) could confirm a potential head and shoulders reversal chart pattern (purple boxes).

GBP/USD Close To Confirming Bearish Continuation
The GBP/USD is challenging the support trend line (blue) after bouncing at the 38.2% Fibonacci retracement level. A bearish breakout below the support could confirm the continuation of the downtrend within wave 5, whereas a break above the resistance (red) could indicate a breakout towards the 50% Fib. The wave 4 is invalidated if the price breaks above the bottom of wave 1, which is indicated by the orange trend line.

The GBP/USD bearish breakout could confirm a continuation of the wave 3 (blue). A bullish bounce at the support could see the price make a retracement within wave 4, but a break above the 50% Fib indicates that a different wave pattern is valid.

Euro-Zone’s Consumer Confidence Dipped To A 15-Month Low Level In August, While Manufacturing Activity Cooled To A 21-Month Low...
For the 24 hours to 23:00 GMT, the EUR declined 0.50% against the USD and closed at 1.1539, amid dismal economic data.
On the data front, the Euro-zone's preliminary consumer confidence index dropped to a 15-month low level of -1.9 in August, compared to market expectations for a fall to a level of -0.7. The index had recorded a level of -0.6 in the prior month. Moreover, the region's flash manufacturing PMI unexpectedly slid to a level of 54.6 in August, marking its 21-month low level and defying market expectations for an advance to a level of 55.2. In the previous month, the PMI had registered a level of 55.1. On the contrary, the nation's preliminary services PMI expanded to 54.4 in August, in line with market expectations and after recording a reading of 54.2 in the preceding month.
Separately, in Germany, the Markit preliminary manufacturing PMI dropped more than expectations to 56.1 in August, compared to a level of 56.9 in the prior month. On the other hand, the flash services PMI advanced to a level of 55.2 in August, following market consensus for a gain to a level of 54.3. The PMI had registered a reading of 54.1 in the previous month.
The minutes of the European Central Bank (ECB) July monetary policy meeting revealed that the economy remained strong throughout the ongoing trade disputes and growing protectionism fears. However, the officials cautioned over worries about trade war and protectionism posed biggest risks to the Euro-zone's economy.
In the US, data showed that, the US flash Markit manufacturing PMI declined to a level of 54.5 in August, losing its momentum and hitting its lowest level since November 2017 while markets had envisaged for a drop to a level of 55.0. The PMI had registered a reading of 55.3 in the previous month. Meanwhile, the nation's the flash Markit services PMI fell to a 4-month low level of 55.2 in August, following to a level of 56.0 in the prior month. Market participants had expected the PMI to dip to a level of 55.8. Additionally, the US new home sales unexpectedly slid 1.7% to a level of 627.0K on a monthly basis in July, reaching its lowest level in 9-months and affected by elevated costs of construction and lack of labour and land. In the prior month, new home sales had registered a revised level of 638.0K, while market participants had expected for an increase to a level of 645.0K.
Meanwhile, the US housing price index increased 0.2% on a monthly basis in June, undershooting market consensus for a rise of 0.3%. In the previous month, the index had registered a revised rise of 0.4%. Furthermore, US seasonally adjusted initial jobless claims surprisingly eased to a level of 210.0K in the week ended 18 August 2018, compared to a level of 212.0K in the prior week. Markets had envisaged initial jobless claims to climb to 215.0K.
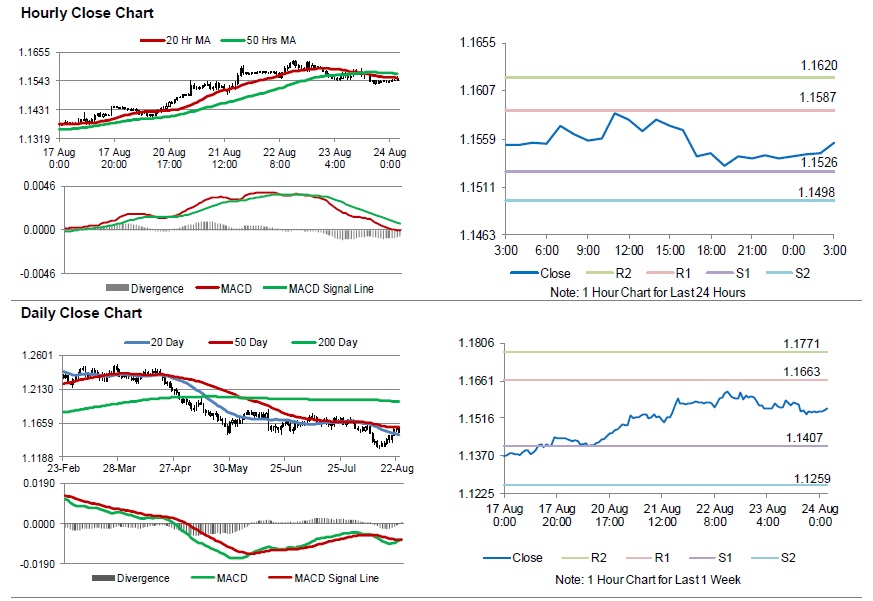
In the Asian session, at GMT0300, the pair is trading at 1.1555, with the EUR trading 0.14% higher against the USD from yesterday's close.
The pair is expected to find support at 1.1526, and a fall through could take it to the next support level of 1.1498. The pair is expected to find its first resistance at 1.1587, and a rise through could take it to the next resistance level of 1.1620.
Looking ahead, investors will closely monitor Germany's final 2Q GDP data, set to release in a while. Later in the day, the US durable goods order for July, will keep traders on their toes.
The currency pair is showing convergence with its 20 Hr moving average and trading below its 50 Hr moving average.
Brexit Secretary Discloses Prospects Of ‘No-Deal Brexit’ Plan
For the 24 hours to 23:00 GMT, the GBP declined 0.82% against the USD and closed at 1.2810, after Brexit Secretary, Dominic Raab revealed his department’s contingency plans for a no-deal exit from the EU and stated that UK credit card users could be forced to pay a 'Brexit-tax' worth £166 million.
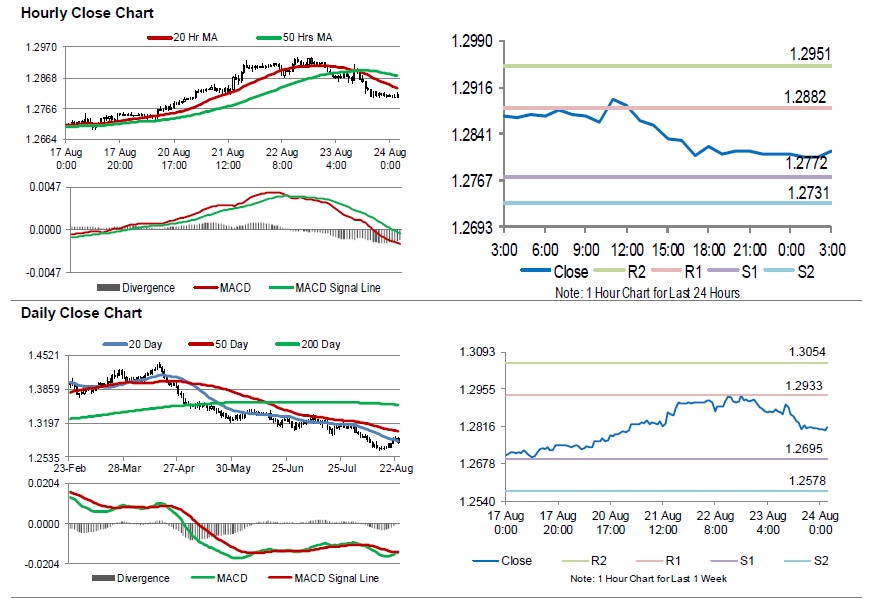
In the Asian session, at GMT0300, the pair is trading at 1.2813, with the GBP trading marginally higher against the USD from yesterday’s close.
The pair is expected to find support at 1.2772, and a fall through could take it to the next support level of 1.2731. The pair is expected to find its first resistance at 1.2882, and a rise through could take it to the next resistance level of 1.2951.
Moving forward, traders will await UK’s BBA mortgage approvals for July, scheduled to release in a few hours.
The currency pair is trading below its 20 Hr and 50 Hr moving averages.
Japan’s National Inflation Rose Less-Than-Anticipated In July
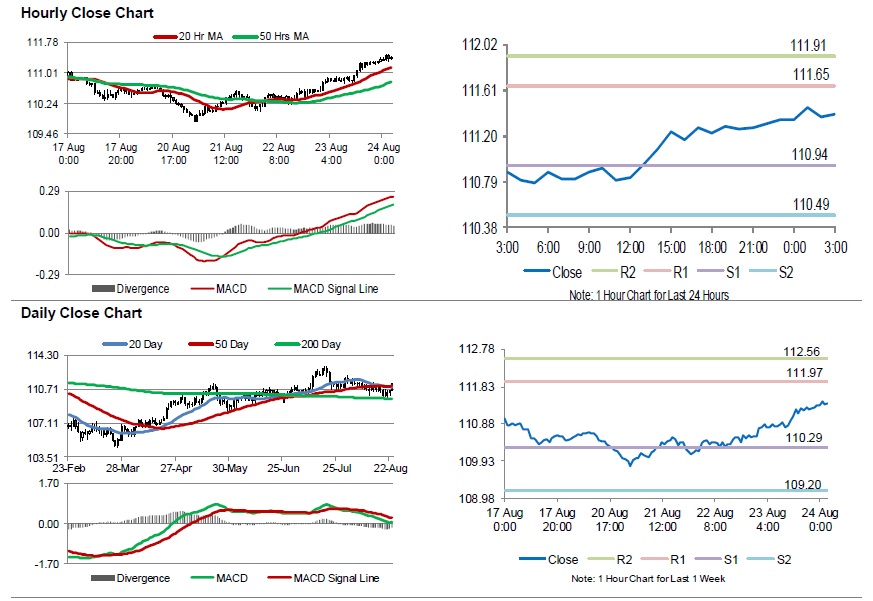
For the 24 hours to 23:00 GMT, the USD rose 0.72% against the JPY and closed at 111.35.
In the economic news, Japan's final leading economic index declined to a level of 104.7 in July, after registering a reading of 106.9 in the previous month. The preliminary figures had recorded a fall to 105.2. Meanwhile, the nation's final coincident index eased to a level of 116.4 in July, compared to a level of 116.8 in the prior month. The preliminary figures had recorded a drop to 116.3.
In the Asian session, at GMT0300, the pair is trading at 111.39, with the USD trading slightly higher against the JPY from yesterday's close.
Overnight data indicated that, Japan's national consumer price index (CPI) climbed 0.9% on a yearly basis in July, falling short of market expectations for a rise of 1.0%. In the previous month, the CPI had recorded a gain of 0.7%.
The pair is expected to find support at 110.94, and a fall through could take it to the next support level of 110.49. The pair is expected to find its first resistance at 111.65, and a rise through could take it to the next resistance level of 111.91.
Trading trend in the Japanese Yen is expected to be determined by housing starts, retail trade, large retailers' sales, consumer confidence index, all set to release next week.
The currency pair is trading above its 20 Hr and 50 Hr moving averages.
Swiss Franc Trading A Tad Higher In The Morning Session
For the 24 hours to 23:00 GMT, the USD rose 0.36% against the CHF and closed at 0.9862.
Data showed that Switzerland’s industrial production unexpectedly climbed 8.3% on an annual basis in the second quarter of 2018, following a rise of 9.0% in the prior quarter.
In the Asian session, at GMT0300, the pair is trading at 0.9859, with the USD trading slightly lower against the CHF from yesterday’s close.
The pair is expected to find support at 0.9832, and a fall through could take it to the next support level of 0.9805. The pair is expected to find its first resistance at 0.9876, and a rise through could take it to the next resistance level of 0.9893.
With no macroeconomic releases in Switzerland today, investors would look forward to global macroeconomic releases for further directions.
The currency pair is trading above its 20 Hr and 50 Hr moving averages.

Loonie Trading A Tad Higher In The Asian Session
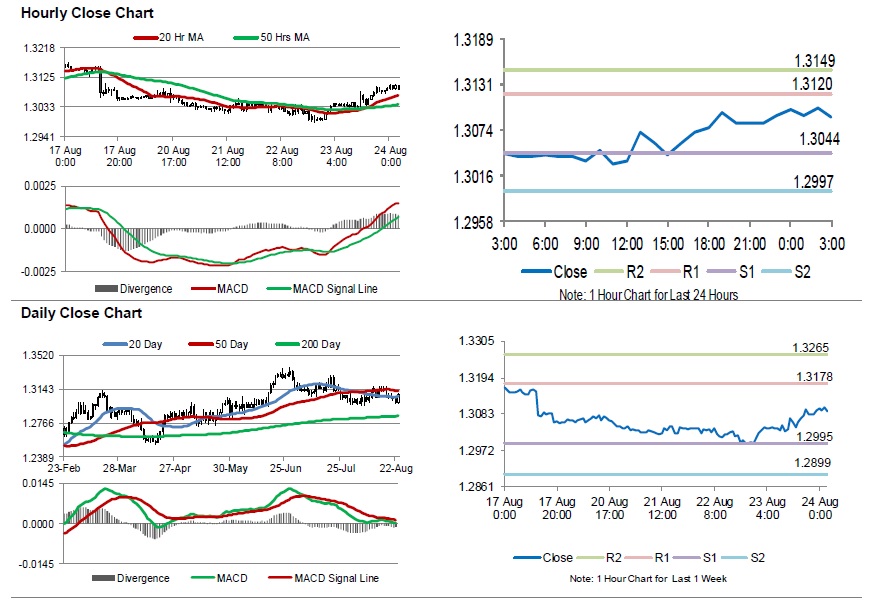
For the 24 hours to 23:00 GMT, the USD rose 0.76% against the CAD and closed at 1.3093.
In the Asian session, at GMT0300, the pair is trading at 1.3090, with the USD trading slightly lower against the CAD from yesterday’s close.
The pair is expected to find support at 1.3044, and a fall through could take it to the next support level of 1.2997. The pair is expected to find its first resistance at 1.3120, and a rise through could take it to the next resistance level of 1.3149.
Going ahead, investors will keep an eye on Canada’s gross domestic product (GDP), scheduled to release next week.
The currency pair is trading above its 20 Hr and 50 Hr moving averages.
Aussie Reverses Its Losses In The Asian Session
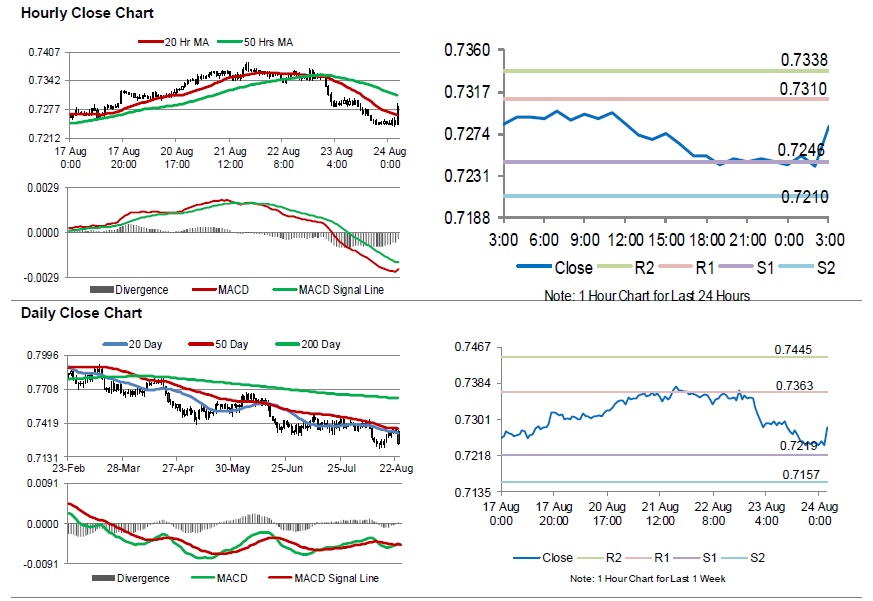
For the 24 hours to 23:00 GMT, the AUD declined 1.41% against the USD and closed at 0.7246, amid political worries.
LME Copper prices declined 1.5% or $89.5/MT to $5910.5/MT. Aluminium prices declined 0.8% or $17.0/MT to $2021.5/MT.
In the Asian session, at GMT0300, the pair is trading at 0.7282, with the AUD trading 0.50% higher against the USD from yesterday’s close, following former Treasurer, Scott Morrison’s election as the new Australian Prime Minister.
The pair is expected to find support at 0.7246, and a fall through could take it to the next support level of 0.7210. The pair is expected to find its first resistance at 0.7310, and a rise through could take it to the next resistance level of 0.7338.
The currency pair is showing convergence with its 20 Hr moving average and trading below its 50 Hr moving average.
Gold: Yellow Metal Reverses Its Losses In The Asian Session
For the 24 hours to 23:00 GMT, Gold declined 0.93% against the USD and closed at USD1191.90 per ounce, amid strength in the greenback.
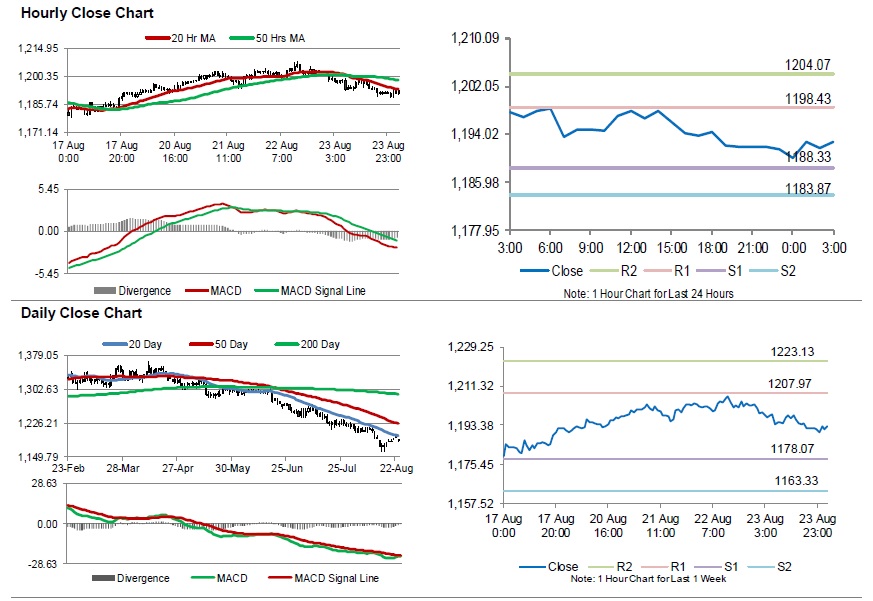
In the Asian session, at GMT0300, the pair is trading at 1192.80, with gold trading 0.08% higher against the USD from yesterday’s close.
The pair is expected to find support at 1188.33, and a fall through could take it to the next support level of 1183.87. The pair is expected to find its first resistance at 1198.43, and a rise through could take it to the next resistance level of 1204.07.
The yellow metal is showing convergence with its 20 Hr moving average and trading below its 50 Hr moving average.