Sample Category Title
Mid-US update: Fresh selling in Pound and Yen, levels to watch in USDJPY, GBPUSD and GBPCHF
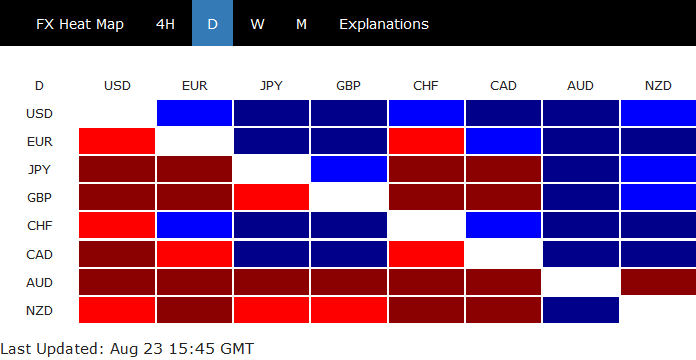
For now, Dollar and Swiss Franc remain the strongest one for today while Australian Dollar stays the weakest. But steep selling is seen in Sterling and Yen, which threaten to overtake Aussie's place as the worst performing one. It's unsure what're the triggers for the selloff up to this moment. It could be a delayed reaction to UK's no-deal Brexit notice, but we're not too convinced by that. At the time same, there is no apparent surge in risk appetite or treasury yields. It'll take us some more time to dig out the causes.
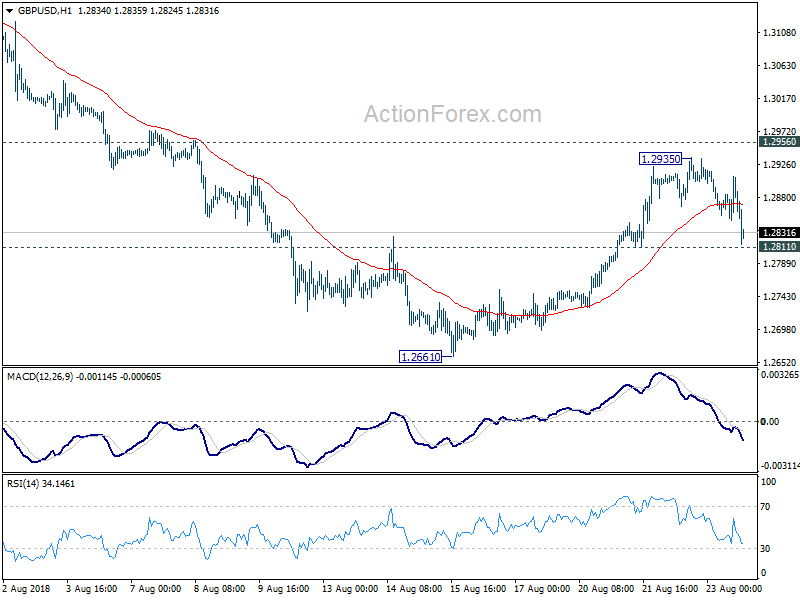
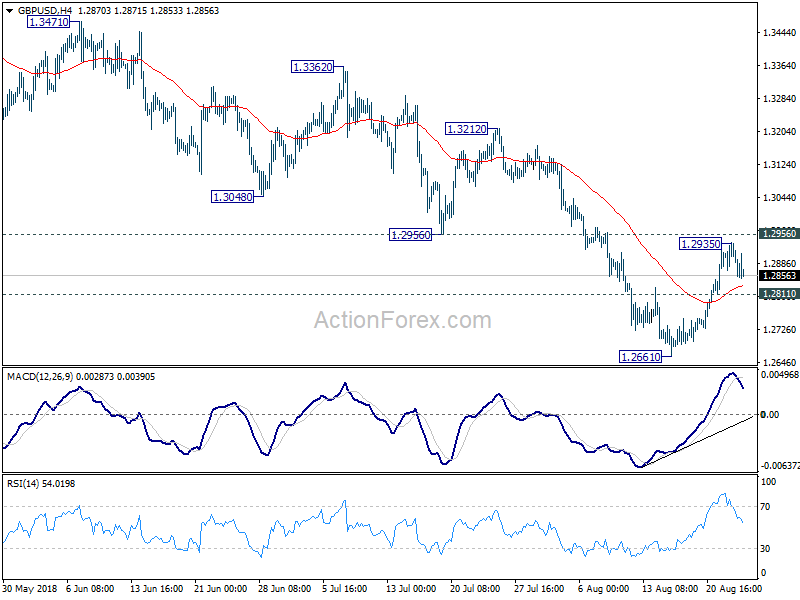
For GBP/USD, focus is now on 1.2811 minor support. Break there will mark the completion of the corrective rebound form 1.2661 at 1.2935. Deeper fall should then be seen back to retest 1.2661 low.
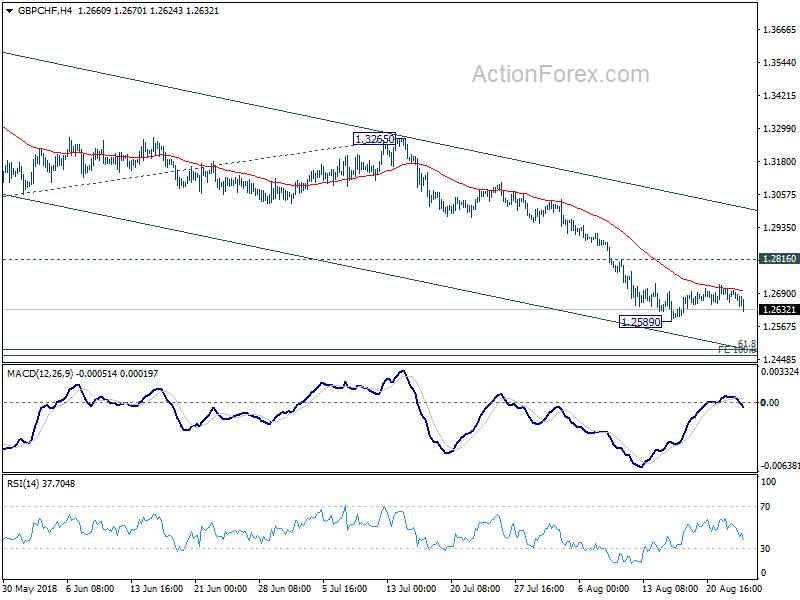
GBP/CHF is rejected by 4 hour 55 EMA and is heading back to 1.2589 temporary low. Break will resume larger fall from 1.3854 to cluster level of 100% projection of 1.3854 to 1.3049 from 1.3265 at 1.2460 and 61.8% retracement of 1.1638 to 1.3854 at 1.2485. We had a GBP/CHF short position as mentioned here. On break of 1.2589, we'll lower the stop from 1.2820 to 1.2725. Of course, if 1.2589 is not taken out, we'll keep everything unchanged first and wait.
USD/JPY's break of near term trendline is a sign of bullish reversal. Immediate focus is now on 111.42 resistance. Break will indicate completion of the correction from 113.17 at 109.76. And retest of 113.17 high would then be seen in near term.
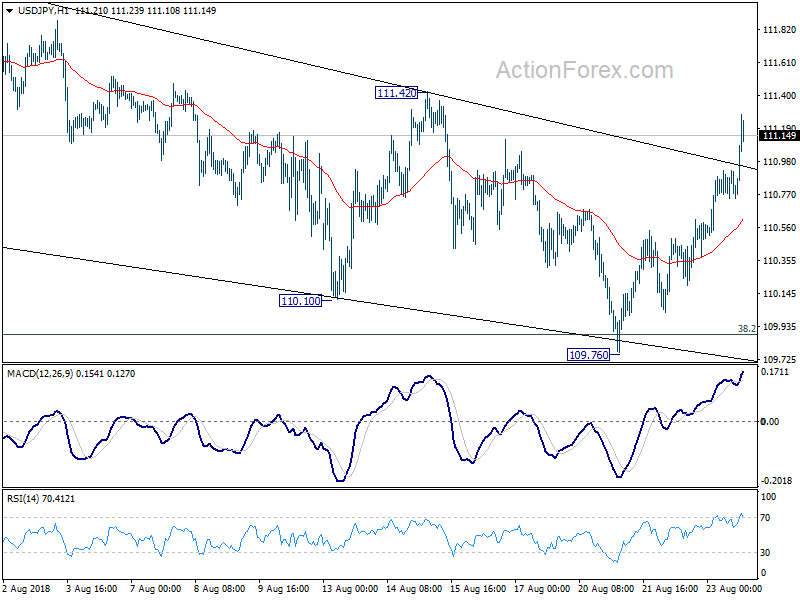
So, 1.2811 in GBP/USD, 1.2589 in GBP/CHF and 111.42 in USD/JPY are the levels to watch.
In other markets, European stocks ended a rather dull day nearly flat. FTSE closed down -0.13%, DAX down -0.13% and CAC up 0.00%. Gold continues to press 1187.4 support and struggles to regain 1190. WTI crude oil is firm above 67 after yesterday's rebound.
Japanese Inflation to Tick Up in July But Still Has Long Road to the Target
Japan’s Statistics Bureau will be releasing inflation readings for the month of July at 2330 GMT and while the Bank of Japan’s monetary policy remains super accommodative, inflation has been stubbornly refusing to pick up steam towards the central bank’s price target, making investors wonder whether the BoJ could join its counterparts in the tightening train anytime soon. In July, analysts expect core inflation to strengthen but still remain sluggish.
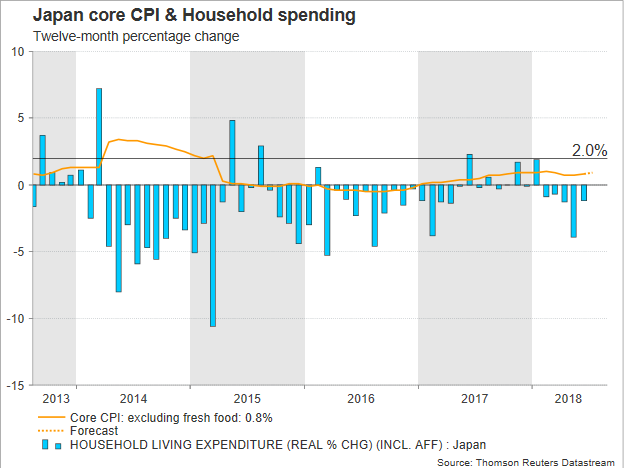
The data are expected to show that the nationwide core Consumer Price Index (CPI), which excludes fresh food but includes energy products, grew by 0.9% y/y in June, slightly faster than in May when the gauge stood at 0.8% but still slower than the 1.0% peak reached in February. Compared to the Bank of Japan’s price target of 2.0%, however, the core CPI has still plenty of room to run.
Looking at inflationary drivers, growth in household spending (inflation-adjusted) remained negative for the fourth straight month in June. Meanwhile in the labour market, the unemployment rate eased to 2.2% in May to the lowest since 1993 and remained near 25-year lows since then. But the tighter labour market did little to push up wages as nominal earnings kept rising within the 0-2.0% range observed from 2014 onwards; between 2010-2015 those were mostly contracting. However, in June, nominal wages surged by 3.6% y/y, marking the highest gain since 1997, something that could prove a tailwind to consumption in the coming months and therefore inflation-positive. Real wages also increased from 1.3% y/y in May to 2.8%. Still, the advance was on the back of large summer bonuses rather than on permanent pay rises, which created doubts on whether wage growth could keep increasing in the following months.
With inflation struggling to meet the target, BoJ policymakers decided to revise their inflation forecasts through fiscal 2020 downwards in their latest policy meeting in July, pushing back the timing for inflation to reach the goal. Leaving interest rates unchanged at -0.1%, the BoJ chief, Haruhiko Kuroda admitted that the ultra-easy monetary policy could last for longer than was previously anticipated, adding that rates could stay “low for an extended period of time”. But his decision to allow greater flexibility in government bond purchases including allowing 10-year government bond yields moving within a range of minus 0.2% and 0.2% instead of minus 0.1% and 0.1% set previously raised speculation that the central bank is making steps towards normalization before inflation touches the 2.0% target. The Bank also said that it would reduce the policy rate balance, meaning that negative interest rates would be applied to a lower amount of reserves maintained with the central bank. Still, with the BoJ giving a forward guidance for borrowing costs to remain at current levels until October 2019, the odds for policymakers to scale back stimulus earlier than the aforementioned date do not appear that high at the moment. Moreover, the Bank has fewer incentives to deliver higher rates at a time when trade uncertainties related to US trade protectionism and retaliatory actions by other major economies threaten to harm the export-dependent Japanese economy.
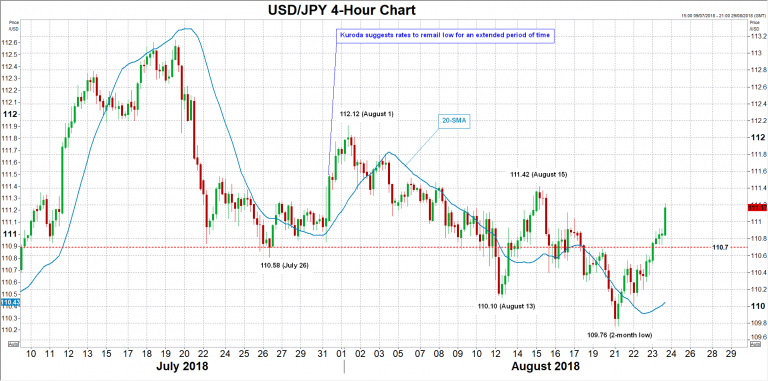
In FX markets, dollar/yen gained significant ground after Kuroda called for rates to remain low for an extended period of time on July 31, peaking at 112.12 the next day. However, rising demand for safe havens including the yen amid an uncertain trade environment and Trump’s complains about the Fed’s rate hiking path drove the pair near a two-month low of 109.76 earlier this week. Yet, the market managed to crawl back above the 111 handle today, and should Japanese inflation figures disappoint on Friday, the pair could extend this upward move towards the August 15 peak of 111.42. Even higher, eyes will turn to the 112 psychological level and the August 1 high of 112.12.
Conversely, if core CPI beats expectations, traders could look for immediate support between 110.70 and 110.58, where the price paused in July. In case this area fails to halt downside movements, then the next stop could be around 110.10, taken from the low on August 13.
AUDCAD Builds Base Around 0.95; Broader Trend is Negative
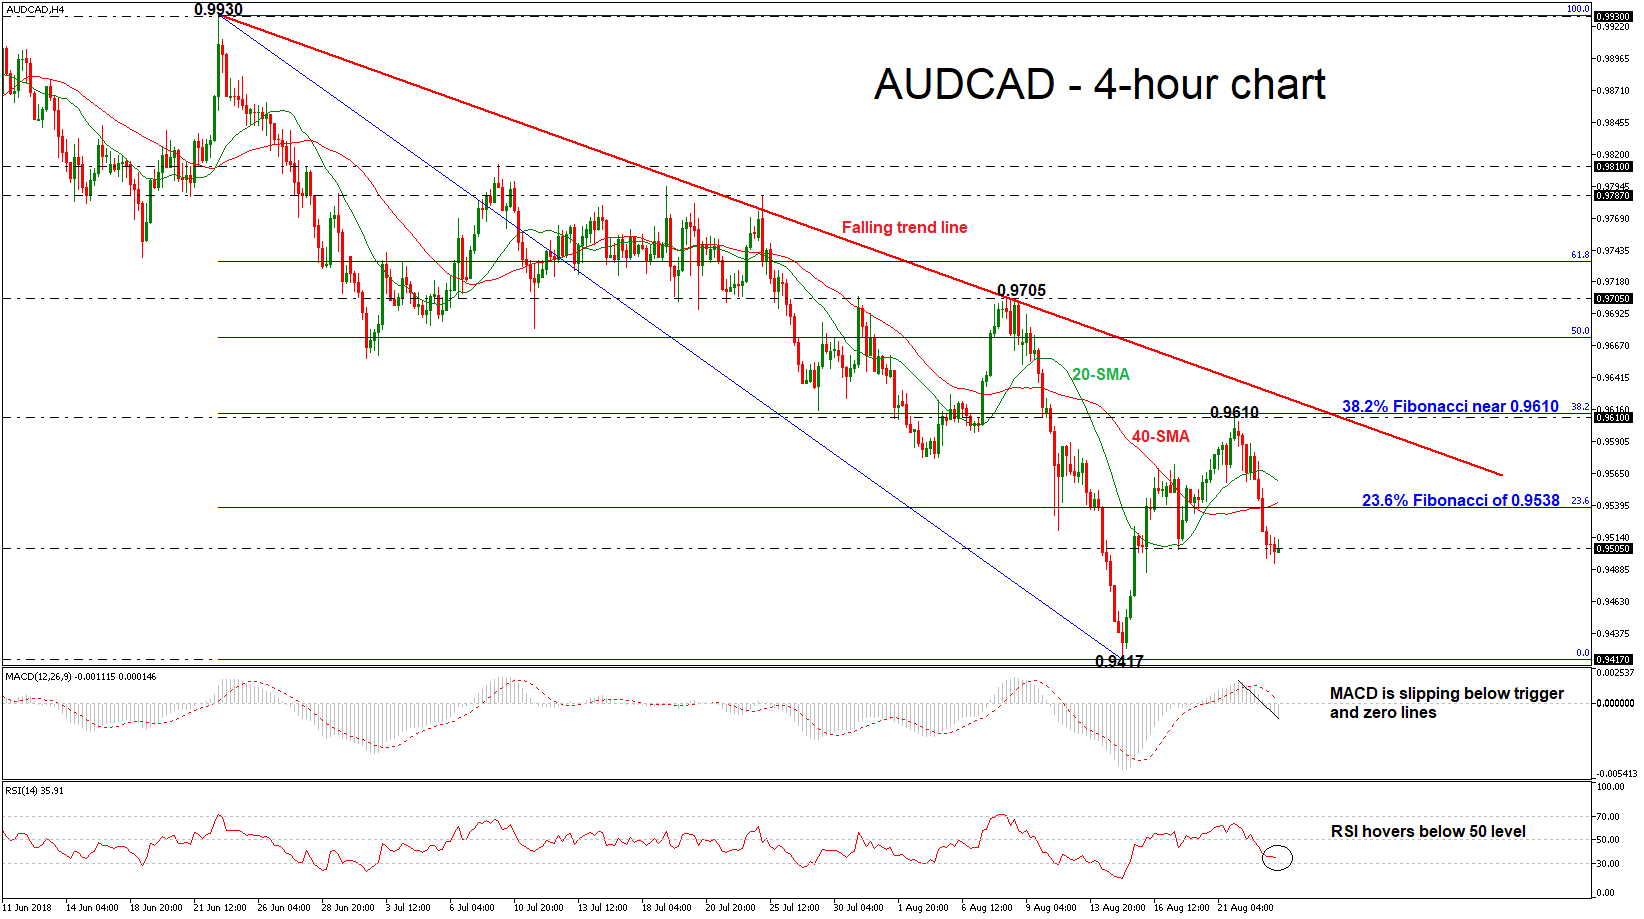
AUDCAD is set to record the second strong negative day in a row, posting a fresh one-week low near 0.9493. The bearish picture in the short and medium term is further supported by the MACD, which is falling below the zero and trigger lines, while the RSI is approaching the 30 level with weak momentum at the moment.
The price has eased around the 0.9505 barrier and if there is a closing candle below this area it would endorse further downside pressures. A bearish rally would drive the pair until the two-year low of 0.9417 last achieved on August 15.
On the flip side, a move to the upside could see immediate resistance at the 23.6% Fibonacci retracement level of the downleg from 0.9930 to 0.9417, around 0.9538, which stands near the 40-simple moving average in the 4-hour chart. Slightly above these levels, the price could touch the 20-SMA at 0.9560. A stronger barrier, though, could be found at the 38.2% Fibonacci mark near 0.9610.
To sum up, the pair has been trading within a descending trend since June 22 after it bounced off the 0.9930 resistance level. In addition, AUDUSD remains below the moving averages in the daily timeframe, indicating further losses.
US PMIs dropped, point to slown down to 2.5% GDP growth
PMI manufacturing dropped to 54.5 in August, down from 55.3 and missed expectation of 55.1. PMI services dropped to 55.2, down from 56.0 and missed expectation of 55.9. PMI composite dropped to 55.0, down from 55.7, hit a 4-month low.
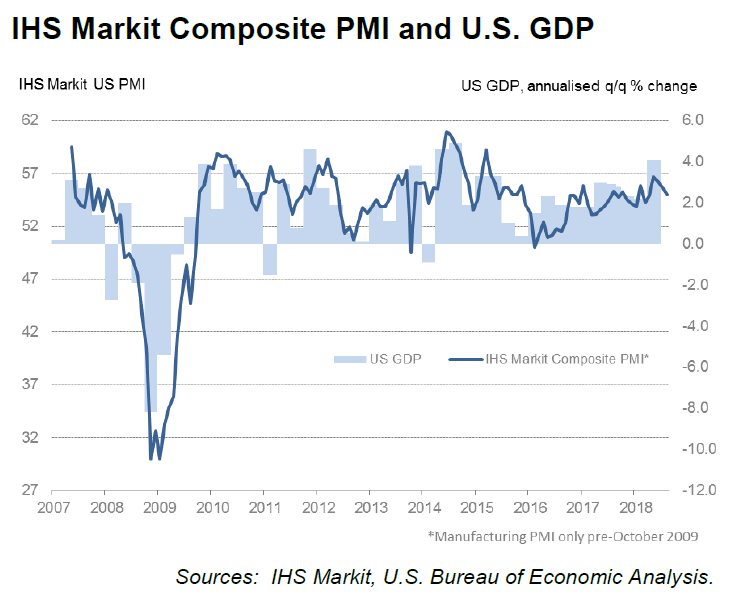
Commenting on the flash PMI data, Chris Williamson, Chief Business Economist at IHS Markit said:
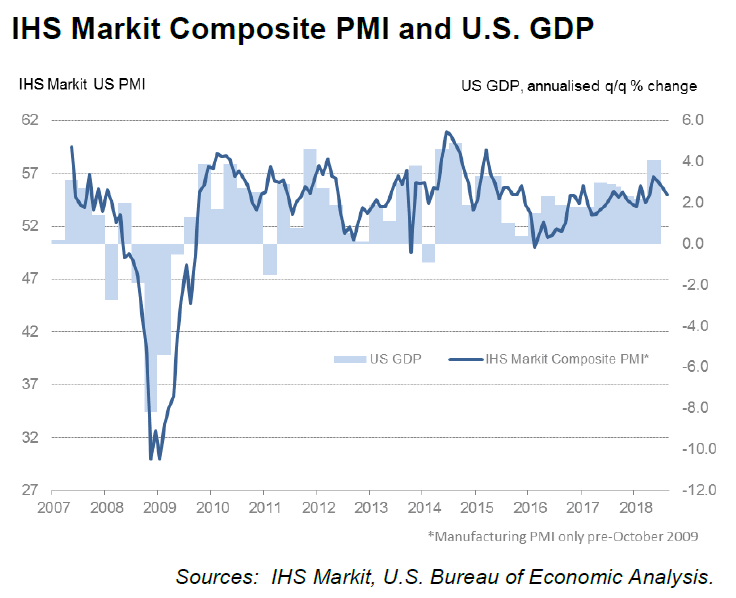
"The US economy lost a little pace in August, according to the flash PMI, but continued to grow at a solid rate. The PMI is indicative of the economy growing at an annualised rate of roughly 2.5%, down from a 3.0% indicated rate in July.
"Output, new orders and employment growth all moderated, adding to signs that the economy has cooled after strong growth in the second quarter. Backlogs of uncompleted work, a key indicator of future output and hiring, meanwhile fell for the first time for over a year, suggesting the slowing trend could persist into the fall.
"Manufacturing has led the slowdown, though the service sector has also come off the boil compared to the second quarter highs.
"Some of the slowdown can be attributed to supply shortages: jobs growth in manufacturing and services is being restricted by a lack of available workers, while factories are also constrained by a lack of raw materials, sometimes blamed on 'panic-buying' of safety stocks as well as a lack of transportation to ship goods around.
"However, the survey also found increased cases of companies reporting the need to cut costs, in part reflecting the recent steep rise in raw material prices, often linked to tariffs and shortage-related price hikes. Fortunately, input price inflation eased for a third successive month and average prices charged for goods and services rose at a slower rate than July's post-recession high."
US jobless claims dropped to 210k, PMI composite hit 4 month low
Wrapping up the data released from US.
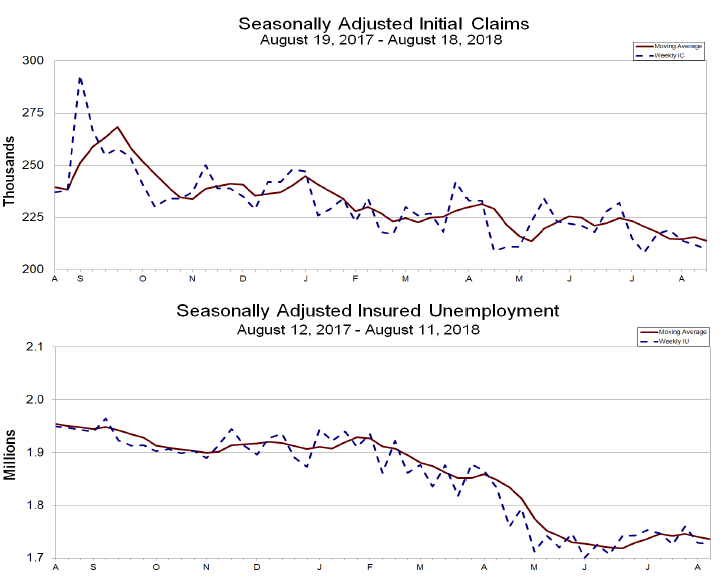
Initial jobless claims dropped -2k to 210k in the week ended August 18, below expectation of 215k. Four-week moving average of initial claims dropped -1.75k to 213.75k. Continuing claims dropped -2k to 1.727m in the week ended August 11. Four-week moving average of continuing claims dropped -5k to 1.7355m.
PMI manufacturing dropped to 54.5 in August, down from 55.3 and missed expectation of 55.1. PMI services dropped to 55.2, down from 56.0 and missed expectation of 55.9. PMI composite dropped to 55.0, down from 55.7, hit a 4-month low.
House price index rose 0.2% mom in June, versus expectation of 0.3% mom. New home sales dropped to 627k in July, missed expectation of 651k.
Kansas Fed George: FOMC is very focused on mandate given by Congress
Kansas City Fed President Esther George said in TV interviews today that two more rate hikes could be "appropriate this year". And Fed aims to have a few more hikes next year around 3%.
Regarding Trump's comments on Fed rate hikes, George said "expressions of angst about higher interest rates are not unique to this administration.. She added that "we know higher interest rates cause adjustments in the economy."
George added that she doesn't feel any political heat and "I don't feel personally that it impedes our ability to make decisions." She emphasized that "this committee is very focused on the mandate given to us by Congress to try to make decisions that are in the long-run interest of a growing economy."
Dollar Caught Between Trump and Tariffs
The US dollar depreciated on Wednesday versus most major pairs after the release of the Fed minutes.
The central bank published the notes from the Federal Open Market Committee (FOMC) meeting where plans for two more rate hikes are present but since that scenario has been fully priced into the dollar the fact that policy members see risks of trade disputes impacting the growth of the economy weighed down on the currency.
The EUR/USD rose 0.23 percent on Wednesday and has now advanced 1.40 percent since trading started this week.
The single currency is trading at 1.1597 after US President Trump’s campaign manager was found guilty of eight chargers on Tuesday escalating market concerns about the political turmoil in the White House. Trade disputes with the EU and China have boosted the US, before the comments from President Trump on the work of Fed Chair Jerome Powell put the greenback on the back foot.
Chair Powell will speak this Friday at the Economic Policy Symposium in Jackson Hole. The title of his speech is “Monetary Policy in a Changing Economy” which could bring some insight into the path of the Fed. Analysts see four more rate hikes before the Fed runs out of runway and looks instead to other alternatives to keep tightening. The central bank has already mentioned growing headwinds as trade concerns could have a deep impact on the growth of the US economy.
EUR/AUD Mid-Day Outlook
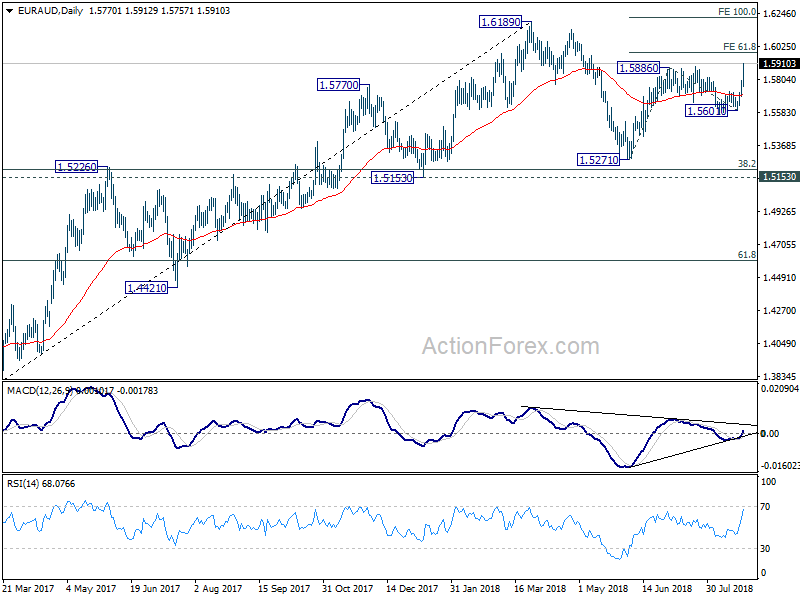
Daily Pivots: (S1) 1.5712; (P) 1.5756; (R1) 1.5817; More....
EUR/AUD's rally continues and reaches as high as 1.5911 so far today. Break of 1.5886/8 resistance confirms resumption of rally from 1.5271. Further rise should be seen to 61.8% projection of 1.5271 to 1.5886 from 1.5601 at 1.5981 first. Break will target 100% projection at 1.6216, which is close to 1.6189 high. On the downside, below 1.5836 minor support will turn intraday bias neutral and bring consolidation first, before staging another rally.
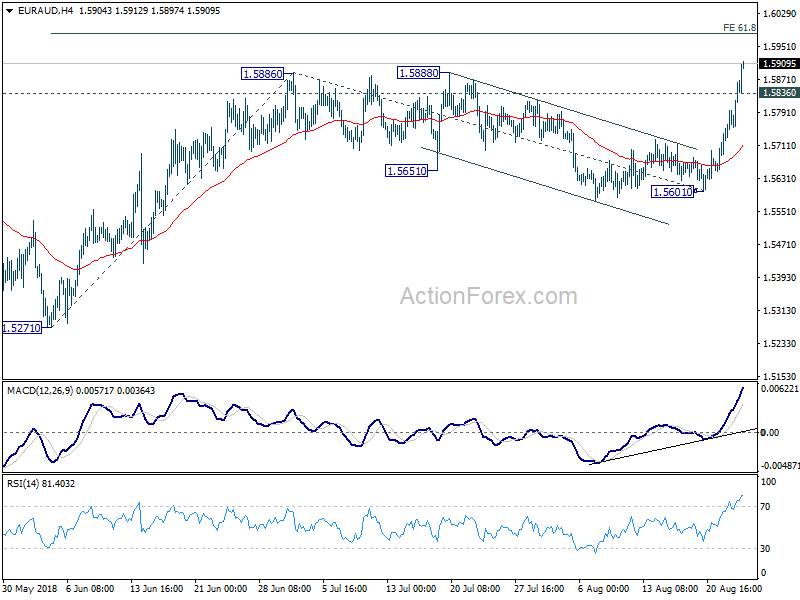
In the bigger picture, the rebound from 1.5271 was somewhat weaker than expected. EUR/AUD. But there is no confirmation of completion. Break of 1.5888 will likely target 1.6189 and above to resume the medium term rally from 1.3624 (2017 low). This will be the favored case as long as 1.5271 support holds.
EUR/USD Mid-Day Outlook
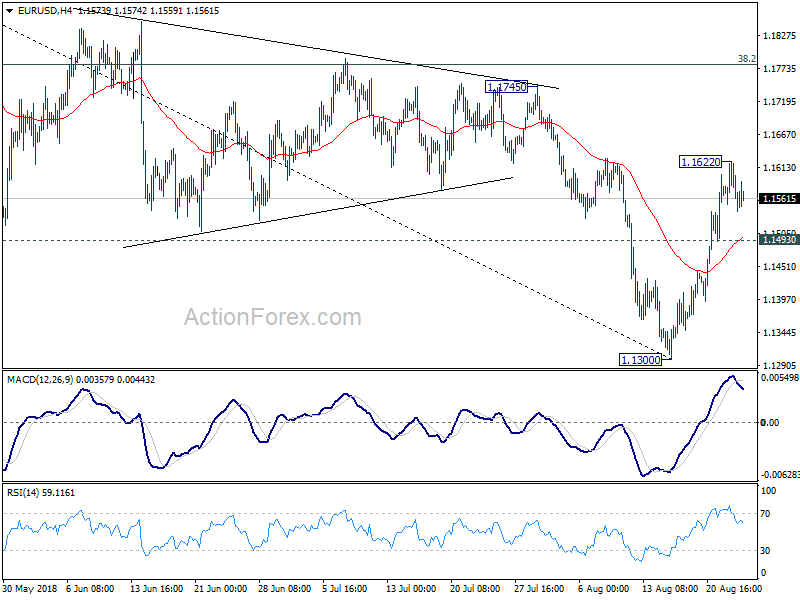
Daily Pivots: (S1) 1.1559; (P) 1.1591; (R1) 1.1630; More.....
Intraday bias in EUR/USD remains neutral at this point. Rebound from 1.1300 is seen as a correction. In case of another rise, we'd expect strong resistance from 1.1745 to limit upside to bring larger down trend resumption. On the downside, break of 1.1493 minor support will suggest that the rebound is completed. Intraday bias would be turned back to the downside for retesting 1.1300 low.
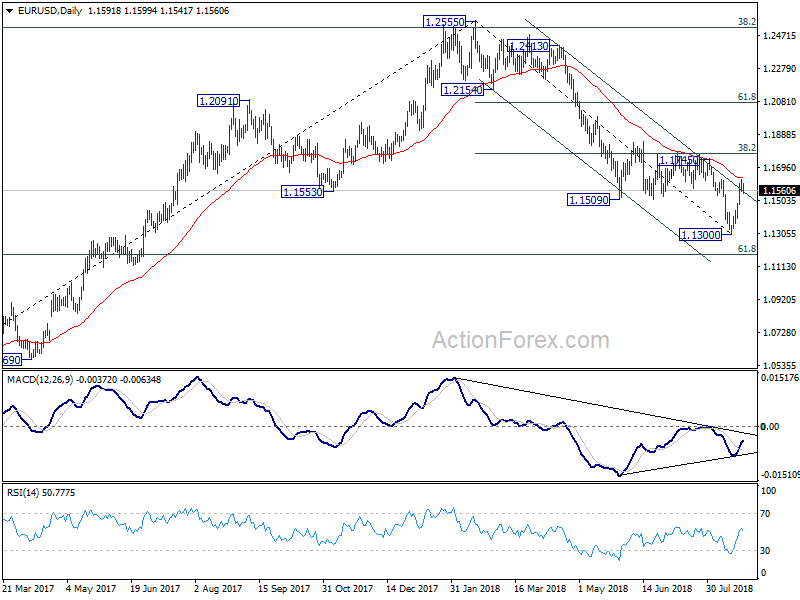
In the bigger picture, the down trend from 1.2555 medium term is in progress for 61.8% retracement of 1.0339 to 1.2555 at 1.1186. Note again that EUR/USD was rejected by 38.2% retracement of 1.6039 (2008 high) to 1.0339 (2017 low) at 1.2516. That carries some long term bearish implications. Sustained break of 1.1186 could pave the way back to retest 1.0339 low. For now, outlook will remain bearish as long as 38.2% retracement of 1.2555 to 1.1300 at 1.1779 holds, even in case of strong rebound.
GBP/USD Mid-Day Outlook
Daily Pivots: (S1) 1.2876; (P) 1.2906; (R1) 1.2944; More...
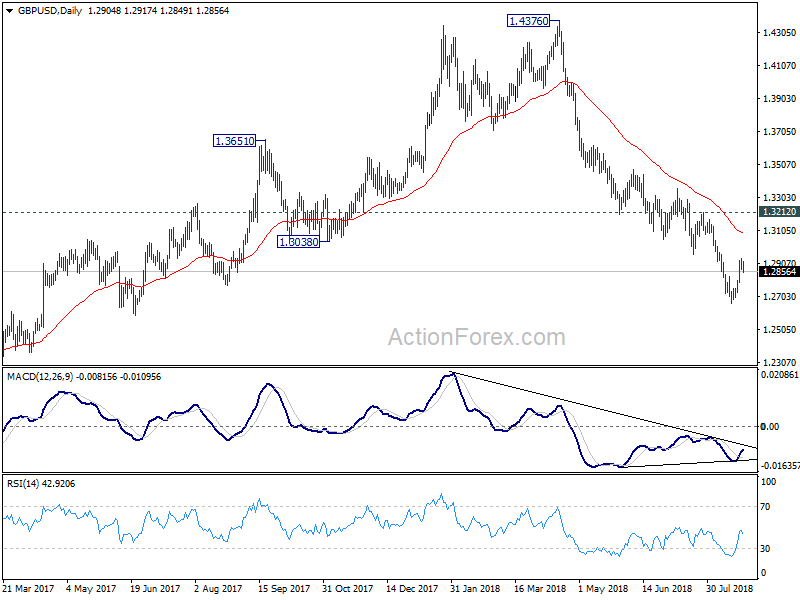
Intraday bias in GBP/USD remains neutral at this point. Rebound from 1.2661 is seen as a corrective move. We'd expect upside to be limited by 1.2956 support turned resistance to bring larger down trend resumption. On the downside, below 1.2811 minor support will turn bias to the downside for retesting 1.2661 low first. However, decisive break of 1.2956 will turn focus to 1.3212 key resistance instead.
In the bigger picture, whole medium term rebound from 1.1946 (2016 low) should have completed at 1.4376 already, after rejection from 55 month EMA (now at 1.4091). Current downside acceleration argues that it's possibly resuming long term down trend. In any case, outlook will stay bearish as long as 1.3212 resistance holds. Retest of 1.1946 should be seen next.