

Sample Category Title
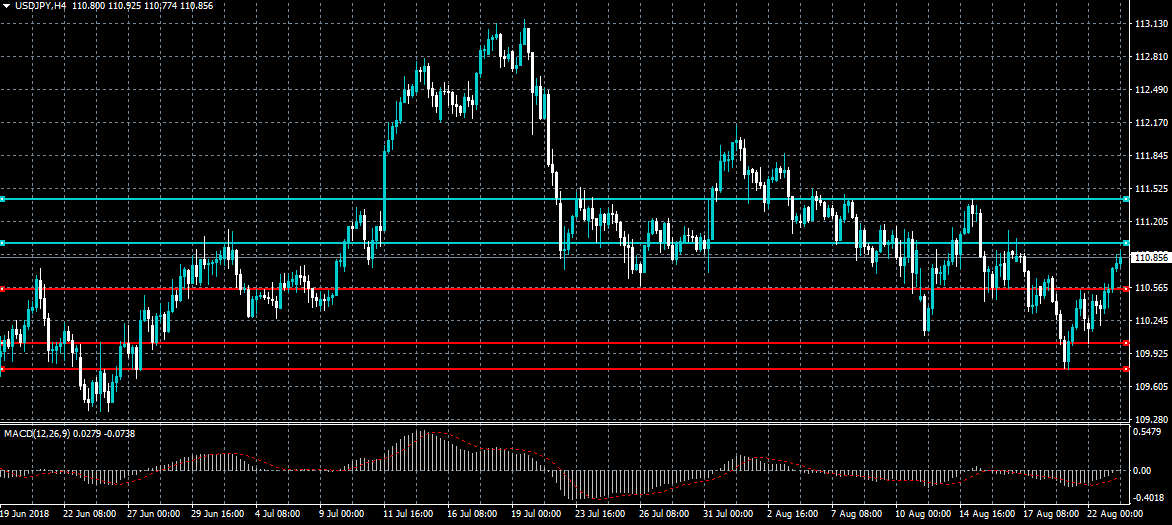
USDJPY Risks Remain To The Downside
The US dollar is pushing higher against the Japanese yen currency after the FOMC Meeting Minutes revealed the FED are still on course for a September rate hike. Risks remain to the downside for the USDJPY pair, as ongoing global trade tensions and US political woes are still unresolved. The MACD indicator across the four-hour time frame is also suggesting the next large directional move is about to occur.
The USDJPY pair is intraday bullish while trading above the 110.55 level, key resistance is found at the 111.00 and 111.47 levels.
If the USDJPY pair trades below the 110.55 level, sellers will likely test towards the 109.80 and 109.00 support levels.
EURUSD Correcting Ahead Of The ECB
The euro has moved back towards critical support against the US dollar, as the greenback firms ahead of today’s European Central Bank monetary policy meeting. The EURUSD pair retains its bullish bias while trading above the key 1.1554 level. ECB President Mario Draghi is likely to set the intraday tone for the euro currency today.
The EURUSD pair remains bullish while trading above the 1.1553 level, key resistance is found at the 1.1630 and 1.1680 levels.
If the EURUSD pair falls below the 1.1553 level, the price may correct back towards the 1.1507 and 1.1488 support levels.

Dovish FOMC Minutes, Oil Consolidates Gains
The Fed stutters
The US Federal Reserve Bank yesterday released minutes of its August monetary policy meeting: a 0.25% interest rate hike is signalled for September. Markets have reacted with confusion. Was the tone hawkish or dovish? Our view is that the lack of new evidence to increase the pace of hikes indicates a dovish Fed. US forward rates have come off their high; EUR/USD’s pullback is a function of trading dynamics rather than a shift in USD sentiment.
Markets will now shift their attention to the Jackson Hole monetary conference, Fed Chair Jerome Powell’s speech there and any reaction from President Trump. Trump continues to ask for easier monetary policy. He worries that tighter policy will kill the fiscal boost from his trade policies. In normal circumstances, Trump’s remarks would be ignored, but in light of Turkey's President Erdogan interventions, markets are sensitive to central bank independence. Honestly, there is a huge difference between Erdogan’s actions and Trump’s talk. We don’t expect Trump to act on impulses, besides, he has bigger worries with the Mueller investigation and convictions of Manafort and Cohen. Should the Democrats win November elections, we believe they will try to impeach Trump.
Oil up as US-China talks resume
Crude oil prices are bouncing from recent low, benefitting from a weakening dollar and from China’s threatened 25% duties on US gasoline, diesel and other refined products. As a Chinese delegation started discussion with US trade representatives in Washington on Wednesday, market sentiment is improving, pushing oil upward since the beginning of the week. US crude inventories drop in the week ending August 18 also support the trend: API and EIA estimates at -5.17 million barrels and -5.84 million (consensus: -1.50 million and -1.86 million) confirm a large US inventory draw.
Medium-term, US sanctions against Iran, the third largest OPEC producer, are supporting the idea of lower supply across the board. Iran’s largest oil client, China, is not expected to back the US, while India and Turkey (second and fourth largest Iran clients) will probably follow China. The US Department of Energy, in anticipation of Iran sanctions, will offer 11 million barrels from the Strategic Petroleum Reserve between 1 October and 30 November.
Trading at USD 67.70 per barrel, West Texas Intermediate crude is expected to decline slightly in the short-term, heading along 67.30.
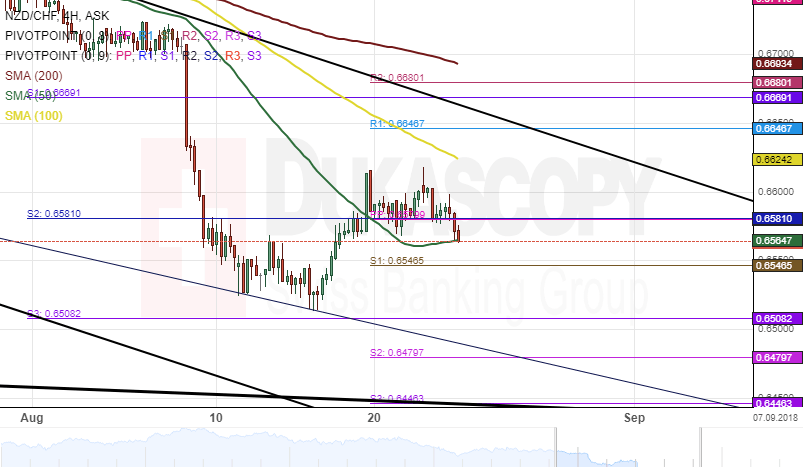
NZD/CHF 4H Chart: Pairs Movement Unclear
The bearish momentum which began mid-April has guided the New Zealand Dollar lower against the Swiss Franc. This movement marks a 7.60% decrease in price during this period.
The 100 and 200-hour SMAs has pushed the NZD/CHF exchange rate further south. However, it seems that the trend of the currency pair might be changing, as the 55-hour simple moving average has fallen below the price action.
Technical indicators formed by the MACD, Alligator and SAR flash bearish signals on the weekly time frame, thus indicating that some downside potential is still possible in regards to this pair.
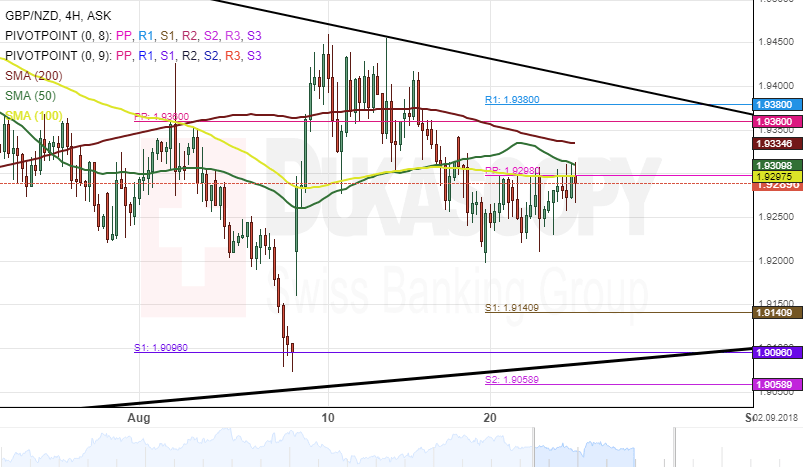
GBP/NZD 4H Chart: Bears Likely To Prevail
A downtrend line has guided the Pound Sterling movement against the New Zealand Dollar. The currency pair made a U-turn south after hitting the upper border of the trendline on July 13.
During the past few days, a resistance cluster formed by the combination of the 50-and 100-hour SMAs and the weekly pivot point at 1.9297 has provided a steep resistance for the pair.
Everything being equal, it is likely that the GBP/NZD currency exchange rate continue moving down during the following trading session for a potential target near the weekly S1 at the 1.9140 mark.
EUR/USD Returns To 1.1550
EUR/USD did not gain major positions in any direction on Wednesday, as the mid-session advance north was already erased by the end of the day. The rate managed to re-test the upper channel line and the weekly R3 at 1.1633 prior to falling down to the 55-hour SMA near 1.1550 this morning. Technical indicators have already started to edge slightly lower, suggesting that the bearish momentum could accelerate.
Given that no significant data releases are scheduled, the Euro could remain rather stable today in between the monthly S1 and S2 at 1.1580 and 1.1470, respectively. Further fall is unlikely due to the area being reinforced by the 200-hour SMA.
Meanwhile, the senior channel and the monthly PP are located at 1.1660.

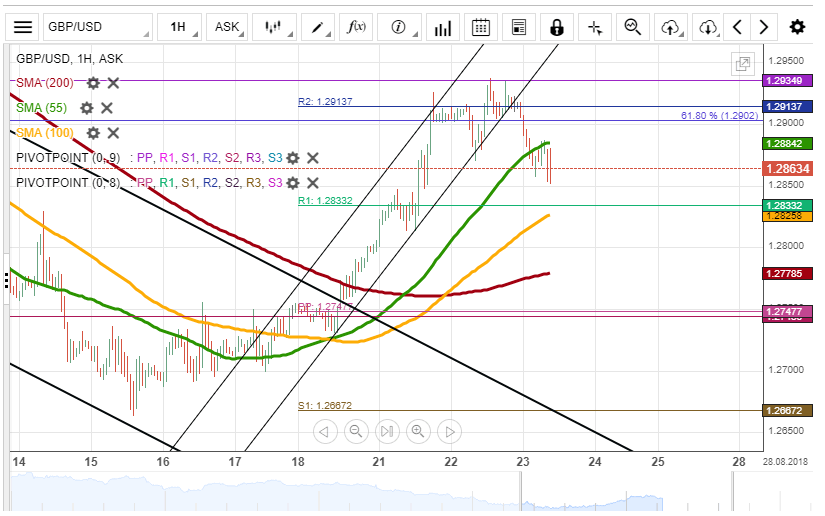
GBP/USD Heading South Today
The price of the GBP/USD exchange rate did not change significantly on Wednesday. The most important development during the previous session was a bearish breakout from the prevailing four-day ascending channel.
The Pound moving out of this steep pattern demonstrates that the strong bullish momentum which was guiding the rate since last Friday has allayed considerably. In case the 55-hour and 100-period (4H) SMAs at 1.2870 are breached, it is expected that the Pound continues to edge even lower down to the monthly S2, the weekly PP and the 55-period SMA at 1.2750.
In terms of the upside, it is unlikely that the weekly S3 at 1.30 is breached, given that this level is likewise reinforced by the 200-period SMA.
USD/JPY Passes Monthly PP
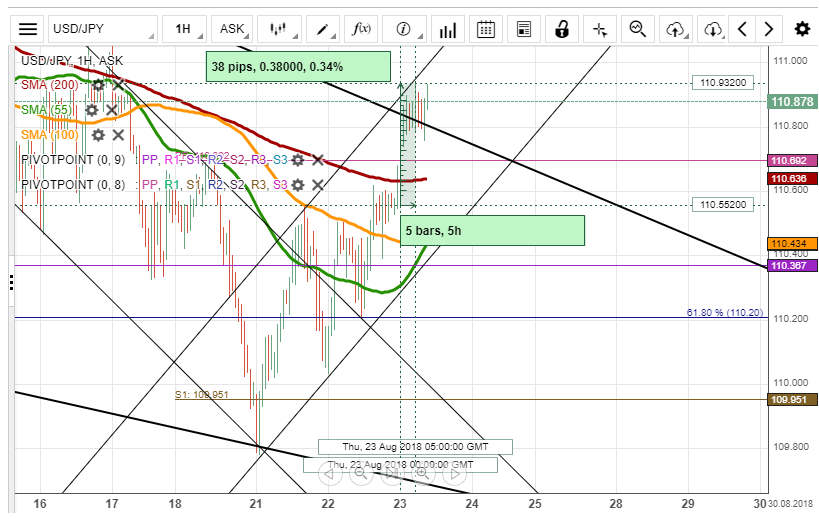
The Japanese Yen has still be depreciating against the US Dollar during the last two days. The main pair passed through the monthly PP( 110.692) at midnight on Thursday. In general, the US Dollar recovered 0.34% from Wednesday night until Thursday morning.
On Thursday morning, the main pair was at 1.1083 showing bullish signals. The US Dollar passed through all SMAs during the night. The 200-hour simple moving average is expected to be the support for the currency pair for the day. It seems that the 55-hour and 100-hour SMAs should cross at today's trading session giving strong buy signals for traders.
XAU/USD Shows Strong Bearish Signals
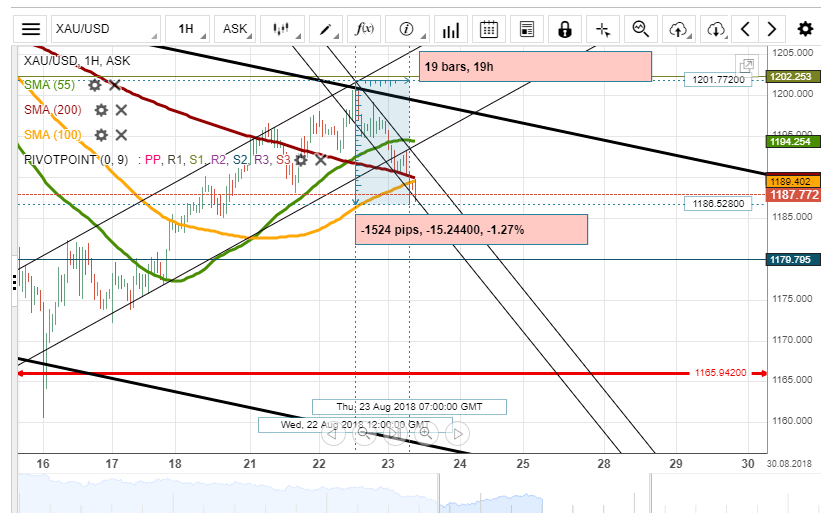
The yellow metal has depreciated 1.27% against the US Dollar since mid-Wednesday. The pair tested the bottom boundary of the trend line at 1,186.53 early on Thursday, which created a new down-trend.
During Thursday morning hours, Gold was at 1,190.03, testing the 200-hour SMA as additional support level to recover itself. However, the yellow metal passed the 200– hour simple moving average at 7:00 GMT on Thursday, which shows strong bearish signals for traders.
Insignificant data releases are scheduled for today's trading session which may keep the yellow metal between the 55-hour and 200-hour SMAs.
The Analytical Overview Of The Main Currency Pairs
The EUR/USD currency pair
Technical indicators of the currency pair:
Prev Open: 1.15703
Open: 1.15938
% chg. over the last day: +0.12
Day's range: 1.15591 – 1.15744
52 wk range: 1.0571 – 1.2557
The technical pattern on the EUR/USD currency pair is ambiguous. Quotes are in a sideways trend. Investors assess the FOMC minutes. At the moment, the key support and resistance levels are 1.15400 and 1.15800, respectively. We recommend opening positions from these marks.
The news feed on 2018.08.23:
Data on economic activity in Germany and the Eurozone at 10:30 (GMT+3:00) and 11:00 (GMT+3:00);
Publication of the ECB account of monetary policy meeting at 14:30 (GMT+3:00);
New home sales in the US at 17:00 (GMT+3:00).
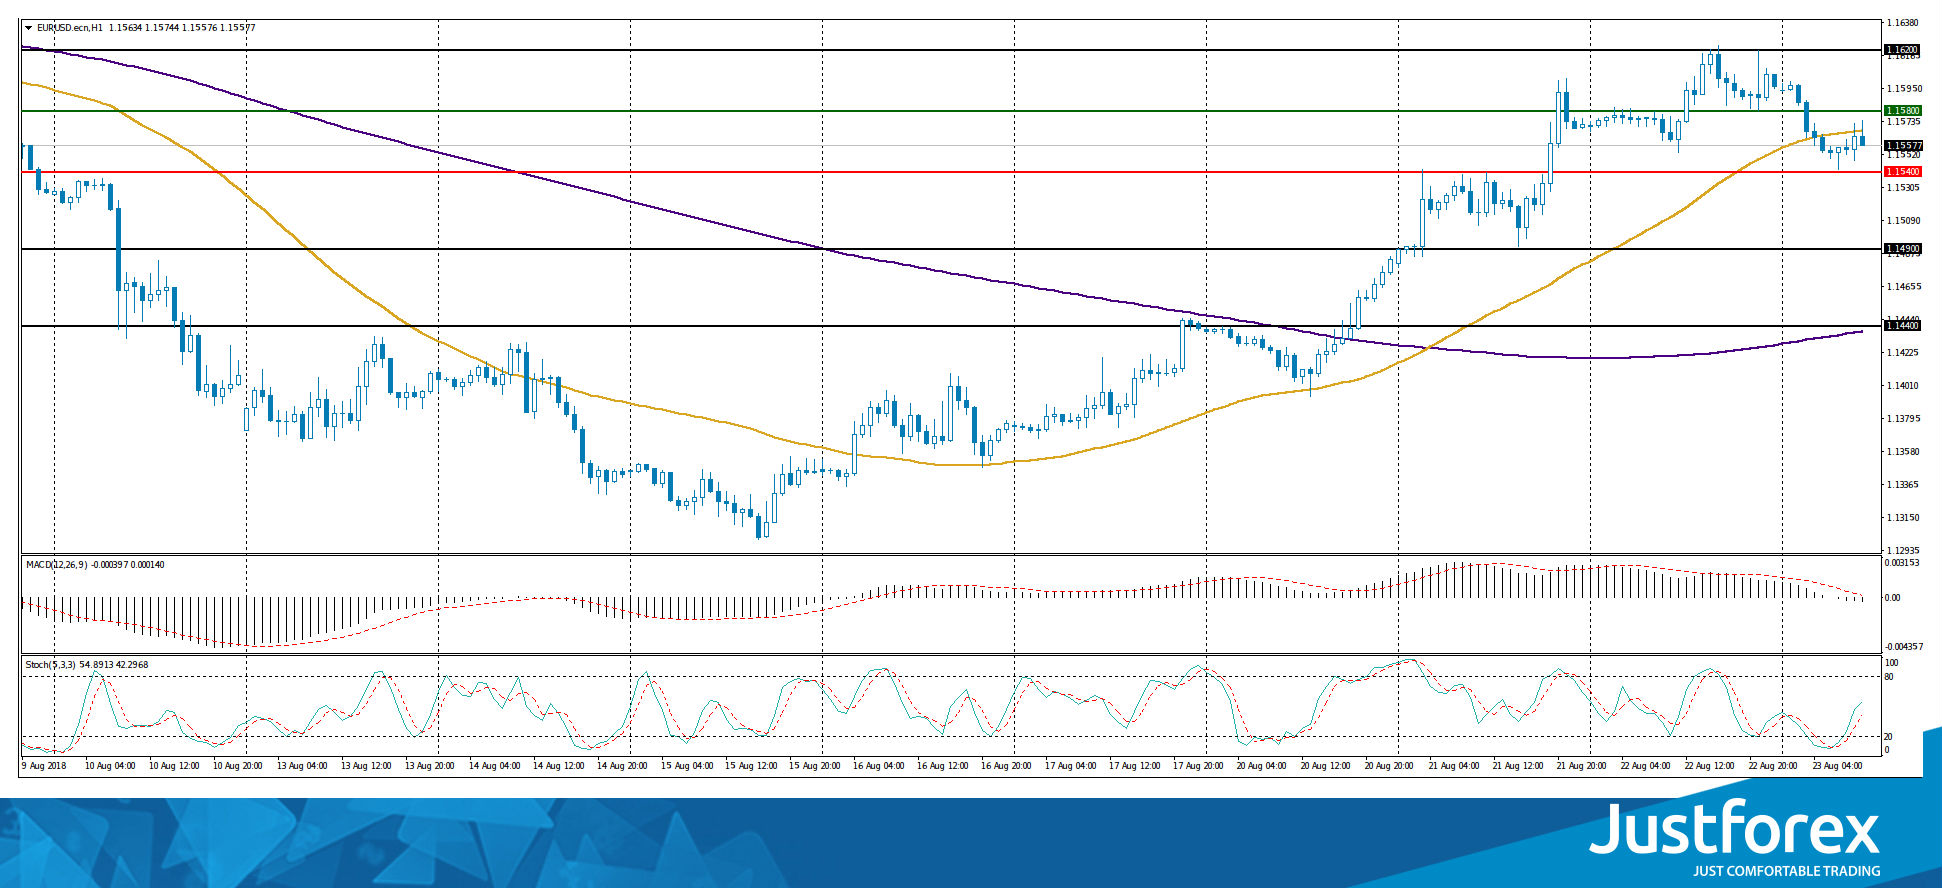
Indicators do not send accurate signals: the price is testing 50 MA.
The MACD histogram is located near the 0 mark.
Stochastic Oscillator is in the neutral zone, the %K line is above the %D line, which indicates the EUR/USD quotes growth.
Trading recommendations
Support levels: 1.15400, 1.14900, 1.14400
Resistance levels: 1.15800, 1.16200
If the price fixes above the resistance level of 1.15800, the growth of the EUR/USD currency pair is expected. The movement is tending to 1.16200-1.16500.
Alternative option. If the price fixes below 1.15400, we recommend considering sales of EUR/USD. The movement is tending to 1.14900-1.14700.
The GBP/USD currency pair
Technical indicators of the currency pair:
Prev Open: 1.28750
Open: 1.29006
% chg. over the last day: +0.03
Day's range: 1.28741 – 1.28831
52 wk range: 1.2361 – 1.4345
There is a variety of trends on the GBP/USD currency pair. Financial market participants expect additional drivers. At the moment, the local support and resistance levels are 1.28600 and 1.28900, respectively. The positions should be opened from these marks.
The news feed on the UK economy is calm.
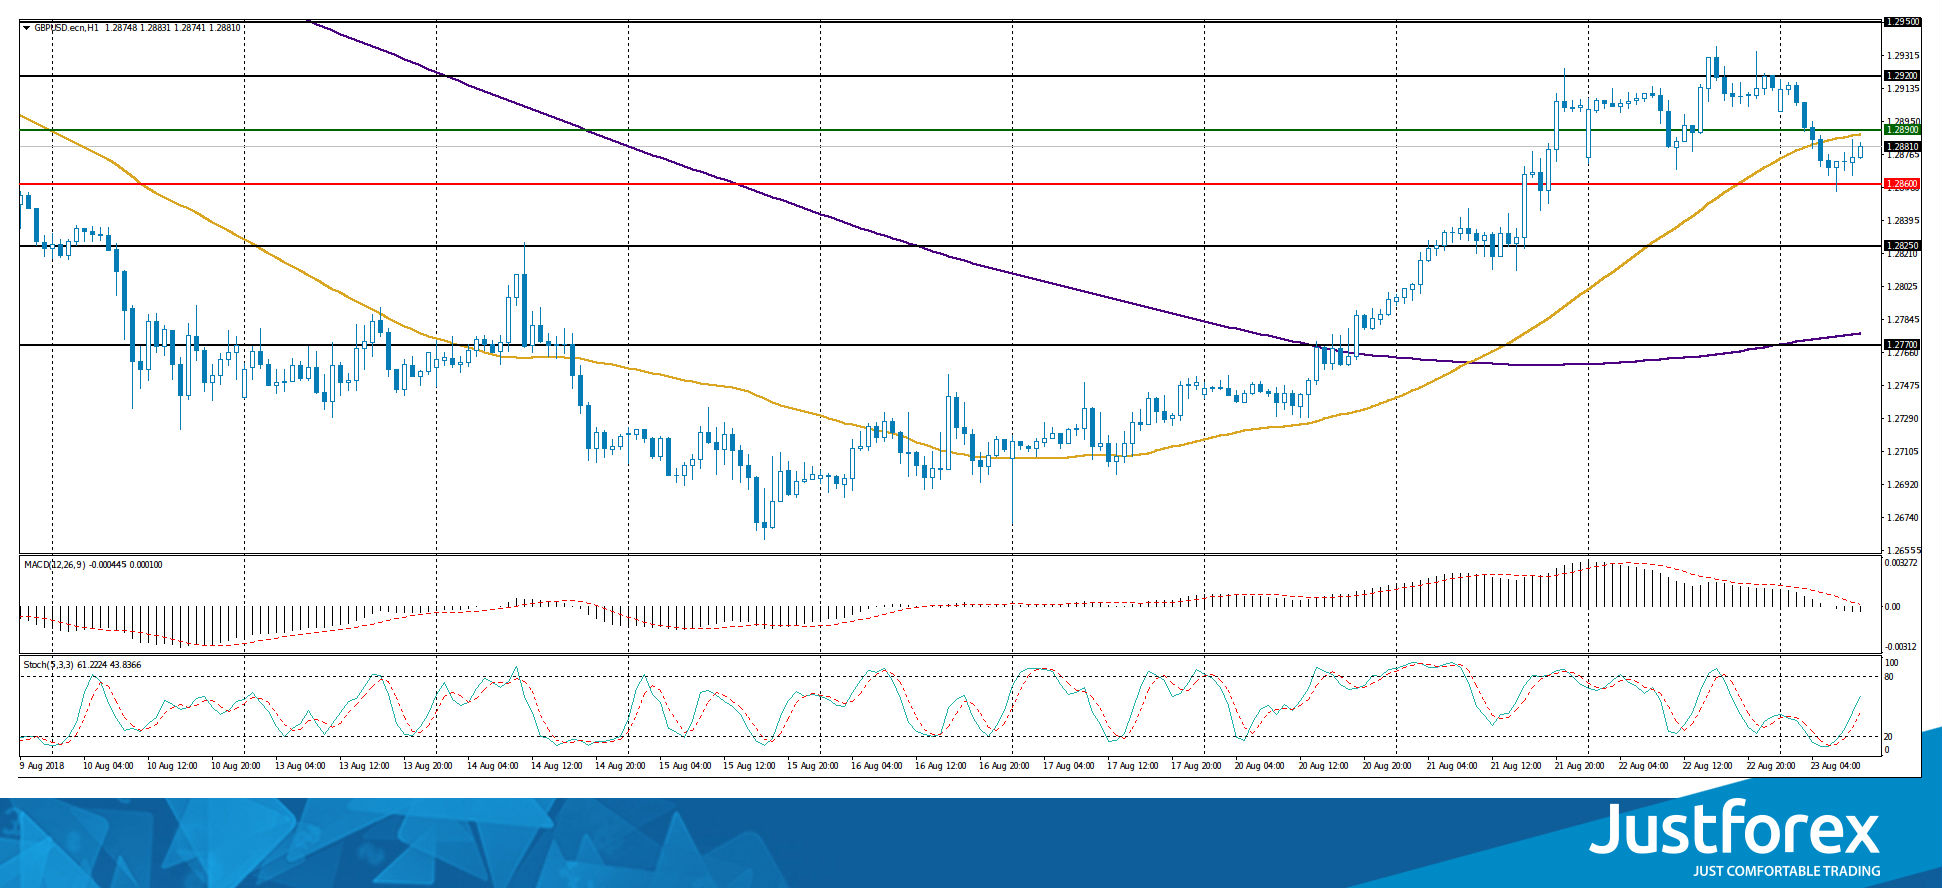
Indicators do not send accurate signals: the price is being traded between 50 MA and 200 MA.
The MACD histogram has moved to the negative zone, which indicates a decrease in the GBP/USD quotes.
Stochastic Oscillator is located in the neutral zone, the %K line is above the %D line, which signals to buy GBP/USD.
Trading recommendations
Support levels: 1.28600, 1.28250, 1.27700
Resistance levels: 1.28900, 1.29200, 1.29500
If the price fixes above 1.28900, the GBP/USD currency pair is expected to grow. The target movement level is 1.29200-1.29500.
Alternative option. If the price fixes below 1.28600, we recommend considering sales of GBP/USD. The target movement level is 1.28250-1.28000.
The USD/CAD currency pair
Technical indicators of the currency pair:
Prev Open: 1.30367
Open: 1.29893
% chg. over the last day: -0.21
Day's range: 1.30334 – 1.30458
52 wk range: 1.2059 – 1.3795
Yesterday, the bearish sentiment was observed on the USD/CAD currency pair. However, today quotes are recovering. At the moment, the local support and resistance levels are 1.30250 and 1.30500, respectively. We recommend opening positions from these marks. The trading instrument has the potential for further growth.
The news feed on the economy of Canada is calm.
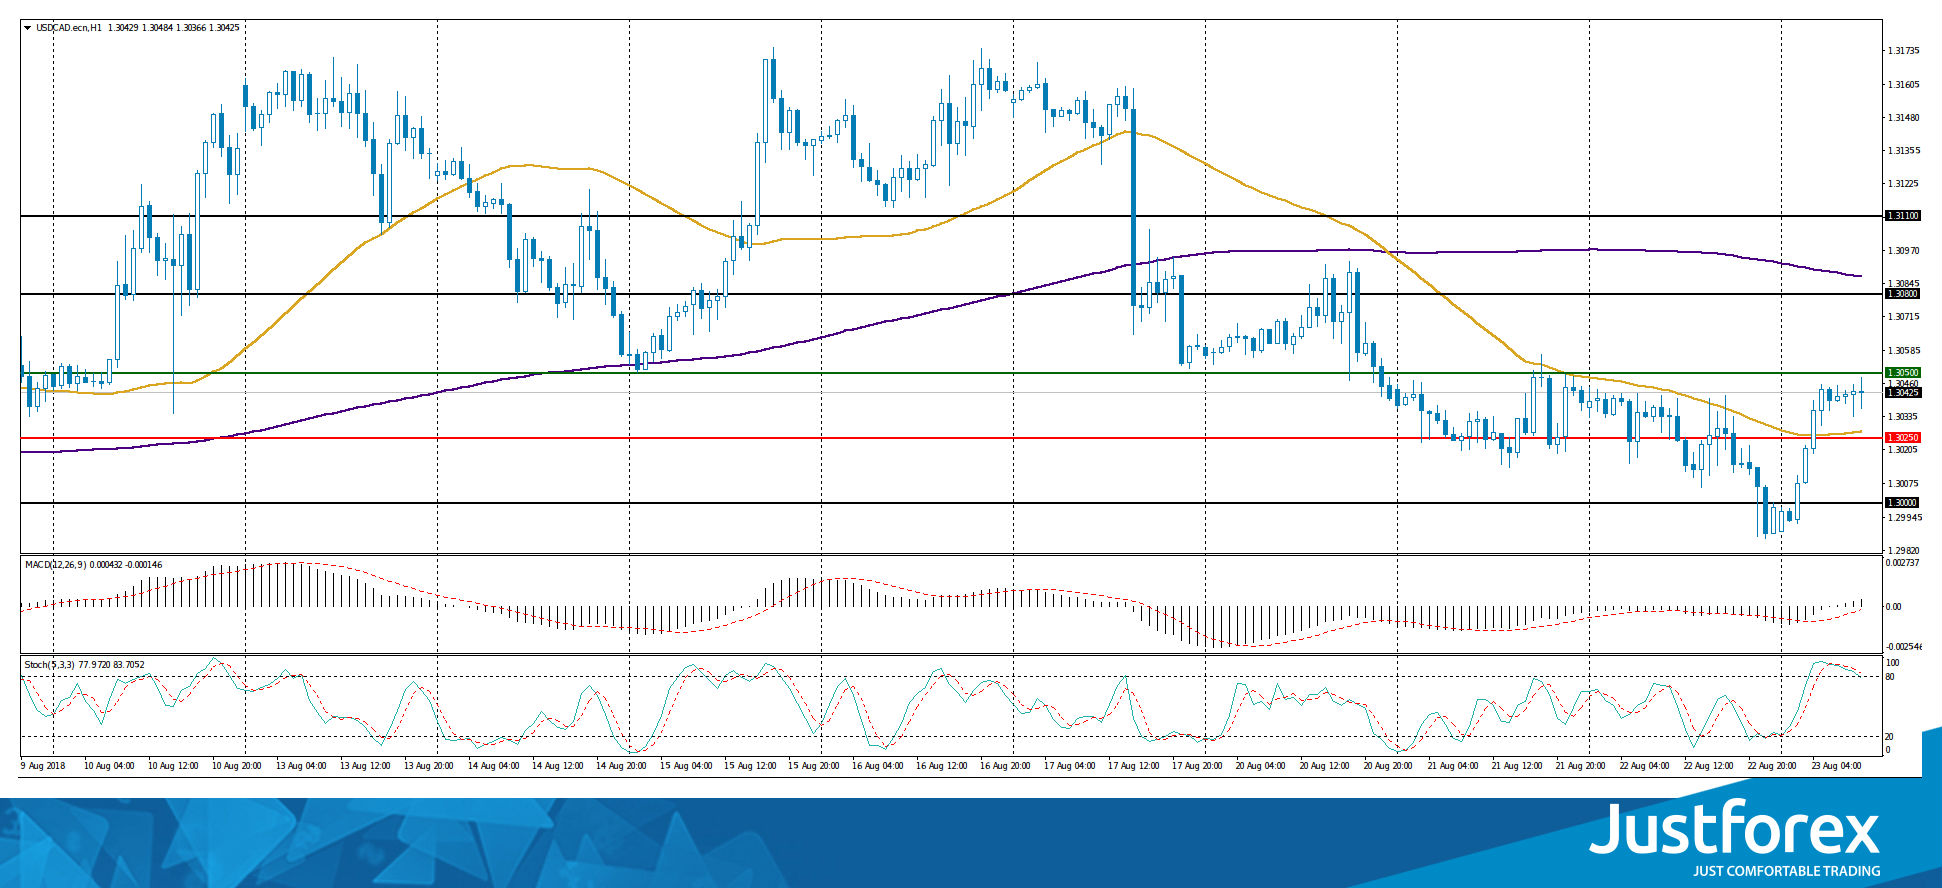
The price has fixed between 50 MA and 200 MA, which are strong dynamic support and resistance levels.
The MACD histogram has moved to the positive zone, which indicates the USD/CAD quotes growth.
Stochastic Oscillator is located in the overbought zone, the %K line is below the %D line, which gives a signal to sell USD/CAD.
Trading recommendations
Support levels: 1.30250, 1.30000
Resistance levels: 1.30500, 1.30800, 1.31100
If the price fixes below 1.30250, the USD/CAD quotes are expected to decline. The movement is tending to 1.30000-1.29800.
Alternative option. If the price fixes above the resistance of 1.30500, it is necessary to consider purchases of USD/CAD. The movement is tending to 1.30800-1.31100.
The USD/JPY currency pair
Technical indicators of the currency pair:
Prev Open: 110.231
Open: 110.549
% chg. over the last day: +0.25
Day`s range: 110.787 – 110.882
52 wk range: 104.56 – 114.74
There is the bullish sentiment on the USD/JPY currency pair. During yesterday's and today's trading sessions, quotes have risen by more than 80 points. At the moment, quotes are testing the local resistance level of 110.900. Local support is the level of 110.700. The positions should be opened from these marks.
The news feed on the economy of Japan is calm.
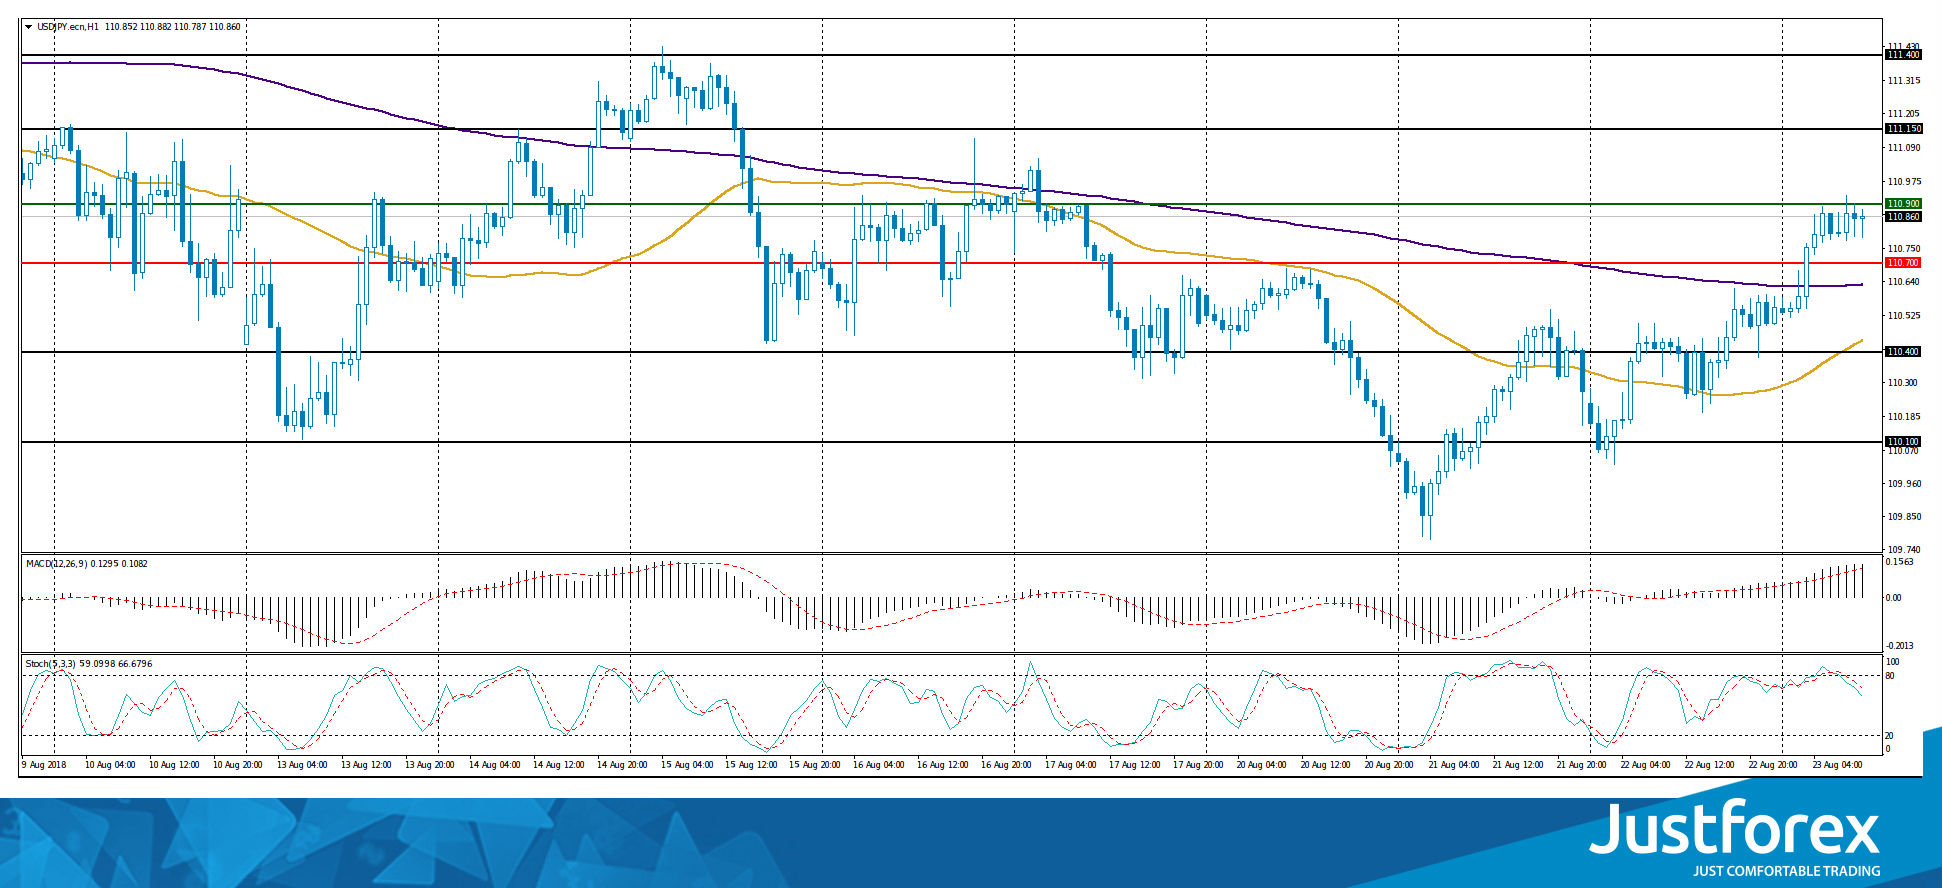
Indicators point to the power of buyers: the price is above 50 MA and 200 MA.
The MACD histogram is in the positive zone, above the signal line, which gives a strong signal to buy USD/JPY.
Stochastic Oscillator is located in the neutral zone, the %K line is below the %D line, which indicates a decrease in quotes.
Trading recommendations
Support levels: 110.700, 110.400, 110.100
Resistance levels: 110.900, 111.150, 111.400
If the price fixes above the resistance level of 110.900, the growth of the USD/JPY currency pair is expected. The movement is tending to 111.150-111.400.
Alternative option. If the price fixes below the 110.700 mark, it is necessary to consider sales of USD/JPY. The movement is tending to 110.400-110.100.