Sample Category Title
USDCHF Wave Analysis
USDCHF: ⬇️ Sell
- USDCHF broke support zone
- Likely to fall to support level 0.8200
USDCHF currency pair recently broke the support zone between the key support level 0.8400 (which reversed the price multiple times in August and September) and the support trendline of the daily down channel from February.
The breakout of this support zone accelerated the active intermediate impulse wave (3).
USDCHF currency pair can be expected to fall to the next support level 0.8200, which is the target price for the completion of the active impulse wave (3).

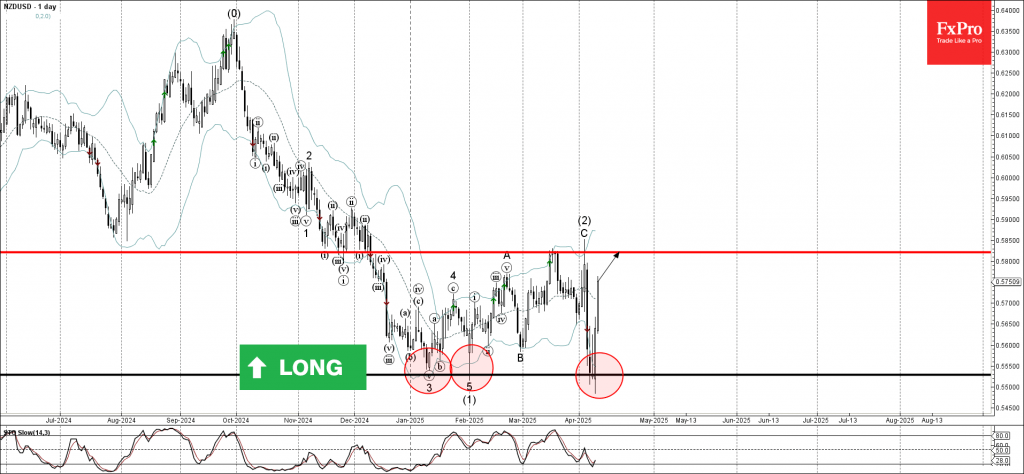
NZDUSD Wave Analysis
NZDUSD: ⬆️ Buy
- NZDUSD reversed from support zone
- Likely to rise to resistance level 0.5820
NZDUSD currency pair recently reversed from the support zone between the key support level 0.5530 (which has been reversing the price from January) and the lower daily Bollinger Band.
The upward reversal from the support level 0.5530 created the daily Japanese candlesticks reversal pattern Morning Star Doji.
Given the strongly bearish US dollar sentiment, NZDUSD currency pair can be expected to rise to the next resistance level 0.5820.
Fed’s Schmid still squarely focused on inflation outlook
Kansas City Fed President Jeff Schmid delivered a hawkish message today, emphasizing that his primary focus remains “squarely” on the inflation outlook.
He flagged a notable increase in upside inflation risks alongside rising downside risks to employment and growth, painting a challenging picture for policymakers.
However, he emphasized, "With renewed price pressures likely, I am not willing to take any chances when it comes to maintaining the Fed's credibility on inflation."
Addressing the inflationary impact of tariffs, Schmid acknowledged that while economic theory suggests a one-off price shock rather than sustained inflation, he’s not inclined to rely too heavily on that assumption under current conditions.
“I would be hesitant to take too much solace from theory in this environment,” he noted, referencing recent episodes of persistently high inflation that caught many off guard.
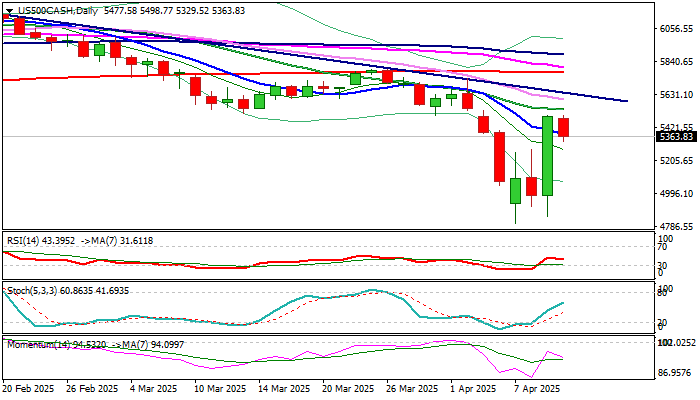
S&P Rose Sharply on Tariff Policy U-turn But More Work at the Upside Still Needed to Neutralize Downside Risk
S&P500 edged lower on Thursday after rallying 10.2% previous day (the biggest daily gains in over a decade).
Unexpected decision of President Trump to put heavy tariffs on a number of countries on hold for 90 days, revived optimism and lifted stock markets.
Although fresh rally retraced the largest part of heavy losses sparked by introduction of tariffs last week, markets remain cautious as the US tariffs on imports from China were not affected by the latest decision but were increased to 125%.
This raises worries of strong escalation of trade conflict between two world’s largest economies, which could have a domino effect on most countries.
Further development of the situation will be closely watched with positive scenario seeing a trade deal between two countries that would provide further relief and boost stock prices, while escalation would further sour the sentiment and add fresh pressure on prices.
Daily studies have slightly improved following Wednesday’s strong rally, but overall picture remains predominantly bearish and warn that downside risk still exists.
In ideal scenario, corrective dips from Wednesday’s peak should be shallow and contained above $5230 (Fibo 38.2% of $4801/$5495) to mark healthy correction and keep near term bias with bulls, though sustained break above $5500 zone, will be still needed to validate reversal signal.
Caution on dip and close below $5200/$5150 zone which could sideline fresh bulls and revive downside risk.
Res: 5457; 5496; 5532; 5636
Sup: 5330; 5267; 5230; 5200
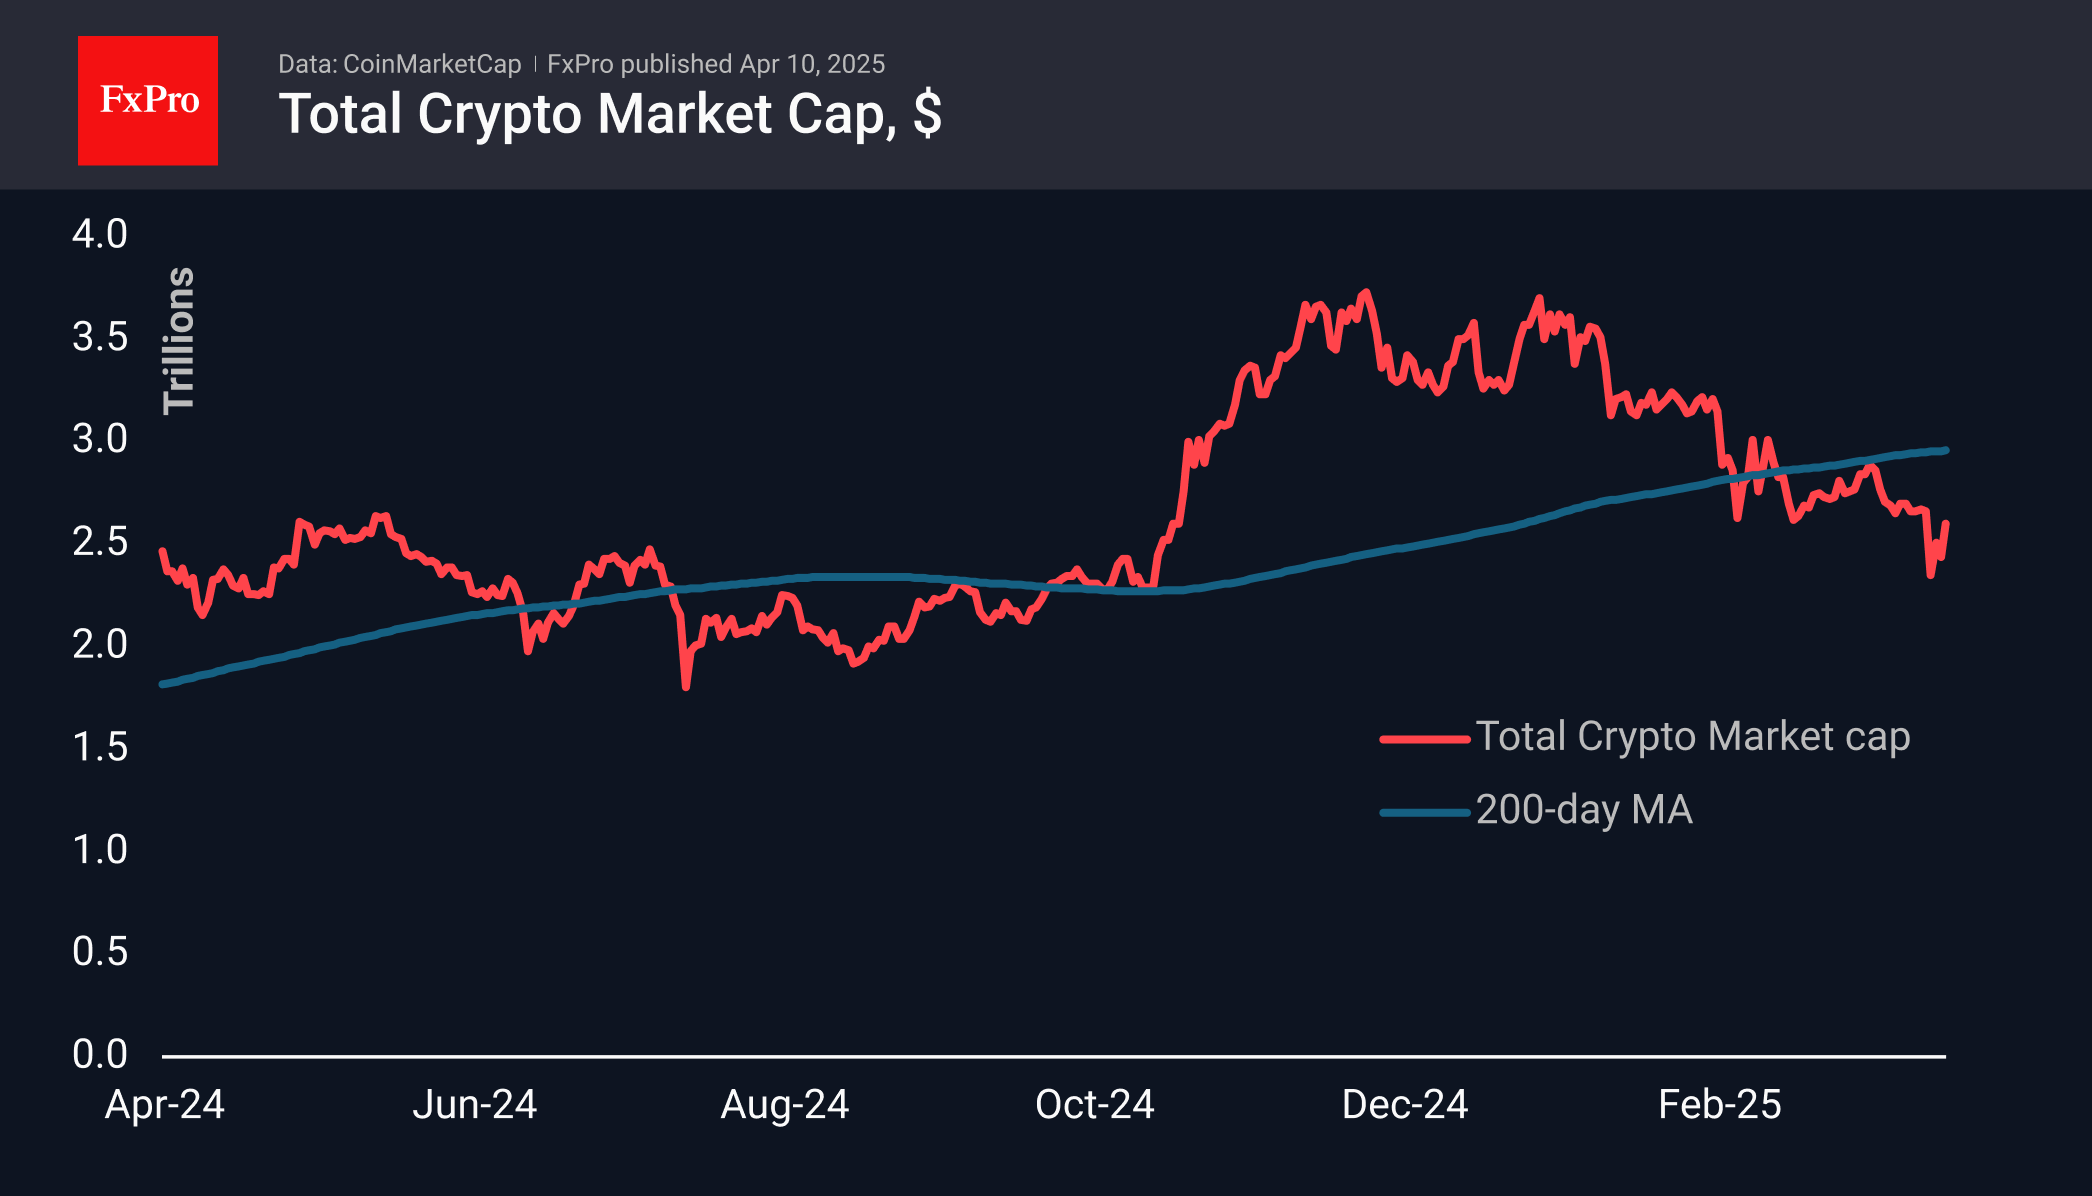
Crypto Market Stabilises After Rebound
Market Picture
The cryptocurrency market cap has stabilised near a key level since the start of the week and went up steadily on the back of tariff news following the rise in equities. However, the spurt was half that of equities. Total capitalisation reached $2.60 trillion, pushing back from support near $2.3 trillion, the level from which the rally began late last year. So far, the rise has been met with caution as capitalisation has yet to cross its 200-day moving average, which is pointing upwards and approaching $2.96 trillion.
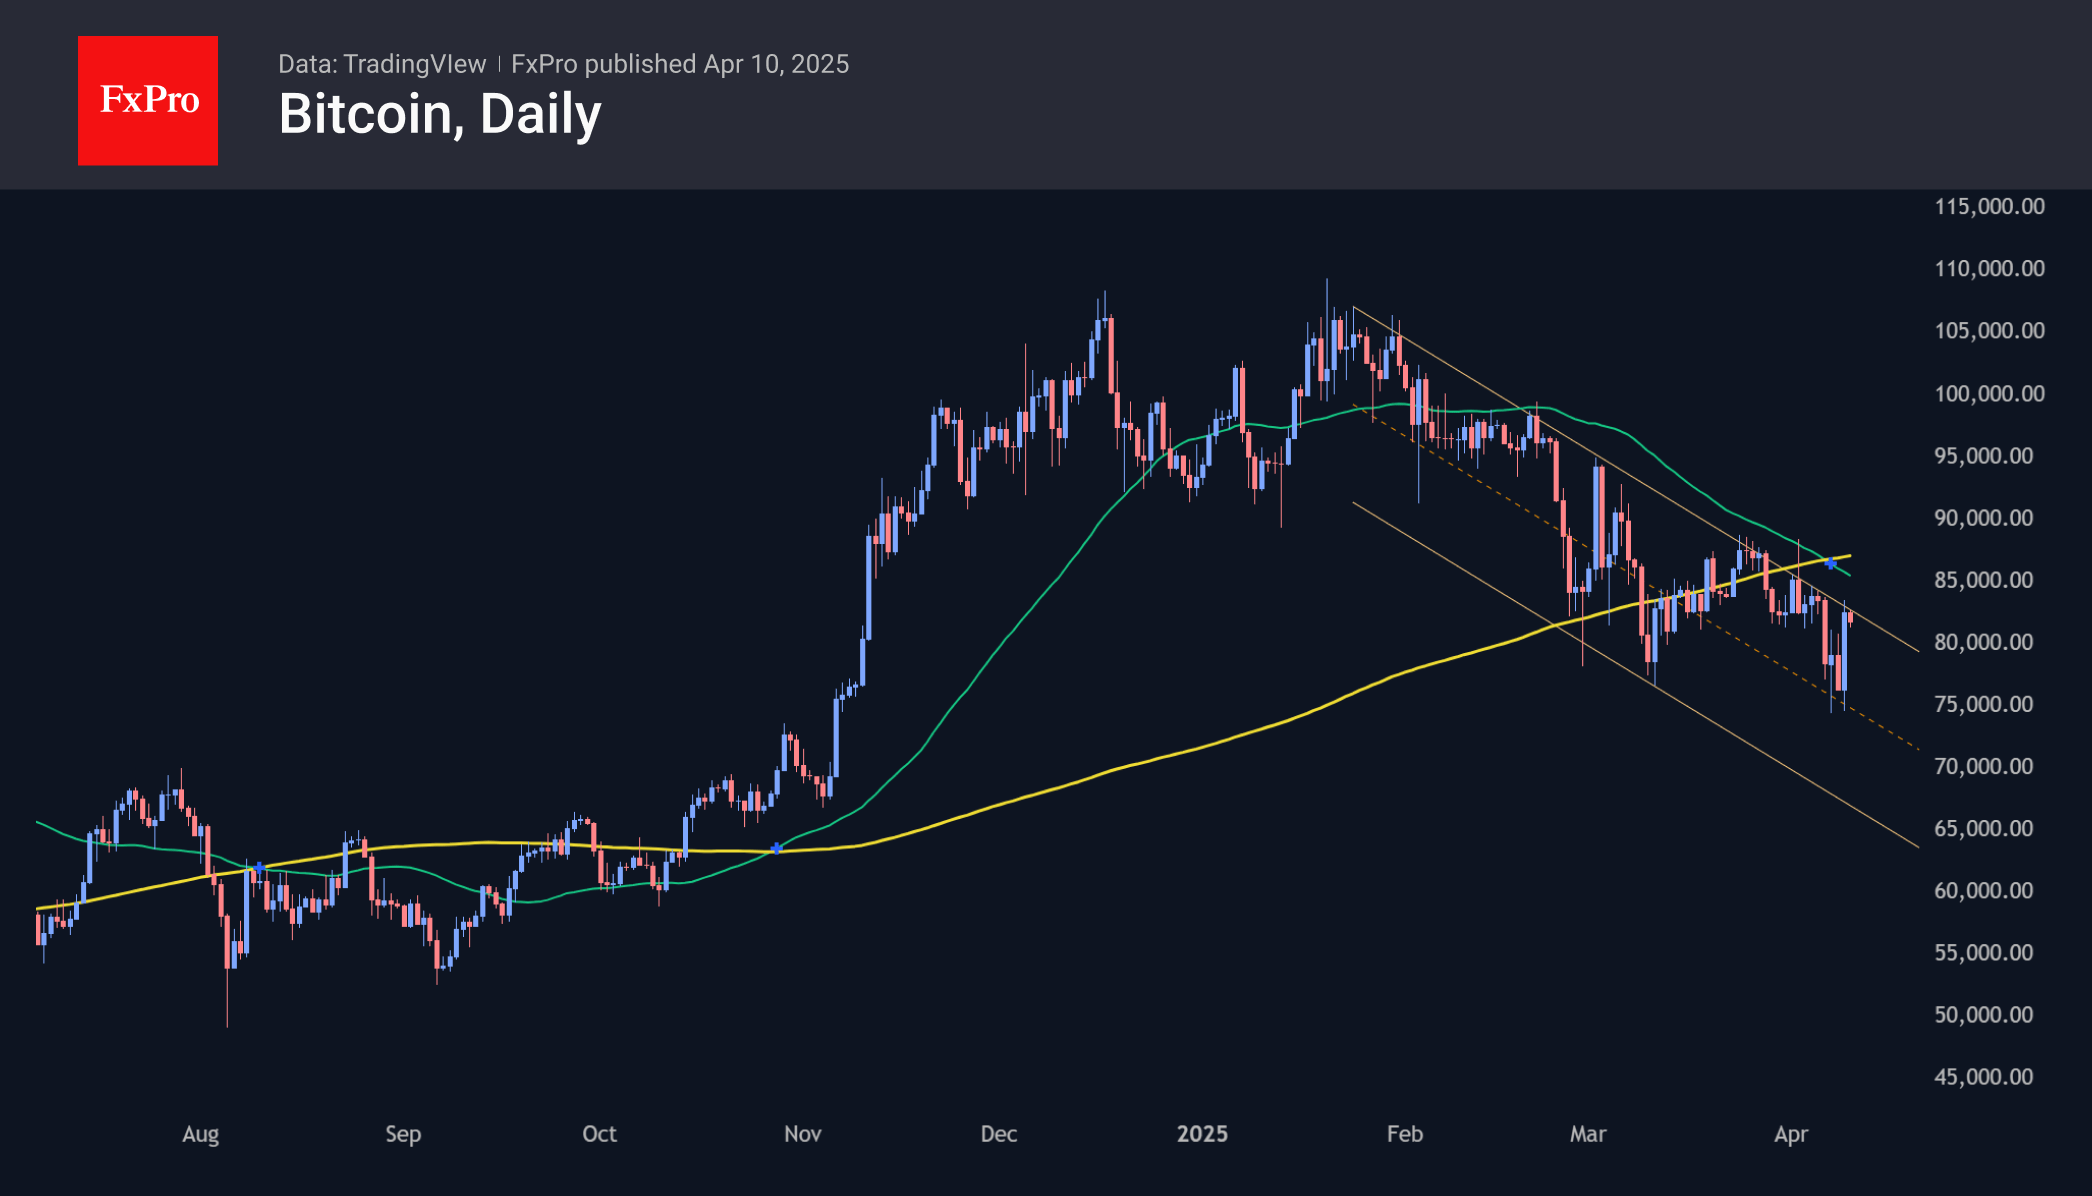
Bitcoin held firmly below $75K support at the beginning of the week. The recent growth spurt has lifted the price above $80K, which can be considered a comfort zone. However, the first cryptocurrency approached the upper boundary of the downtrend, and the main test of the two-month trend is just beginning.
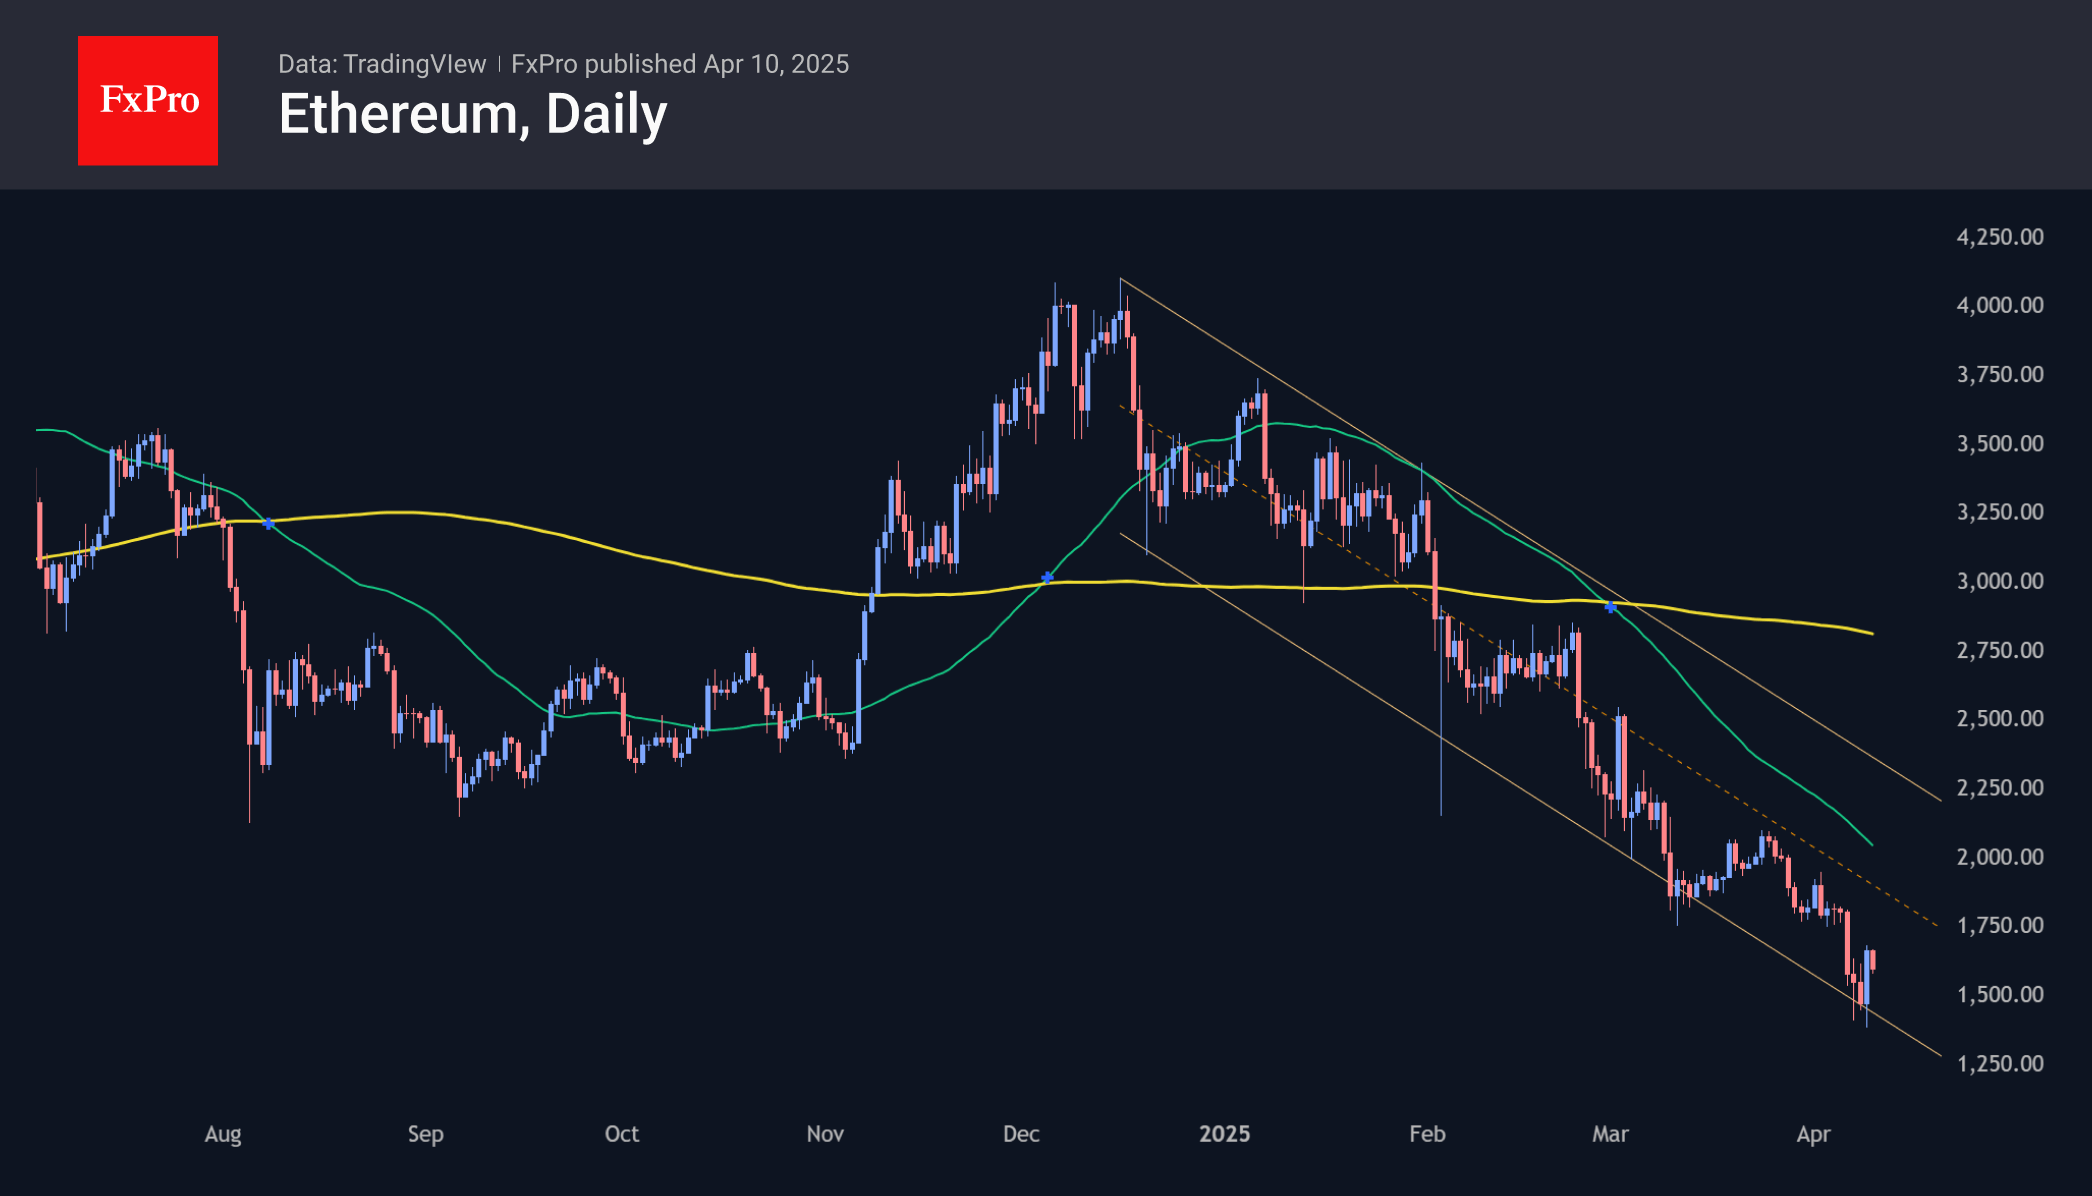
Ethereum is showing weakness relative to the market, dipping below $1400 at the lows of the week and bouncing back later to $1600. This bounced off the lower boundary of the descending corridor, and the upper boundary was near $1900. This level will be an important point to watch for a possible upside development.
News Background
Ripple announced the purchase of the Hidden Road platform for $1.25bn. The deal will strengthen the XRP ecosystem, including the RLUSD stablecoin, the XRPL blockchain, and the Ripple Payments service.
Cardano founder Charles Hoskinson said the crypto industry needed a ‘cooperative balance’ to compete with centralised tech giants in the race for Web3. He noted that DeFi’s key challenge remains the ‘closed economy.’
According to Artemis Terminal, the crypto industry has lost about 40% of active Web3 developers in a year—an important marker of the ecosystem’s poor health.
British Pound Surges Higher, UK GDP Next
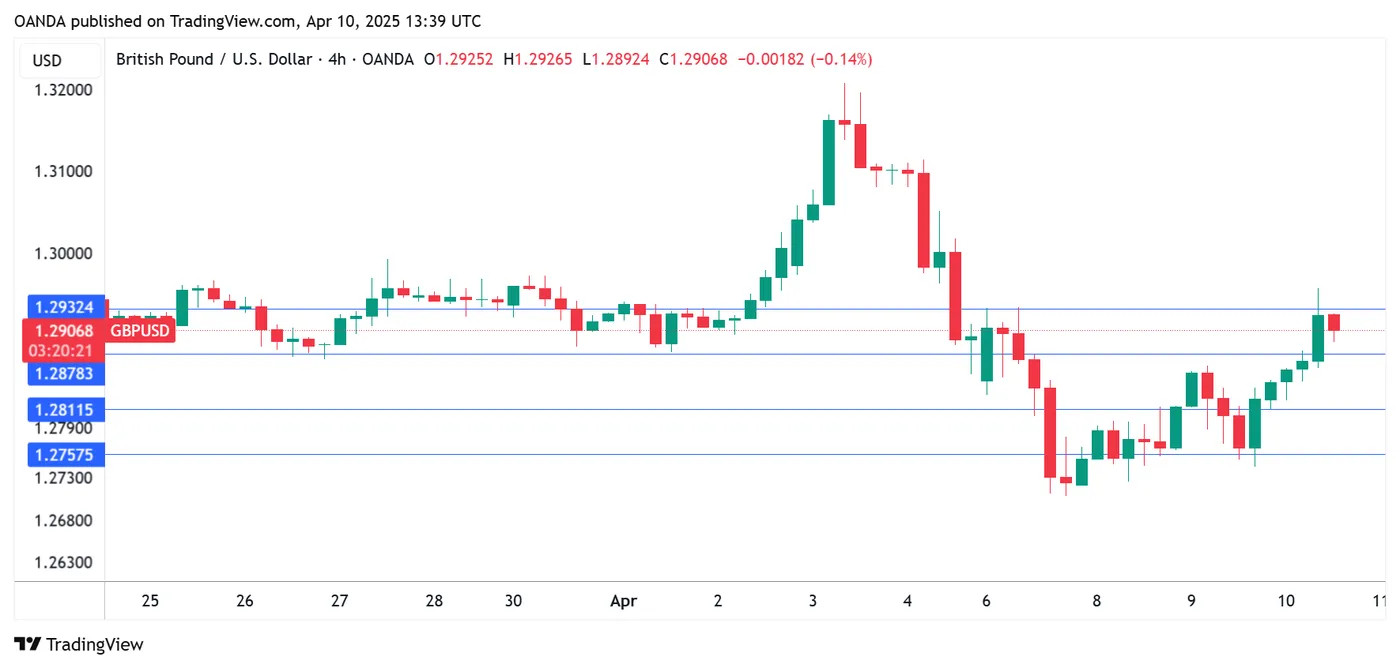
The British pound has posted sharp gains on Thursday. In the North American session, GBP/USD is trading at 1.2914, up 0.78% on the day.
Markets recover as Trump suspends tariffs
Global equity markets are showing sharp volatility which is also apparent in the currency market. The pound posted sharp losses after the latest round of US tariffs took effect, but has surged higher following US President Trump's surprise annoucement that he would reduce all country-specific tariffs to 10% except for China, for 90 days. The dramatic development sent stock markets soaring on Wednesday.
Fed minutes: concern over tariffs
Overshadowed by the wild swings in the financial market, the Fed released the minutes of the March rate meeting on Wednesday. Fed officials are clearly worried about US trade policy as the minutes mentioned tariffs 18 times.
Members viewed risks to inflation to be tilted to the upside and expected inflation to rise this year due to the effect of higher tariffs. Some members warned of "difficult tradeoffs" if inflation remained persistent and growth and employment weakened.
Will the Federal Reserve accelerate its easing cycle due to the tariff turmoil? The markets don't think so, even though there is increasing concern about weaker US growth. If the US goes ahead with its stiff tariff policy, inflation would likely rise in the US, complicating the Fed's plans to gradually reduce rates during the year. The markets have priced in a rate hike in May at just 17%, according CME FedWatch.
The UK economy is stuggling and the GDP report isn't likely to show much improvement. The market estimate is 0.1% m/m for February growth after -0.1% in January. For the three months to February, the market estimate is 0.4%, following 0.2% in the previous release.
GBP/USD Technical
- GBP/USD has pushed above resistance at 1.2878. The next resistance line is 1.2932
- There is support at 1.2811 and 1.2757
Sunset Market Commentary
Markets
Today’s trading should show the Trump (bond) put at work, including the hoped-for positive spill-overs on other assets. The US president buying time/giving room to negotiate trade arrangements with the US, yesterday triggered a sharp bounce in US equities and so did Asian and European indices this morning. However, after a swift first reaction, the move stalls. European indices mostly trade off the opening top (EuroStoxx 50; +5.0%). US indices return about 2% of yesterday’s gain (S&P 500). (US) Bond markets are looking for a new equilibrium, balancing reduced need of immediate Fed help and a further hoped-for reduction in risk premia at the long end of the curve. The Trump tariff-put clearly isn’t of the same nature as an outright ‘Fed-bailout’ that occurred e.g. at the time of corona. US bond investors are taking a wait-and-see mode. (Political) policy uncertainty remains high. A flaring-up of the sell-US trade isn’t excluded yet. Intraday, US yields temporary lost a few additional bps after the release of softer than expected US March CPI (-0.1% M/M and 2.4% Y/Y from 2.8% for headline; 0.1% M/M and 2.8% Y/Y for core). This is good news, but is a photo from a different era before extreme turmoil from the reciprocal tariffs culminated. It’s a better starting point, but tells little about the dynamic going forward. The US yield curve steepens with the 2-y declining 8 bps. The 30-y yield adds 2 bps. This evening’s $22bn 30-y Treasury action for sure is a better pointer on the strength of the Trump put. For now we’re not impressed by the easing in risk premia at the long end of the US curve. German yields show different dynamics. The German 2-y yield jumps 11 bps. The 2-y swap adds 4 bps. This captures reduced expectations for ECB support to counter demand pressures from the tariffs as well as an easing of the safe haven bid for bunds. The 10-y currently adds 2 bps. The jury is still out, but if long-term Bunds indeed are gaining a bigger overall safe haven role, the modest decline in bonds/rise in yields suggests investors are in no big hurry to return protection. The US government probably hopes for an orderly further weakening of the dollar. In this respect, Trump’s tariff pause at least didn’t change a poor USD performance of late. DXY falls from an 103 open to currently trade near 101.8. EUR/USD regains strong traction testing the 1.11 area. The YTD top (1.114) is within reach. The 1.1276 2023 top is looming on the horizon. Also Brent oil fails to stay north of $65b.
Trade-related uncertainty earlier this week put hefty pressure on smaller, less liquid currencies including the likes of the Norwegian and Swedish krone and the CE currencies (CZK, HUF, PLN). They gained against the euro in thin post-European trading yesterday, but mostly trade again in the defensive today. Another pointer that overall trade-related uncertainty still lingers? A similar narrative applies to sterling. EUR/GBP yesterday evening dropped from the 0.865 area to about 0.855. Sterling today gains against an overall weak dollar, but EUR/GBP trades again at 0.86+. In this respect, the modest easing at the LT end of the UK yield curve (30-y -12 bps at 5.45%, only slightly more than halve of yesterday’s rise) also doesn’t give that much comfort.
News & Views
Last week’s preliminary Czech inflation today confirmed with prices rising 0.1% M/M and 2.7% Y/Y. Today, the Czech National Bank commented on the release. IT was slightly higher than the 2.6% projected in the February monetary policy report. Core inflation stayed at 2.5% (vs 2.4% expected). Within core inflation, prices of goods rose 0.1% and prices of services by 4.2%. Imputed rent rose 3.6% Y/Y, driving up both core and headline inflation. Inertia in services inflation, including imputed rent, continues to pose a risk to keep inflation close to target and confirms that the cautious approach to easing monetary policy is appropriate. CNB expects annual inflation to fall temporarily due to base effects. The near term effect of the trade wars could be observed in lower oil and commodity prices, but longer term tariffs may have an inflationary effect. This strengthen the case for a final 25 bps CNB rate cut in May (to 3.5%) before installing a long pause. EUR/CZK trades slightly higher today within the broad 24.90-25.50 trading range
The EU will delay for 90 days the countermeasures over 25% imports on steel and aluminum exports announced only yesterday. They targeted around €21bn of US goods but are suspended after Trump lowered the reciprocal tariff rate to EU exports from 20% to 10%. EC President von der Leyen wants to give negotiations a chance. If they fail, countermeasures will kick in. Preparatory work on further measures continues as well with the US preparing tariffs on lumber, semiconductor chips and pharmaceutical products.
Fed’s Logan: Tariff driven inflation mustn’t take root
Dallas Fed President Lorie Logan emphasized today that Fed must be vigilant in preventing tariff-related price increases from "fostering more persistent inflation".
She noted that the inflationary impact of tariffs hinges on two key variables: how rapidly businesses pass higher import costs onto consumers, and whether long-term inflation expectations stay anchored.
"A sustained burst of inflation could lead households and businesses to expect further price increases, especially following the persistently elevated inflation in recent years." she warned.
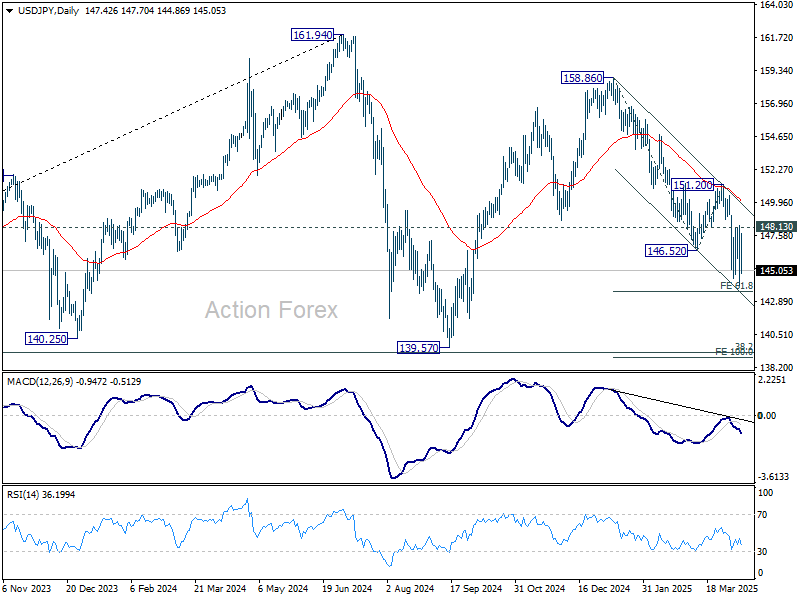
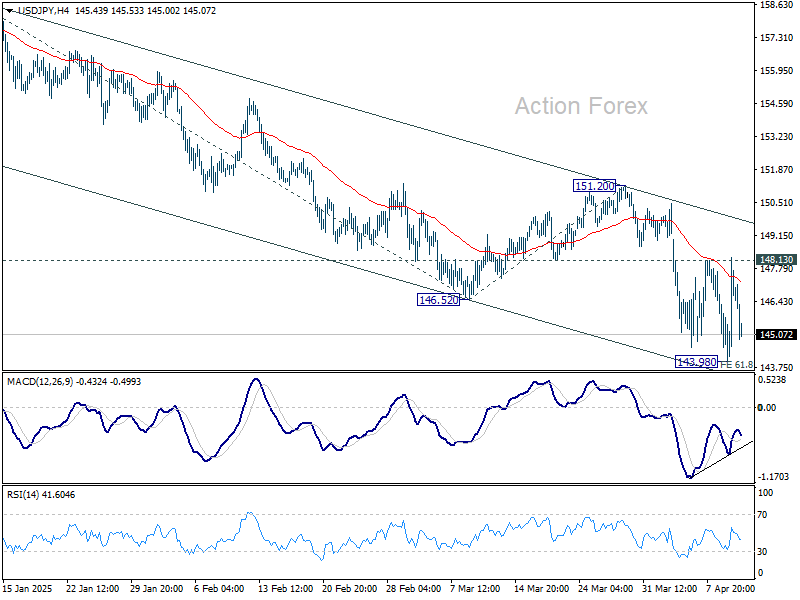
USD/JPY Mid-Day Outlook
Daily Pivots: (S1) 145.08; (P) 146.68; (R1) 149.36; More...
No change in USD/JPY's outlook and intraday bias stays neutral. On the upside, firm break of 148.13 resistance will confirm short term bottoming, and turn bias back to the upside for 151.20 resistance. Nevertheless, rejection by 148.13, followed by break of 143.98 will resume larger fall from 158.86 through 61.8% projection of 158.86 to 146.52 from 151.20 at 143.57.
In the bigger picture, price actions from 161.94 are seen as a corrective pattern to rise from 102.58 (2021 low), with fall from 158.86 as the third leg. Strong support should be seen from 38.2% retracement of 102.58 to 161.94 at 139.26 to bring rebound. However, sustained break of 139.26 would open up deeper medium term decline to 61.8% retracement at 125.25.